Bolivia Polyurethane (PU) Microspheres Market (2025-2031) | Trends, Outlook, Share, Revenue, Segmentation, Industry, Size, Value, Growth, Forecast, Companies & Analysis
Market Forecast By Applications (Encapsulation, Paints & coatings, Adhesives films, Cosmetics, Other applications) And Competitive Landscape
| Product Code: ETC5738007 | Publication Date: Nov 2023 | Updated Date: Nov 2025 | Product Type: Market Research Report | |
| Publisher: 6Wresearch | Author: Sumit Sagar | No. of Pages: 60 | No. of Figures: 30 | No. of Tables: 5 |
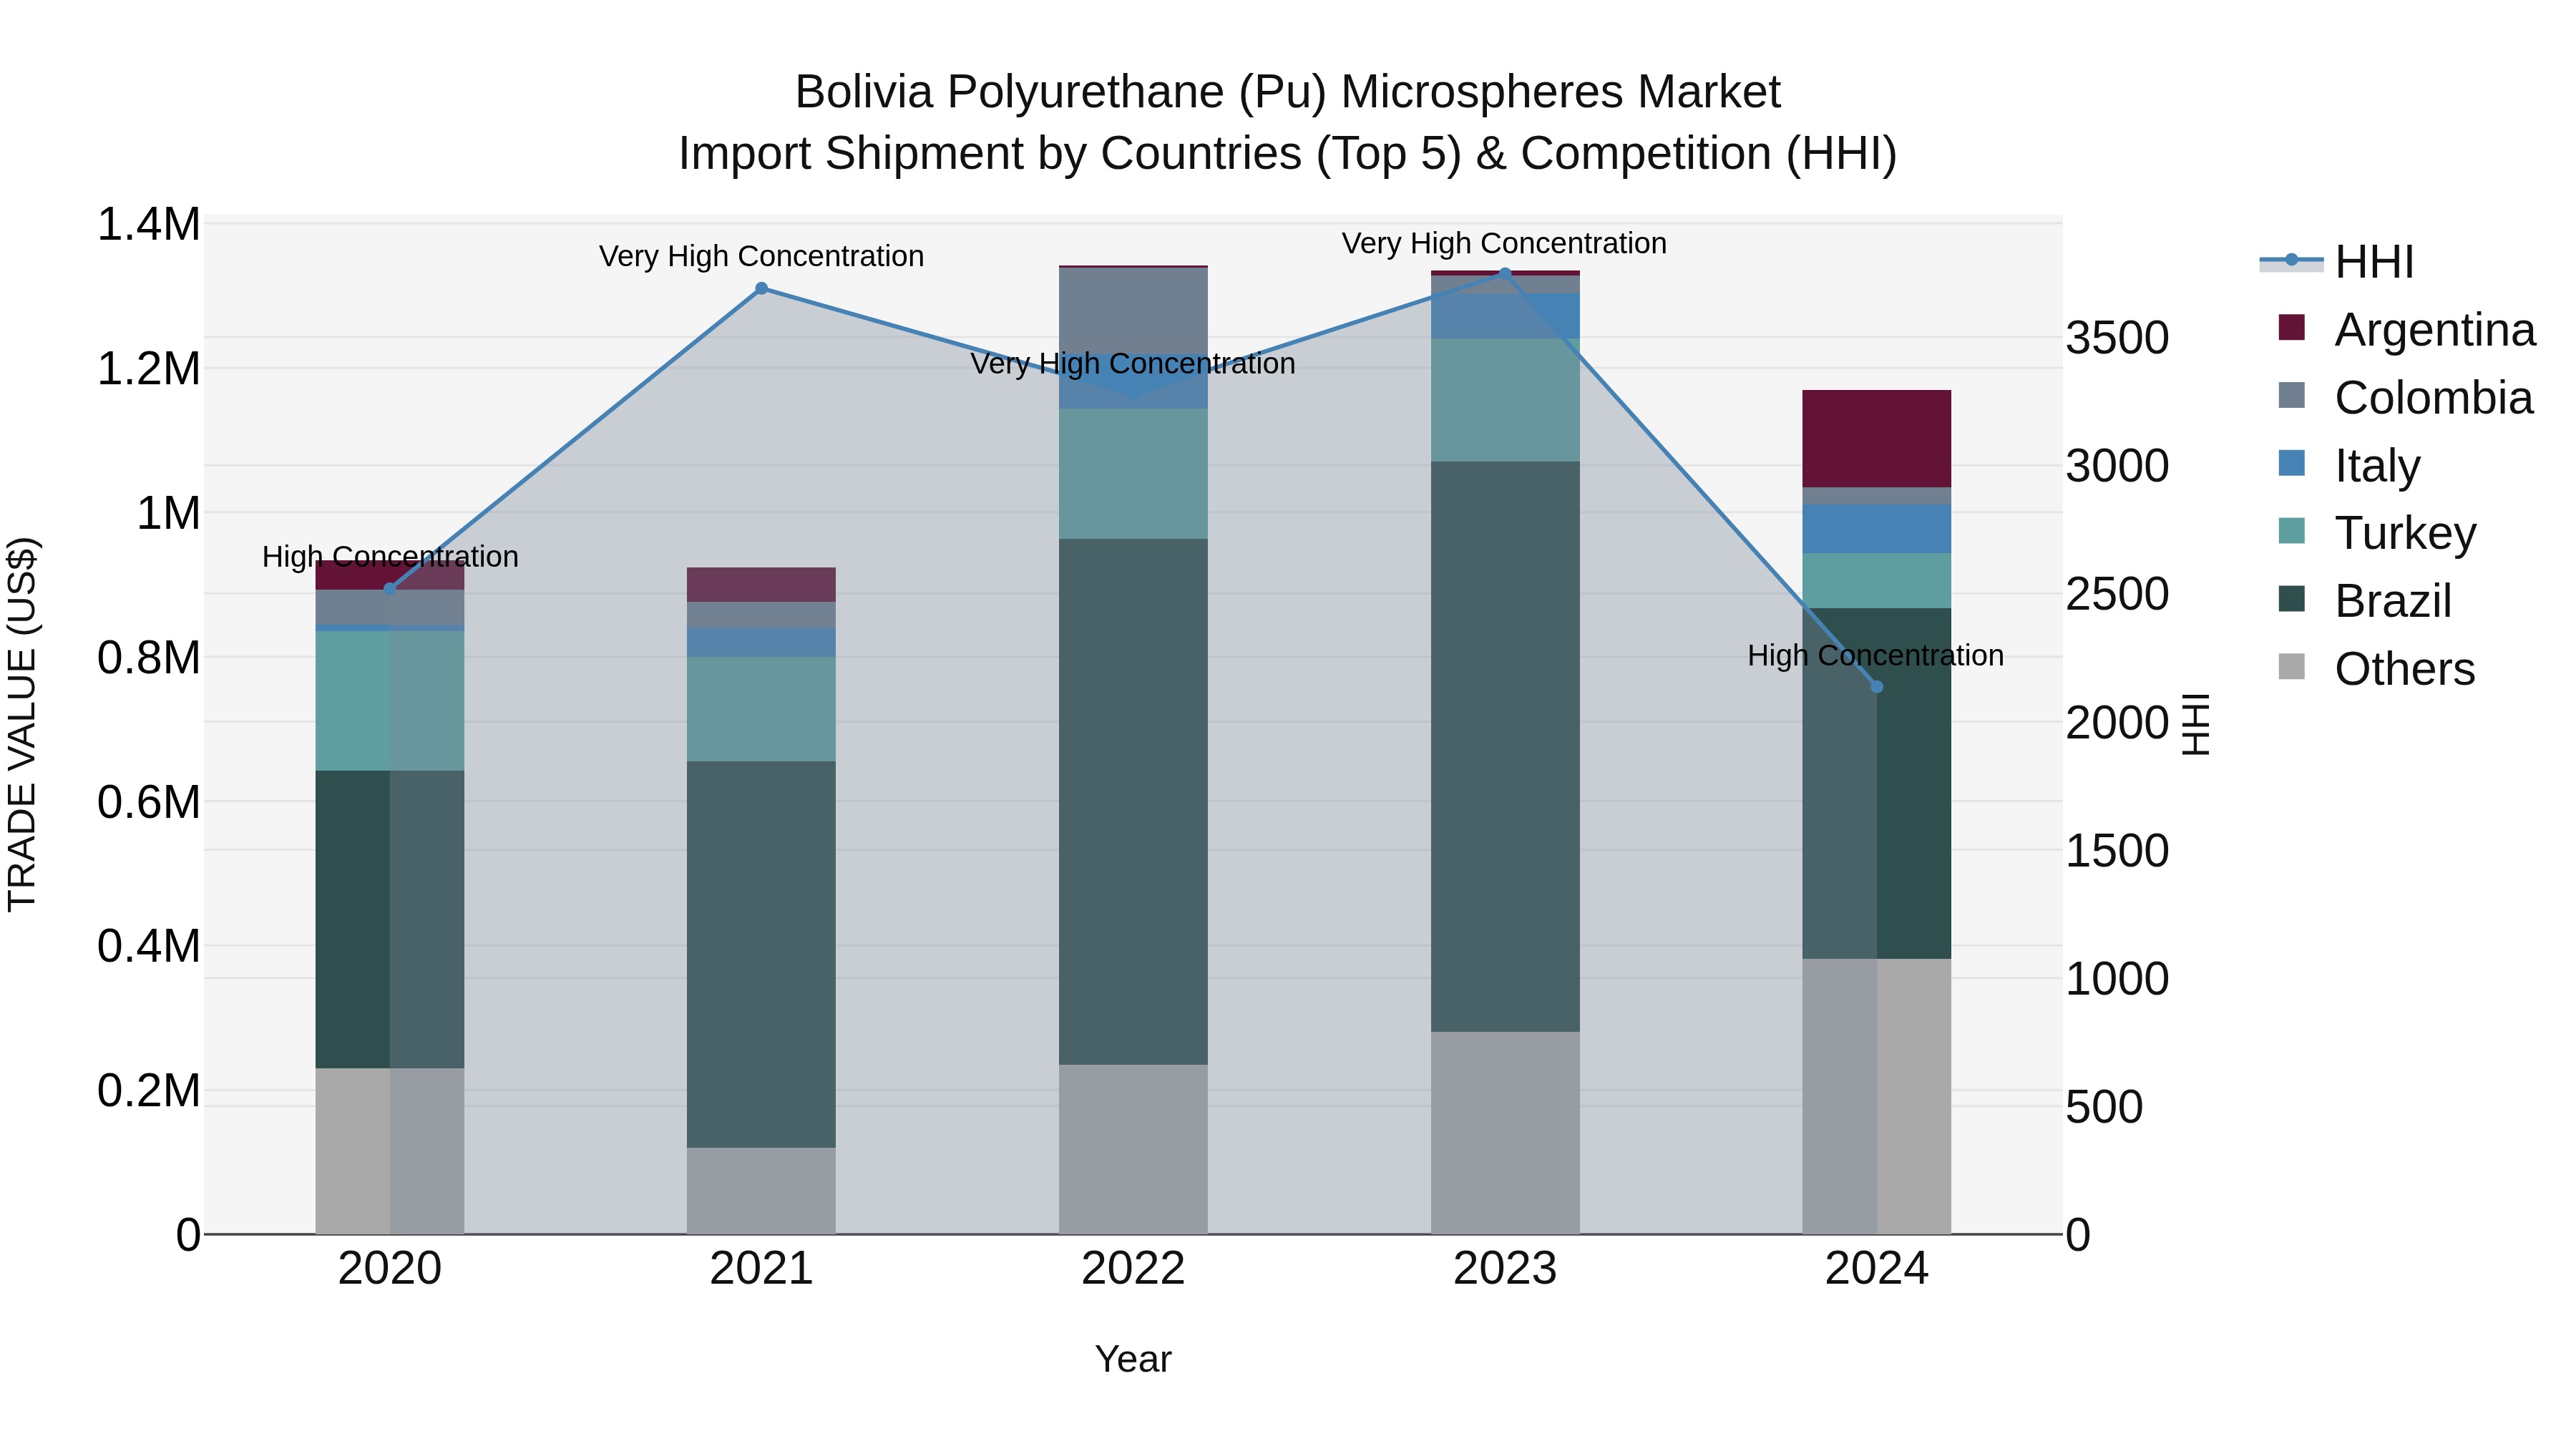
Bolivia Polyurethane Pu Microspheres Market Top 5 Importing Countries and Market Competition (HHI) Analysis
Bolivia import of polyurethane (PU) microspheres saw a shift in concentration towards a more competitive market in 2024, with Brazil, Argentina, China, Spain, and Turkey dominating the export landscape. Despite a decline in growth rate from 2023 to 2024, the compound annual growth rate (CAGR) over the period of 2020-2024 remained positive at 5.79%. The high concentration of the Herfindahl-Hirschman Index (HHI) in 2023 indicates significant market power held by a few key exporters, which slightly decreased in 2024. This evolving market dynamic suggests opportunities for diversification and increased competition in the coming years.
Bolivia Polyurethane (PU) Microspheres Market Overview
The Bolivia polyurethane microspheres market is growing due to the increasing demand for these microspheres in applications such as coatings, adhesives, and medical devices. PU microspheres are valued for their lightweight and durable properties. The market is influenced by advancements in manufacturing technologies and the need for high-performance materials. However, challenges include high production costs and the need for specialized processing techniques.
Drivers of the market
The Bolivia Polyurethane Microspheres market is driven by the increasing use of PU microspheres in various applications, including coatings, cosmetics, and medical devices. PU microspheres are valued for their lightweight, high surface area, and versatility. The growing demand for advanced materials in industries such as aerospace, automotive, and healthcare fuels the market. Additionally, technological advancements in microsphere manufacturing and the rising trend of customization in various applications contribute to market growth.
Challenges of the market
The Bolivia polyurethane microspheres market struggles with high production costs and limited access to specialized raw materials. There is also a lack of advanced manufacturing technology and expertise in the local industry. This, combined with low awareness of the applications and benefits of PU microspheres, hampers market growth and development.
Government Policy of the market
The government supports the polyurethane (PU) microspheres market by promoting research and development in advanced materials and offering incentives for innovation. There are also policies to encourage the establishment of production facilities and training programs for professionals in the field. These efforts are part of a broader strategy to enhance Bolivias position in high-value manufacturing sectors.
Key Highlights of the Report:
- Bolivia Polyurethane (PU) Microspheres Market Outlook
- Market Size of Bolivia Polyurethane (PU) Microspheres Market, 2024
- Forecast of Bolivia Polyurethane (PU) Microspheres Market, 2031
- Historical Data and Forecast of Bolivia Polyurethane (PU) Microspheres Revenues & Volume for the Period 2021-2031
- Bolivia Polyurethane (PU) Microspheres Market Trend Evolution
- Bolivia Polyurethane (PU) Microspheres Market Drivers and Challenges
- Bolivia Polyurethane (PU) Microspheres Price Trends
- Bolivia Polyurethane (PU) Microspheres Porter`s Five Forces
- Bolivia Polyurethane (PU) Microspheres Industry Life Cycle
- Historical Data and Forecast of Bolivia Polyurethane (PU) Microspheres Market Revenues & Volume By Applications for the Period 2021-2031
- Historical Data and Forecast of Bolivia Polyurethane (PU) Microspheres Market Revenues & Volume By Encapsulation for the Period 2021-2031
- Historical Data and Forecast of Bolivia Polyurethane (PU) Microspheres Market Revenues & Volume By Paints & coatings for the Period 2021-2031
- Historical Data and Forecast of Bolivia Polyurethane (PU) Microspheres Market Revenues & Volume By Adhesives films for the Period 2021-2031
- Historical Data and Forecast of Bolivia Polyurethane (PU) Microspheres Market Revenues & Volume By Cosmetics for the Period 2021-2031
- Historical Data and Forecast of Bolivia Polyurethane (PU) Microspheres Market Revenues & Volume By Other applications for the Period 2021-2031
- Bolivia Polyurethane (PU) Microspheres Import Export Trade Statistics
- Market Opportunity Assessment By Applications
- Bolivia Polyurethane (PU) Microspheres Top Companies Market Share
- Bolivia Polyurethane (PU) Microspheres Competitive Benchmarking By Technical and Operational Parameters
- Bolivia Polyurethane (PU) Microspheres Company Profiles
- Bolivia Polyurethane (PU) Microspheres Key Strategic Recommendations
Frequently Asked Questions About the Market Study (FAQs):
6Wresearch actively monitors the Bolivia Polyurethane (PU) Microspheres Market and publishes its comprehensive annual report, highlighting emerging trends, growth drivers, revenue analysis, and forecast outlook. Our insights help businesses to make data-backed strategic decisions with ongoing market dynamics. Our analysts track relevent industries related to the Bolivia Polyurethane (PU) Microspheres Market, allowing our clients with actionable intelligence and reliable forecasts tailored to emerging regional needs.
Yes, we provide customisation as per your requirements. To learn more, feel free to contact us on sales@6wresearch.com
1 Executive Summary |
2 Introduction |
2.1 Key Highlights of the Report |
2.2 Report Description |
2.3 Market Scope & Segmentation |
2.4 Research Methodology |
2.5 Assumptions |
3 Bolivia Polyurethane (PU) Microspheres Market Overview |
3.1 Bolivia Country Macro Economic Indicators |
3.2 Bolivia Polyurethane (PU) Microspheres Market Revenues & Volume, 2021 & 2031F |
3.3 Bolivia Polyurethane (PU) Microspheres Market - Industry Life Cycle |
3.4 Bolivia Polyurethane (PU) Microspheres Market - Porter's Five Forces |
3.5 Bolivia Polyurethane (PU) Microspheres Market Revenues & Volume Share, By Applications, 2021 & 2031F |
4 Bolivia Polyurethane (PU) Microspheres Market Dynamics |
4.1 Impact Analysis |
4.2 Market Drivers |
4.2.1 Increasing demand for lightweight materials in various industries |
4.2.2 Growing awareness about the benefits of polyurethane microspheres in different applications |
4.2.3 Rising focus on sustainable and eco-friendly products in Bolivia |
4.3 Market Restraints |
4.3.1 High production costs associated with polyurethane microspheres |
4.3.2 Lack of skilled labor and expertise in manufacturing processes |
4.3.3 Stringent regulations and standards for the use of polyurethane materials |
5 Bolivia Polyurethane (PU) Microspheres Market Trends |
6 Bolivia Polyurethane (PU) Microspheres Market Segmentations |
6.1 Bolivia Polyurethane (PU) Microspheres Market, By Applications |
6.1.1 Overview and Analysis |
6.1.2 Bolivia Polyurethane (PU) Microspheres Market Revenues & Volume, By Encapsulation, 2021-2031F |
6.1.3 Bolivia Polyurethane (PU) Microspheres Market Revenues & Volume, By Paints & coatings, 2021-2031F |
6.1.4 Bolivia Polyurethane (PU) Microspheres Market Revenues & Volume, By Adhesives films, 2021-2031F |
6.1.5 Bolivia Polyurethane (PU) Microspheres Market Revenues & Volume, By Cosmetics, 2021-2031F |
6.1.6 Bolivia Polyurethane (PU) Microspheres Market Revenues & Volume, By Other applications, 2021-2031F |
7 Bolivia Polyurethane (PU) Microspheres Market Import-Export Trade Statistics |
7.1 Bolivia Polyurethane (PU) Microspheres Market Export to Major Countries |
7.2 Bolivia Polyurethane (PU) Microspheres Market Imports from Major Countries |
8 Bolivia Polyurethane (PU) Microspheres Market Key Performance Indicators |
8.1 Research and development investment in new polyurethane microsphere technologies |
8.2 Adoption rate of polyurethane microspheres in key industries in Bolivia |
8.3 Environmental impact assessments and sustainability certifications for polyurethane microspheres |
9 Bolivia Polyurethane (PU) Microspheres Market - Opportunity Assessment |
9.1 Bolivia Polyurethane (PU) Microspheres Market Opportunity Assessment, By Applications, 2021 & 2031F |
10 Bolivia Polyurethane (PU) Microspheres Market - Competitive Landscape |
10.1 Bolivia Polyurethane (PU) Microspheres Market Revenue Share, By Companies, 2024 |
10.2 Bolivia Polyurethane (PU) Microspheres Market Competitive Benchmarking, By Operating and Technical Parameters |
11 Company Profiles |
12 Recommendations | 13 Disclaimer |
Global Go To Market Strategy - 2030
Export potential enables firms to identify high-growth global markets with greater confidence by combining advanced trade intelligence with a structured quantitative methodology. The framework analyzes emerging demand trends and country-level import patterns while integrating macroeconomic and trade datasets such as GDP and population forecasts, bilateral import–export flows, tariff structures, elasticity differentials between developed and developing economies, geographic distance, and import demand projections. Using weighted trade values from 2020–2024 as the base period to project country-to-country export potential for 2030, these inputs are operationalized through calculated drivers such as gravity model parameters, tariff impact factors, and projected GDP per-capita growth. Through an analysis of hidden potentials, demand hotspots, and market conditions that are most favorable to success, this method enables firms to focus on target countries, maximize returns, and global expansion with data, backed by accuracy.
By factoring in the projected importer demand gap that is currently unmet and could be potential opportunity, it identifies the potential for the Exporter (Country) among 190 countries, against the general trade analysis, which identifies the biggest importer or exporter.
To discover high-growth global markets and optimize your business strategy:
Click Here
Pricing
- Single User License$ 1,995
- Department License$ 2,400
- Site License$ 3,120
- Global License$ 3,795

Leadership Perspectives from Industry Events
Search
Thought Leadership and Analyst Meet


Our Clients
6WResearch In News
- Doha a strategic location for EV manufacturing hub: IPA Qatar
- Demand for luxury TVs surging in the GCC, says Samsung
- Empowering Growth: The Thriving Journey of Bangladesh’s Cable Industry
- Demand for luxury TVs surging in the GCC, says Samsung
- Video call with a traditional healer? Once unthinkable, it’s now common in South Africa
- Intelligent Buildings To Smooth GCC’s Path To Net Zero
Latest Reports
- Cape Verde Portable Hand-Thrown Extinguisher Market (2026-2032)
- Canada Portable Hand-Thrown Extinguisher Market (2026-2032)
- Cameroon Portable Hand-Thrown Extinguisher Market (2026-2032)
- Burundi Portable Hand-Thrown Extinguisher Market (2026-2032)
- Burkina Faso Portable Hand-Thrown Extinguisher Market (2026-2032)
- Bulgaria Portable Hand-Thrown Extinguisher Market (2026-2032)
- Brunei Portable Hand-Thrown Extinguisher Market (2026-2032)
- Botswana Portable Hand-Thrown Extinguisher Market (2026-2032)
- Bosnia and Herzegovina Portable Hand-Thrown Extinguisher Market (2026-2032)
- Bolivia Portable Hand-Thrown Extinguisher Market (2026-2032)
Industry Events and Analyst Meet

HIMTEX 2026

India Refining Summit 2026

India EV Show 2026

EV tech India Expo 2026

Auto Tech Asia 2026
Whitepaper
- Middle East & Africa Commercial Security Market Click here to view more.
- Middle East & Africa Fire Safety Systems & Equipment Market Click here to view more.
- GCC Drone Market Click here to view more.
- Middle East Lighting Fixture Market Click here to view more.
- GCC Physical & Perimeter Security Market Click here to view more.