New Zealand Sweet Spread Market (2026-2032) | Outlook, Growth, Restraints, Size, Supply, Forecast, Strategy, Industry, Value, Segments, Drivers, Challenges, Trends, Competition, Opportunities, Demand, Pricing Analysis, Investment Trends, Consumer Insights, Companies, Analysis, Competitive, Strategic Insights, Revenue, Segmentation, Share
Market Forecast By Product Type (Honey Spread, Nutbased Spread, Fruitbased Spread), By Flavor (Natural Sweeteners, Chocolate Hazelnut, Strawberry Jam), By Packaging (Glass Jars, Plastic Containers, Tub Packaging), By End User (Retailers, Supermarkets, Online Retailers) And Competitive Landscape
| Product Code: ETC10883917 | Publication Date: Apr 2025 | Updated Date: Apr 2026 | Product Type: Market Research Report | |
| Publisher: 6Wresearch | Author: Bhawna Singh | No. of Pages: 65 | No. of Figures: 34 | No. of Tables: 19 |
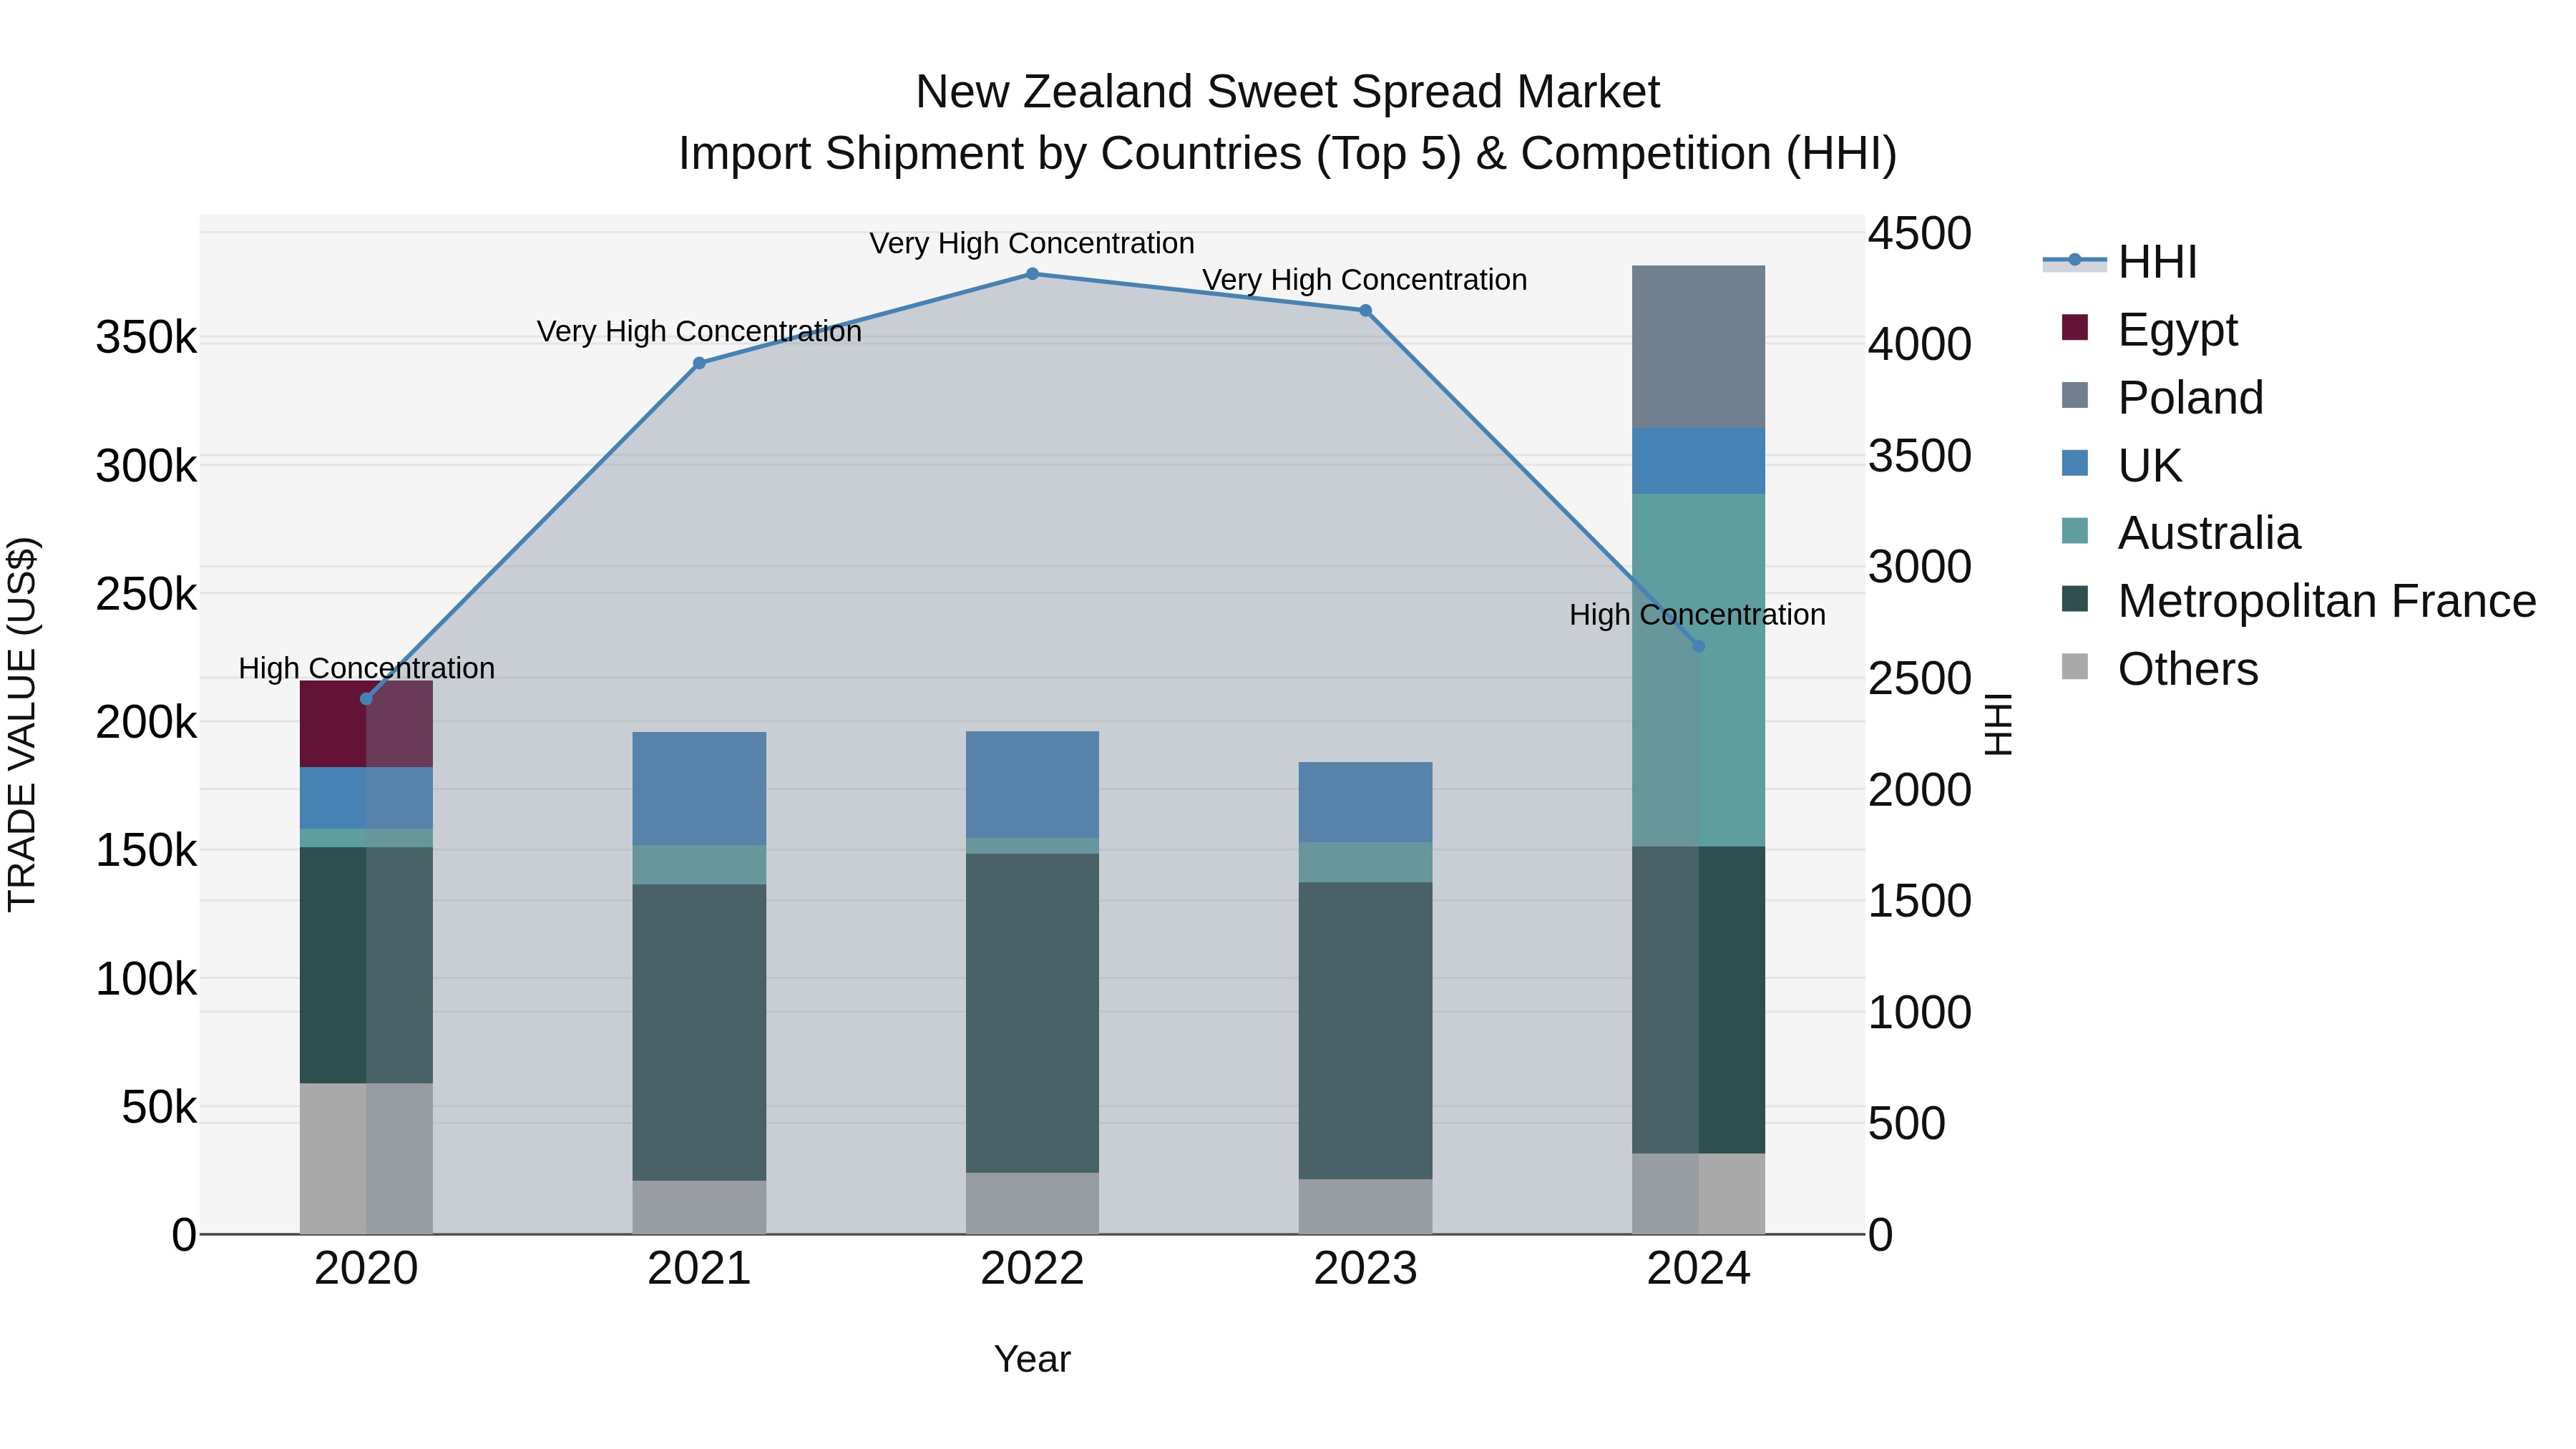
New Zealand Sweet Spread Market Top 5 Importing Countries and Market Competition (HHI) Analysis
The New Zealand sweet spread import market continues to show significant growth, with a high concentration of shipments coming from top exporters such as Australia, Metropolitan France, Poland, UK, and Peru. The market concentration remained high in 2024, indicating a competitive landscape. The impressive Compound Annual Growth Rate (CAGR) of 15.0% from 2020 to 2024 highlights the increasing demand for sweet spreads in New Zealand. Moreover, the remarkable growth rate of 105.08% from 2023 to 2024 demonstrates the rapid expansion of the market, creating opportunities for both local retailers and international exporters.
Key Highlights of the Report:
- New Zealand Sweet Spread Market Outlook
- Market Size of New Zealand Sweet Spread Market, 2025
- Forecast of New Zealand Sweet Spread Market, 2032
- Historical Data and Forecast of New Zealand Sweet Spread Revenues & Volume for the Period 2022 - 2032F
- New Zealand Sweet Spread Market Trend Evolution
- New Zealand Sweet Spread Market Drivers and Challenges
- New Zealand Sweet Spread Price Trends
- New Zealand Sweet Spread Porter's Five Forces
- New Zealand Sweet Spread Industry Life Cycle
- Historical Data and Forecast of New Zealand Sweet Spread Market Revenues & Volume By Product Type for the Period 2022 - 2032F
- Historical Data and Forecast of New Zealand Sweet Spread Market Revenues & Volume By Honey Spread for the Period 2022 - 2032F
- Historical Data and Forecast of New Zealand Sweet Spread Market Revenues & Volume By Nutbased Spread for the Period 2022 - 2032F
- Historical Data and Forecast of New Zealand Sweet Spread Market Revenues & Volume By Fruitbased Spread for the Period 2022 - 2032F
- Historical Data and Forecast of New Zealand Sweet Spread Market Revenues & Volume By Flavor for the Period 2022 - 2032F
- Historical Data and Forecast of New Zealand Sweet Spread Market Revenues & Volume By Natural Sweeteners for the Period 2022 - 2032F
- Historical Data and Forecast of New Zealand Sweet Spread Market Revenues & Volume By Chocolate Hazelnut for the Period 2022 - 2032F
- Historical Data and Forecast of New Zealand Sweet Spread Market Revenues & Volume By Strawberry Jam for the Period 2022 - 2032F
- Historical Data and Forecast of New Zealand Sweet Spread Market Revenues & Volume By Packaging for the Period 2022 - 2032F
- Historical Data and Forecast of New Zealand Sweet Spread Market Revenues & Volume By Glass Jars for the Period 2022 - 2032F
- Historical Data and Forecast of New Zealand Sweet Spread Market Revenues & Volume By Plastic Containers for the Period 2022 - 2032F
- Historical Data and Forecast of New Zealand Sweet Spread Market Revenues & Volume By Tub Packaging for the Period 2022 - 2032F
- Historical Data and Forecast of New Zealand Sweet Spread Market Revenues & Volume By End User for the Period 2022 - 2032F
- Historical Data and Forecast of New Zealand Sweet Spread Market Revenues & Volume By Retailers for the Period 2022 - 2032F
- Historical Data and Forecast of New Zealand Sweet Spread Market Revenues & Volume By Supermarkets for the Period 2022 - 2032F
- Historical Data and Forecast of New Zealand Sweet Spread Market Revenues & Volume By Online Retailers for the Period 2022 - 2032F
- New Zealand Sweet Spread Import Export Trade Statistics
- Market Opportunity Assessment By Product Type
- Market Opportunity Assessment By Flavor
- Market Opportunity Assessment By Packaging
- Market Opportunity Assessment By End User
- New Zealand Sweet Spread Top Companies Market Share
- New Zealand Sweet Spread Competitive Benchmarking By Technical and Operational Parameters
- New Zealand Sweet Spread Company Profiles
- New Zealand Sweet Spread Key Strategic Recommendations
Frequently Asked Questions About the Market Study (FAQs):
6Wresearch actively monitors the New Zealand Sweet Spread Market and publishes its comprehensive annual report, highlighting emerging trends, growth drivers, revenue analysis, and forecast outlook. Our insights help businesses to make data-backed strategic decisions with ongoing market dynamics. Our analysts track relevent industries related to the New Zealand Sweet Spread Market, allowing our clients with actionable intelligence and reliable forecasts tailored to emerging regional needs.
Yes, we provide customisation as per your requirements. To learn more, feel free to contact us on sales@6wresearch.com
1 Executive Summary |
2 Introduction |
2.1 Key Highlights of the Report |
2.2 Report Description |
2.3 Market Scope & Segmentation |
2.4 Research Methodology |
2.5 Assumptions |
3 New Zealand Sweet Spread Market Overview |
3.1 New Zealand Country Macro Economic Indicators |
3.2 New Zealand Sweet Spread Market Revenues & Volume, 2022 & 2032F |
3.3 New Zealand Sweet Spread Market - Industry Life Cycle |
3.4 New Zealand Sweet Spread Market - Porter's Five Forces |
3.5 New Zealand Sweet Spread Market Revenues & Volume Share, By Product Type, 2022 & 2032F |
3.6 New Zealand Sweet Spread Market Revenues & Volume Share, By Flavor, 2022 & 2032F |
3.7 New Zealand Sweet Spread Market Revenues & Volume Share, By Packaging, 2022 & 2032F |
3.8 New Zealand Sweet Spread Market Revenues & Volume Share, By End User, 2022 & 2032F |
4 New Zealand Sweet Spread Market Dynamics |
4.1 Impact Analysis |
4.2 Market Drivers |
4.2.1 Changing consumer preferences towards healthier and natural sweet spreads |
4.2.2 Increasing demand for premium and artisanal sweet spreads |
4.2.3 Growing awareness about the health benefits of natural sweeteners in sweet spreads |
4.3 Market Restraints |
4.3.1 Fluctuating prices of key ingredients such as sugar and fruits |
4.3.2 Competition from substitutes like savory spreads and nut butter |
4.3.3 Regulatory challenges related to food safety and labeling laws |
5 New Zealand Sweet Spread Market Trends |
6 New Zealand Sweet Spread Market, By Types |
6.1 New Zealand Sweet Spread Market, By Product Type |
6.1.1 Overview and Analysis |
6.1.2 New Zealand Sweet Spread Market Revenues & Volume, By Product Type, 2022 - 2032F |
6.1.3 New Zealand Sweet Spread Market Revenues & Volume, By Honey Spread, 2022 - 2032F |
6.1.4 New Zealand Sweet Spread Market Revenues & Volume, By Nutbased Spread, 2022 - 2032F |
6.1.5 New Zealand Sweet Spread Market Revenues & Volume, By Fruitbased Spread, 2022 - 2032F |
6.2 New Zealand Sweet Spread Market, By Flavor |
6.2.1 Overview and Analysis |
6.2.2 New Zealand Sweet Spread Market Revenues & Volume, By Natural Sweeteners, 2022 - 2032F |
6.2.3 New Zealand Sweet Spread Market Revenues & Volume, By Chocolate Hazelnut, 2022 - 2032F |
6.2.4 New Zealand Sweet Spread Market Revenues & Volume, By Strawberry Jam, 2022 - 2032F |
6.3 New Zealand Sweet Spread Market, By Packaging |
6.3.1 Overview and Analysis |
6.3.2 New Zealand Sweet Spread Market Revenues & Volume, By Glass Jars, 2022 - 2032F |
6.3.3 New Zealand Sweet Spread Market Revenues & Volume, By Plastic Containers, 2022 - 2032F |
6.3.4 New Zealand Sweet Spread Market Revenues & Volume, By Tub Packaging, 2022 - 2032F |
6.4 New Zealand Sweet Spread Market, By End User |
6.4.1 Overview and Analysis |
6.4.2 New Zealand Sweet Spread Market Revenues & Volume, By Retailers, 2022 - 2032F |
6.4.3 New Zealand Sweet Spread Market Revenues & Volume, By Supermarkets, 2022 - 2032F |
6.4.4 New Zealand Sweet Spread Market Revenues & Volume, By Online Retailers, 2022 - 2032F |
7 New Zealand Sweet Spread Market Import-Export Trade Statistics |
7.1 New Zealand Sweet Spread Market Export to Major Countries |
7.2 New Zealand Sweet Spread Market Imports from Major Countries |
8 New Zealand Sweet Spread Market Key Performance Indicators |
8.1 Consumer engagement on social media platforms for sweet spread brands |
8.2 Number of new product launches in the sweet spread market |
8.3 Growth in the organic sweet spread segment |
8.4 Percentage of households buying sweet spreads with natural ingredients |
8.5 Increase in the number of specialty stores carrying a variety of sweet spread brands |
9 New Zealand Sweet Spread Market - Opportunity Assessment |
9.1 New Zealand Sweet Spread Market Opportunity Assessment, By Product Type, 2022 & 2032F |
9.2 New Zealand Sweet Spread Market Opportunity Assessment, By Flavor, 2022 & 2032F |
9.3 New Zealand Sweet Spread Market Opportunity Assessment, By Packaging, 2022 & 2032F |
9.4 New Zealand Sweet Spread Market Opportunity Assessment, By End User, 2022 & 2032F |
10 New Zealand Sweet Spread Market - Competitive Landscape |
10.1 New Zealand Sweet Spread Market Revenue Share, By Companies, 2025 |
10.2 New Zealand Sweet Spread Market Competitive Benchmarking, By Operating and Technical Parameters |
11 Company Profiles |
12 Recommendations |
13 Disclaimer |
Export potential assessment - trade Analytics for 2030
Export potential enables firms to identify high-growth global markets with greater confidence by combining advanced trade intelligence with a structured quantitative methodology. The framework analyzes emerging demand trends and country-level import patterns while integrating macroeconomic and trade datasets such as GDP and population forecasts, bilateral import–export flows, tariff structures, elasticity differentials between developed and developing economies, geographic distance, and import demand projections. Using weighted trade values from 2020–2024 as the base period to project country-to-country export potential for 2030, these inputs are operationalized through calculated drivers such as gravity model parameters, tariff impact factors, and projected GDP per-capita growth. Through an analysis of hidden potentials, demand hotspots, and market conditions that are most favorable to success, this method enables firms to focus on target countries, maximize returns, and global expansion with data, backed by accuracy.
By factoring in the projected importer demand gap that is currently unmet and could be potential opportunity, it identifies the potential for the Exporter (Country) among 190 countries, against the general trade analysis, which identifies the biggest importer or exporter.
To discover high-growth global markets and optimize your business strategy:
Click Here
Pricing
- Single User License$ 1,995
- Department License$ 2,400
- Site License$ 3,120
- Global License$ 3,795

Thought Leadership
Search
Thought Leadership and Analyst Meet


Our Clients
Latest Reports
- New Zealand Aseptic Manufacturing Market (2026-2032)
- Netherlands Aseptic Manufacturing Market (2026-2032)
- Nauru Aseptic Manufacturing Market (2026-2032)
- Namibia Aseptic Manufacturing Market (2026-2032)
- Mozambique Aseptic Manufacturing Market (2026-2032)
- Montenegro Aseptic Manufacturing Market (2026-2032)
- Mongolia Aseptic Manufacturing Market (2026-2032)
- Monaco Aseptic Manufacturing Market (2026-2032)
- Micronesia Aseptic Manufacturing Market (2026-2032)
- Mauritius Aseptic Manufacturing Market (2026-2032)
Industry Events and Analyst Meet

HIMTEX 2026

India Refining Summit 2026

India EV Show 2026

EV tech India Expo 2026

Auto Tech Asia 2026
Whitepaper
- Middle East & Africa Commercial Security Market Click here to view more.
- Middle East & Africa Fire Safety Systems & Equipment Market Click here to view more.
- GCC Drone Market Click here to view more.
- Middle East Lighting Fixture Market Click here to view more.
- GCC Physical & Perimeter Security Market Click here to view more.
6WResearch In News
- Doha a strategic location for EV manufacturing hub: IPA Qatar
- Demand for luxury TVs surging in the GCC, says Samsung
- Empowering Growth: The Thriving Journey of Bangladesh’s Cable Industry
- Demand for luxury TVs surging in the GCC, says Samsung
- Video call with a traditional healer? Once unthinkable, it’s now common in South Africa
- Intelligent Buildings To Smooth GCC’s Path To Net Zero