Nigeria Activated Carbon for Mercury Control Market (2025-2031) Outlook | Size, Growth, Industry, Value, Trends, Revenue, Share, Analysis, Forecast & Companies
Market Forecast By Application (Coal Burning, Gold Mining, Cement Production, Ferrous & Non-Ferrous Metals, Oil & Gas Burning, Oil Refining , Others) And Competitive Landscape
| Product Code: ETC4484630 | Publication Date: Jul 2023 | Updated Date: Nov 2025 | Product Type: Report | |
| Publisher: 6Wresearch | Author: Shubham Padhi | No. of Pages: 85 | No. of Figures: 45 | No. of Tables: 25 |
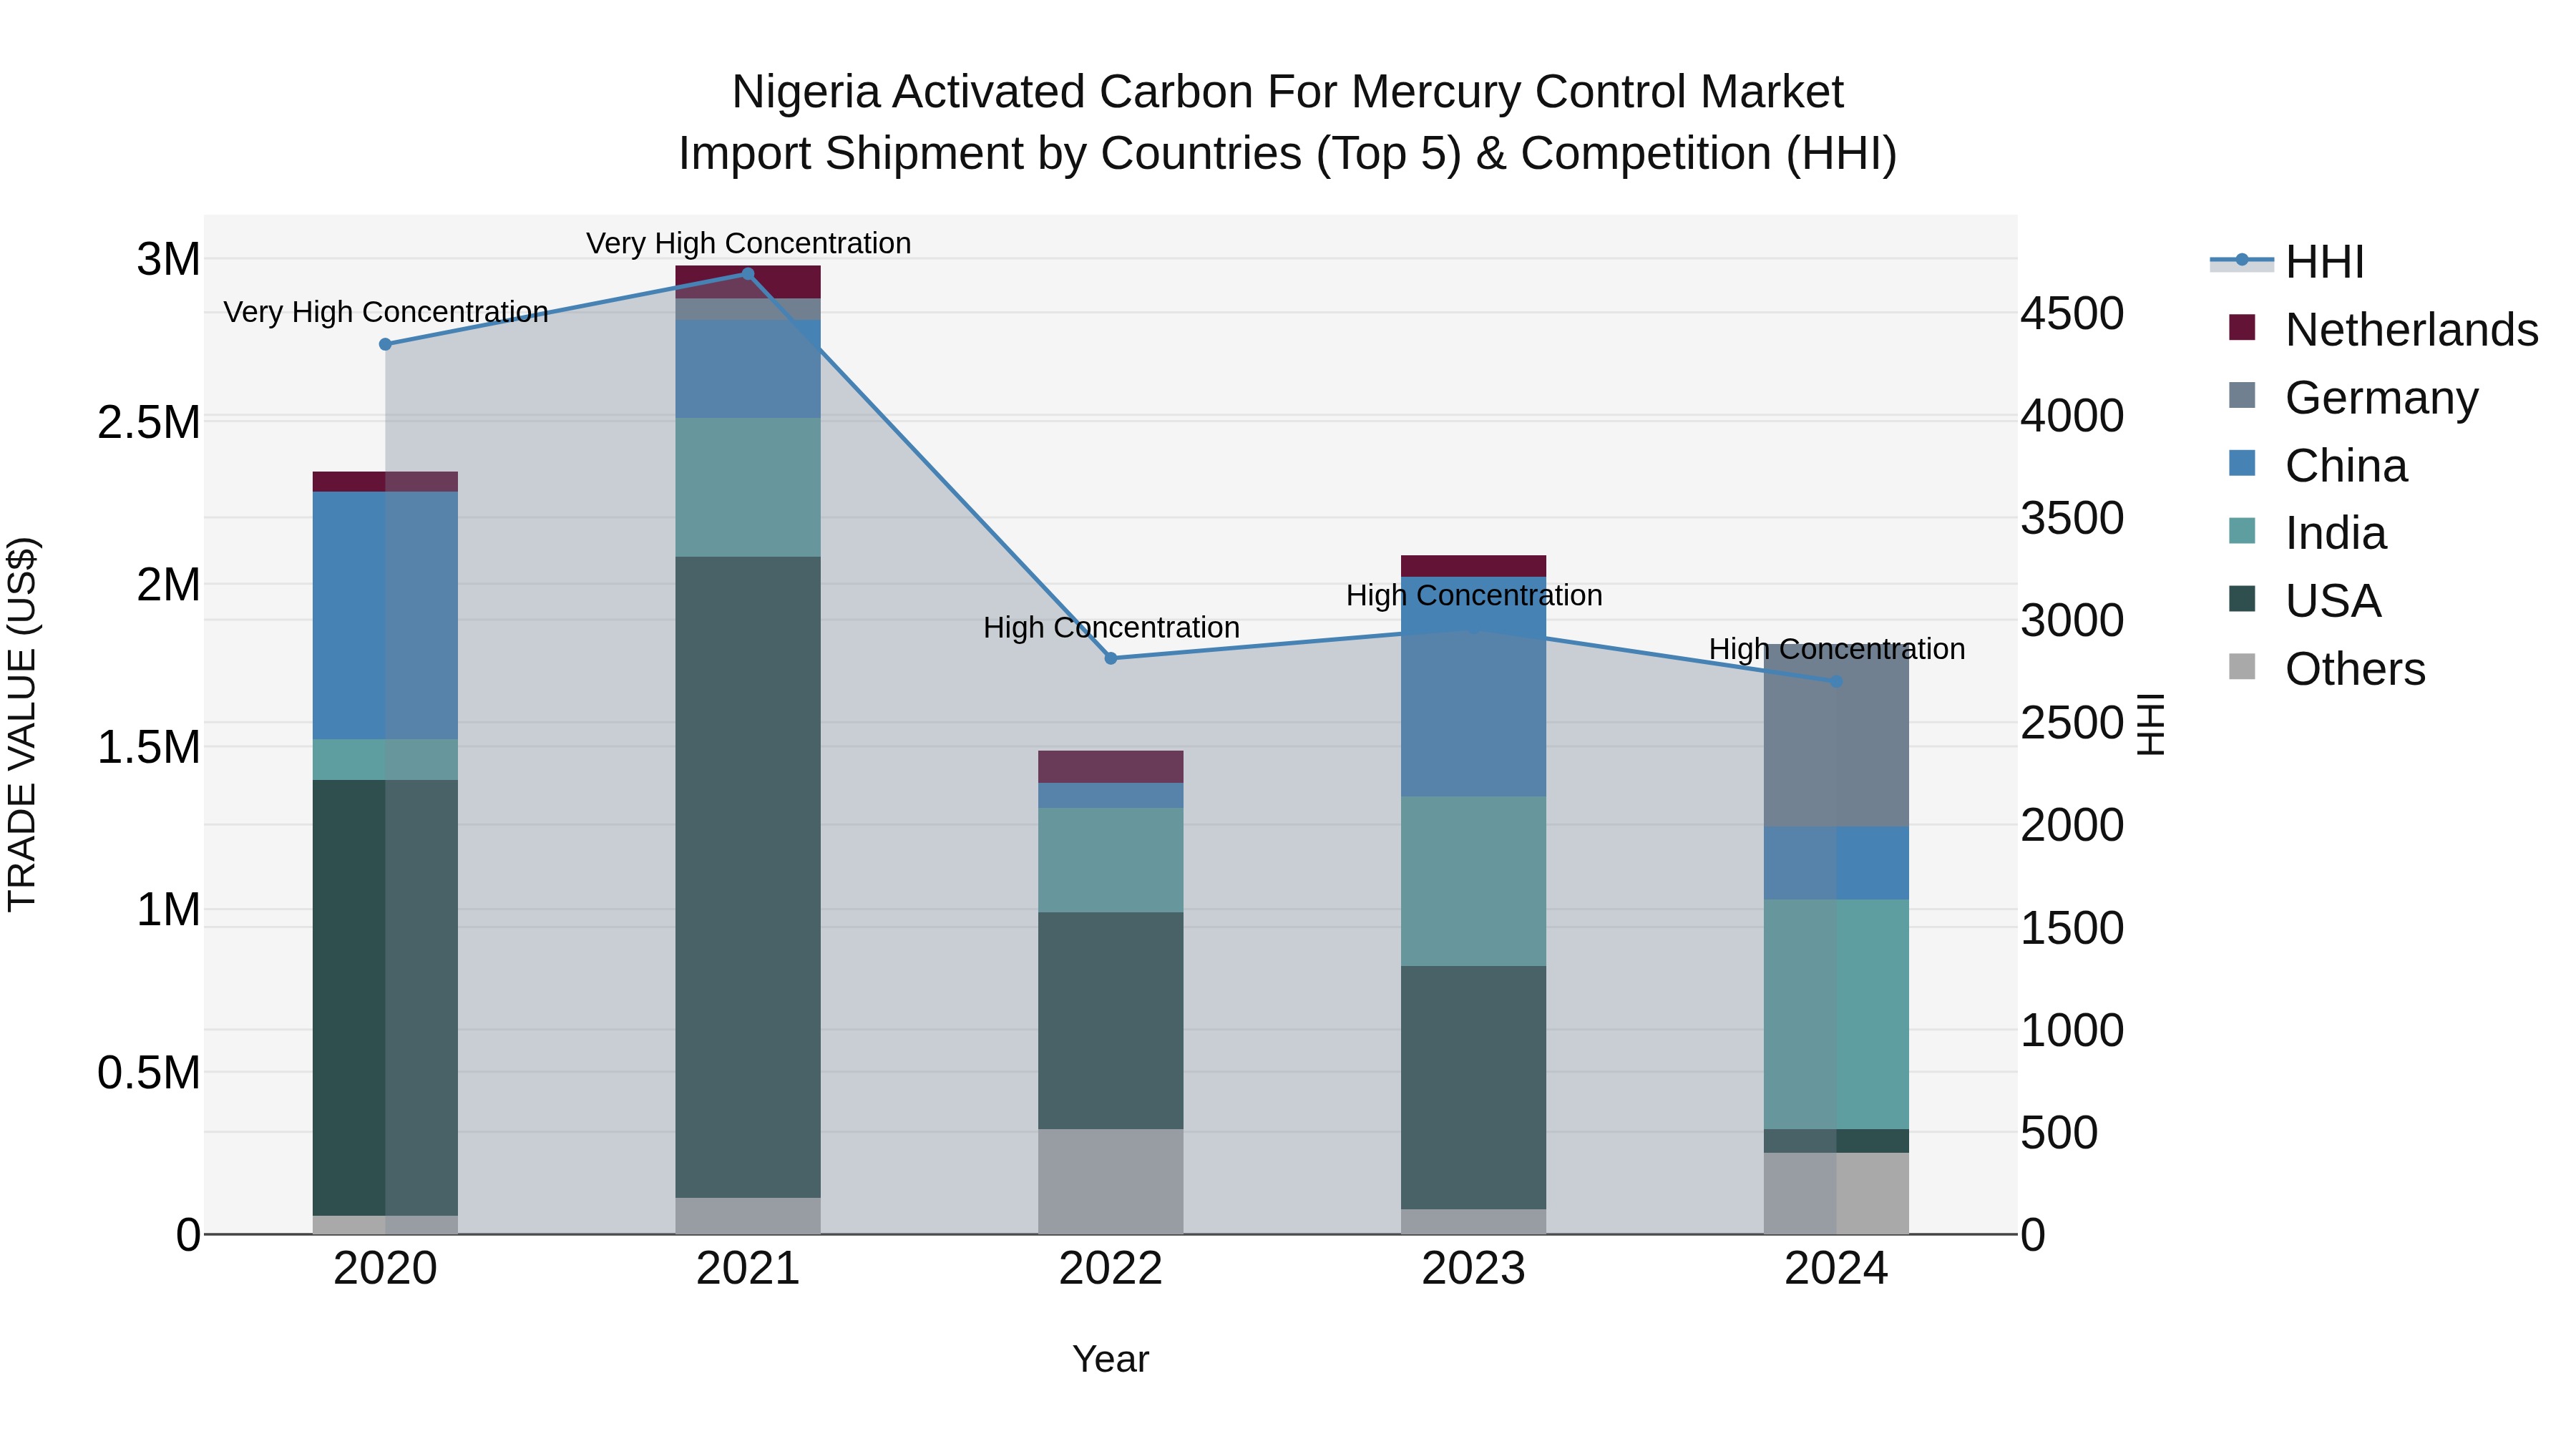
Nigeria Activated Carbon For Mercury Control Market Top 5 Importing Countries and Market Competition (HHI) Analysis
In 2024, Nigeria continued to rely on imports of activated carbon for mercury control, with top exporting countries being India, Germany, China, South Africa, and Malaysia. Despite a high Herfindahl-Hirschman Index indicating market concentration, the industry experienced a negative compound annual growth rate of -6.21% from 2020 to 2024. Furthermore, the growth rate plummeted even further in 2024 with a decline of -13.06%, reflecting challenges faced by the sector. It will be essential for market players to adapt and innovate in order to navigate these difficult market conditions effectively.
Nigeria Activated Carbon for Mercury Control Market Overview
The Nigeria Activated Carbon for Mercury Control Market is experiencing growth due to increasing environmental regulations focusing on reducing mercury emissions from various industries such as power plants, cement production, and waste incineration. Activated carbon has emerged as a key solution for mercury control due to its high efficiency in capturing mercury from flue gases. The market is driven by the rising awareness about the harmful effects of mercury pollution on human health and the environment, prompting industries to invest in effective control measures. Additionally, advancements in activated carbon technology, such as improved pore structures and surface areas, are enhancing the performance of these products in mercury control applications. Overall, the Nigeria Activated Carbon for Mercury Control Market is poised for steady growth as industries strive to meet stringent environmental standards.
Nigeria Activated Carbon for Mercury Control Market Trends and Opportunities
The Nigeria Activated Carbon for Mercury Control Market is experiencing growth due to strict environmental regulations and increasing awareness about the harmful effects of mercury emissions. The market is witnessing a rising demand for activated carbon products as they are effective in capturing and removing mercury from industrial emissions. Opportunities in the market include technological advancements in activated carbon production, increasing investments in pollution control measures by industries, and the potential for partnerships with international companies for knowledge and technology transfer. The market is also benefiting from the growing focus on sustainable practices and the shift towards cleaner energy sources. Overall, the Nigeria Activated Carbon for Mercury Control Market presents promising growth prospects for companies operating in the environmental protection and pollution control sector.
Nigeria Activated Carbon for Mercury Control Market Challenges
In the Nigeria Activated Carbon for Mercury Control Market, challenges include limited awareness and understanding of the benefits of using activated carbon for mercury control among industries, leading to a slower adoption rate. Additionally, there is a lack of stringent regulations mandating the use of activated carbon for mercury control, which results in inconsistent demand for these products. Infrastructure constraints and inadequate distribution networks also hinder the market growth by limiting the availability of activated carbon products in remote areas. Moreover, the cost associated with implementing activated carbon technologies can be a barrier for smaller industries with limited budgets, further complicating market penetration and growth in Nigeria.
Nigeria Activated Carbon for Mercury Control Market Drivers
The Nigeria Activated Carbon for Mercury Control Market is primarily driven by the increasing industrial activities and coal-fired power plants in the country, leading to higher mercury emissions that need to be controlled to meet environmental regulations. Additionally, growing awareness about the harmful effects of mercury pollution on human health and the environment is pushing industries to adopt activated carbon solutions for effective mercury control. Government initiatives to enforce stricter emission standards and promote clean energy sources are also driving the demand for activated carbon in mercury control applications. Furthermore, the expanding industries such as mining, oil & gas, and wastewater treatment are creating opportunities for the market growth as these sectors require efficient mercury control measures to ensure compliance with regulations and sustainability goals.
Nigeria Activated Carbon for Mercury Control Market Government Policy
The Nigerian government has implemented policies to regulate emissions of mercury in various sectors, leading to a growing demand for activated carbon for mercury control in industries such as mining, power generation, and oil and gas. The National Environmental Standards and Regulations Enforcement Agency (NESREA) has set limits on mercury emissions and requires industries to comply with these standards. Additionally, the government has been promoting the use of activated carbon as an effective technology for mercury control through awareness campaigns and supporting research and development efforts in this area. These policies have created opportunities for companies in the activated carbon market to provide solutions for mercury control and contribute to environmental protection efforts in Nigeria.
Nigeria Activated Carbon for Mercury Control Market Future Outlook
The Nigeria Activated Carbon for Mercury Control Market is expected to witness steady growth in the coming years due to increasing awareness about the harmful effects of mercury emissions on human health and the environment. Government regulations and initiatives aimed at reducing mercury emissions from industries are likely to drive the demand for activated carbon-based mercury control solutions. Additionally, the growing industrial sector in Nigeria, particularly in sectors such as power generation, cement production, and mining, is expected to further boost the demand for activated carbon for mercury control applications. With a focus on sustainable development and environmental protection, the market is projected to experience a positive trajectory as companies invest in technologies to comply with stringent regulations and reduce their environmental footprint.
Key Highlights of the Report:
- Nigeria Activated Carbon for Mercury Control Market Outlook
- Market Size of Nigeria Activated Carbon for Mercury Control Market, 2024
- Forecast of Nigeria Activated Carbon for Mercury Control Market, 2031
- Historical Data and Forecast of Nigeria Activated Carbon for Mercury Control Revenues & Volume for the Period 2021 - 2031
- Nigeria Activated Carbon for Mercury Control Market Trend Evolution
- Nigeria Activated Carbon for Mercury Control Market Drivers and Challenges
- Nigeria Activated Carbon for Mercury Control Price Trends
- Nigeria Activated Carbon for Mercury Control Porter's Five Forces
- Nigeria Activated Carbon for Mercury Control Industry Life Cycle
- Historical Data and Forecast of Nigeria Activated Carbon for Mercury Control Market Revenues & Volume By Application for the Period 2021 - 2031
- Historical Data and Forecast of Nigeria Activated Carbon for Mercury Control Market Revenues & Volume By Coal Burning for the Period 2021 - 2031
- Historical Data and Forecast of Nigeria Activated Carbon for Mercury Control Market Revenues & Volume By Gold Mining for the Period 2021 - 2031
- Historical Data and Forecast of Nigeria Activated Carbon for Mercury Control Market Revenues & Volume By Cement Production for the Period 2021 - 2031
- Historical Data and Forecast of Nigeria Activated Carbon for Mercury Control Market Revenues & Volume By Ferrous & Non-Ferrous Metals for the Period 2021 - 2031
- Historical Data and Forecast of Nigeria Activated Carbon for Mercury Control Market Revenues & Volume By Oil & Gas Burning for the Period 2021 - 2031
- Historical Data and Forecast of Nigeria Activated Carbon for Mercury Control Market Revenues & Volume By Oil Refining for the Period 2021 - 2031
- Historical Data and Forecast of Nigeria Activated Carbon for Mercury Control Market Revenues & Volume By Others for the Period 2021 - 2031
- Nigeria Activated Carbon for Mercury Control Import Export Trade Statistics
- Market Opportunity Assessment By Application
- Nigeria Activated Carbon for Mercury Control Top Companies Market Share
- Nigeria Activated Carbon for Mercury Control Competitive Benchmarking By Technical and Operational Parameters
- Nigeria Activated Carbon for Mercury Control Company Profiles
- Nigeria Activated Carbon for Mercury Control Key Strategic Recommendations
Frequently Asked Questions About the Market Study (FAQs):
6Wresearch actively monitors the Nigeria Activated Carbon for Mercury Control Market and publishes its comprehensive annual report, highlighting emerging trends, growth drivers, revenue analysis, and forecast outlook. Our insights help businesses to make data-backed strategic decisions with ongoing market dynamics. Our analysts track relevent industries related to the Nigeria Activated Carbon for Mercury Control Market, allowing our clients with actionable intelligence and reliable forecasts tailored to emerging regional needs.
Yes, we provide customisation as per your requirements. To learn more, feel free to contact us on sales@6wresearch.com
1 Executive Summary |
2 Introduction |
2.1 Key Highlights of the Report |
2.2 Report Description |
2.3 Market Scope & Segmentation |
2.4 Research Methodology |
2.5 Assumptions |
3 Nigeria Activated Carbon for Mercury Control Market Overview |
3.1 Nigeria Country Macro Economic Indicators |
3.2 Nigeria Activated Carbon for Mercury Control Market Revenues & Volume, 2021 & 2031F |
3.3 Nigeria Activated Carbon for Mercury Control Market - Industry Life Cycle |
3.4 Nigeria Activated Carbon for Mercury Control Market - Porter's Five Forces |
3.5 Nigeria Activated Carbon for Mercury Control Market Revenues & Volume Share, By Application, 2021 & 2031F |
4 Nigeria Activated Carbon for Mercury Control Market Dynamics |
4.1 Impact Analysis |
4.2 Market Drivers |
4.2.1 Stringent environmental regulations in Nigeria promoting the use of activated carbon for mercury control. |
4.2.2 Increasing awareness about the harmful effects of mercury pollution on health and the environment. |
4.2.3 Growth in industrial activities, particularly in sectors such as mining, power generation, and oil gas, leading to higher mercury emissions. |
4.3 Market Restraints |
4.3.1 High initial investment required for setting up activated carbon mercury control systems. |
4.3.2 Limited availability of technical expertise and skilled labor for the installation and maintenance of activated carbon systems in Nigeria. |
5 Nigeria Activated Carbon for Mercury Control Market Trends |
6 Nigeria Activated Carbon for Mercury Control Market, By Types |
6.1 Nigeria Activated Carbon for Mercury Control Market, By Application |
6.1.1 Overview and Analysis |
6.1.2 Nigeria Activated Carbon for Mercury Control Market Revenues & Volume, By Application, 2021 - 2031F |
6.1.3 Nigeria Activated Carbon for Mercury Control Market Revenues & Volume, By Coal Burning, 2021 - 2031F |
6.1.4 Nigeria Activated Carbon for Mercury Control Market Revenues & Volume, By Gold Mining, 2021 - 2031F |
6.1.5 Nigeria Activated Carbon for Mercury Control Market Revenues & Volume, By Cement Production, 2021 - 2031F |
6.1.6 Nigeria Activated Carbon for Mercury Control Market Revenues & Volume, By Ferrous & Non-Ferrous Metals, 2021 - 2031F |
6.1.7 Nigeria Activated Carbon for Mercury Control Market Revenues & Volume, By Oil & Gas Burning, 2021 - 2031F |
6.1.8 Nigeria Activated Carbon for Mercury Control Market Revenues & Volume, By Oil Refining , 2021 - 2031F |
7 Nigeria Activated Carbon for Mercury Control Market Import-Export Trade Statistics |
7.1 Nigeria Activated Carbon for Mercury Control Market Export to Major Countries |
7.2 Nigeria Activated Carbon for Mercury Control Market Imports from Major Countries |
8 Nigeria Activated Carbon for Mercury Control Market Key Performance Indicators |
8.1 Percentage increase in the adoption of activated carbon mercury control systems in key industries. |
8.2 Reduction in mercury emission levels in Nigeria over a specified period. |
8.3 Number of research and development initiatives focused on enhancing the efficiency of activated carbon for mercury control in the Nigerian market. |
9 Nigeria Activated Carbon for Mercury Control Market - Opportunity Assessment |
9.1 Nigeria Activated Carbon for Mercury Control Market Opportunity Assessment, By Application, 2021 & 2031F |
10 Nigeria Activated Carbon for Mercury Control Market - Competitive Landscape |
10.1 Nigeria Activated Carbon for Mercury Control Market Revenue Share, By Companies, 2024 |
10.2 Nigeria Activated Carbon for Mercury Control Market Competitive Benchmarking, By Operating and Technical Parameters |
11 Company Profiles |
12 Recommendations |
13 Disclaimer |
Global Go To Market Strategy - 2030
Export potential enables firms to identify high-growth global markets with greater confidence by combining advanced trade intelligence with a structured quantitative methodology. The framework analyzes emerging demand trends and country-level import patterns while integrating macroeconomic and trade datasets such as GDP and population forecasts, bilateral import–export flows, tariff structures, elasticity differentials between developed and developing economies, geographic distance, and import demand projections. Using weighted trade values from 2020–2024 as the base period to project country-to-country export potential for 2030, these inputs are operationalized through calculated drivers such as gravity model parameters, tariff impact factors, and projected GDP per-capita growth. Through an analysis of hidden potentials, demand hotspots, and market conditions that are most favorable to success, this method enables firms to focus on target countries, maximize returns, and global expansion with data, backed by accuracy.
By factoring in the projected importer demand gap that is currently unmet and could be potential opportunity, it identifies the potential for the Exporter (Country) among 190 countries, against the general trade analysis, which identifies the biggest importer or exporter.
To discover high-growth global markets and optimize your business strategy:
Click Here
Pricing
- Single User License$ 1,995
- Department License$ 2,400
- Site License$ 3,120
- Global License$ 3,795

Leadership Perspectives from Industry Events
Search
Thought Leadership and Analyst Meet


Our Clients
6WResearch In News
- India Export Attractiveness Tracker 2026
- India Air Conditioner Market Set for Strong Rebound in 2026 After Weather-Led Correction and GST-Driven Recovery: 6Wresearch
- ADAS in India: How Automatic Emergency Braking, Blind Spot Detection & Driver Monitoring are Transforming Road Safety
- Doha a strategic location for EV manufacturing hub: IPA Qatar
- Demand for luxury TVs surging in the GCC, says Samsung
- Empowering Growth: The Thriving Journey of Bangladesh’s Cable Industry
Latest Reports
- Nicaragua RPG Gaming Market (2026-2032)
- New Zealand RPG Gaming Market (2026-2032)
- Netherlands RPG Gaming Market (2026-2032)
- Nauru RPG Gaming Market (2026-2032)
- Namibia RPG Gaming Market (2026-2032)
- Mozambique RPG Gaming Market (2026-2032)
- Montenegro RPG Gaming Market (2026-2032)
- Mongolia RPG Gaming Market (2026-2032)
- Monaco RPG Gaming Market (2026-2032)
- Micronesia RPG Gaming Market (2026-2032)
Industry Events and Analyst Meet

EV India Expo 2026

HIMTEX 2026

India Refining Summit 2026

India EV Show 2026

EV tech India Expo 2026
Whitepaper
- Middle East & Africa Commercial Security Market Click here to view more.
- Middle East & Africa Fire Safety Systems & Equipment Market Click here to view more.
- GCC Drone Market Click here to view more.
- Middle East Lighting Fixture Market Click here to view more.
- GCC Physical & Perimeter Security Market Click here to view more.