Norway Calcined Petroleum Coke Market (2025-2031) | Segmentation, Growth, Revenue, Share, Companies, Size, Forecast, Trends, Analysis, Value, Outlook & Industry
Market Forecast By Type (Anode Grade, Needle Grade, ), By End-user (Carburizing & Recarburizing, Electric Arc & Induction Furnaces, Others) And Competitive Landscape
| Product Code: ETC5252518 | Publication Date: Nov 2023 | Updated Date: Nov 2025 | Product Type: Market Research Report | |
| Publisher: 6Wresearch | Author: Bhawna Singh | No. of Pages: 60 | No. of Figures: 30 | No. of Tables: 5 |
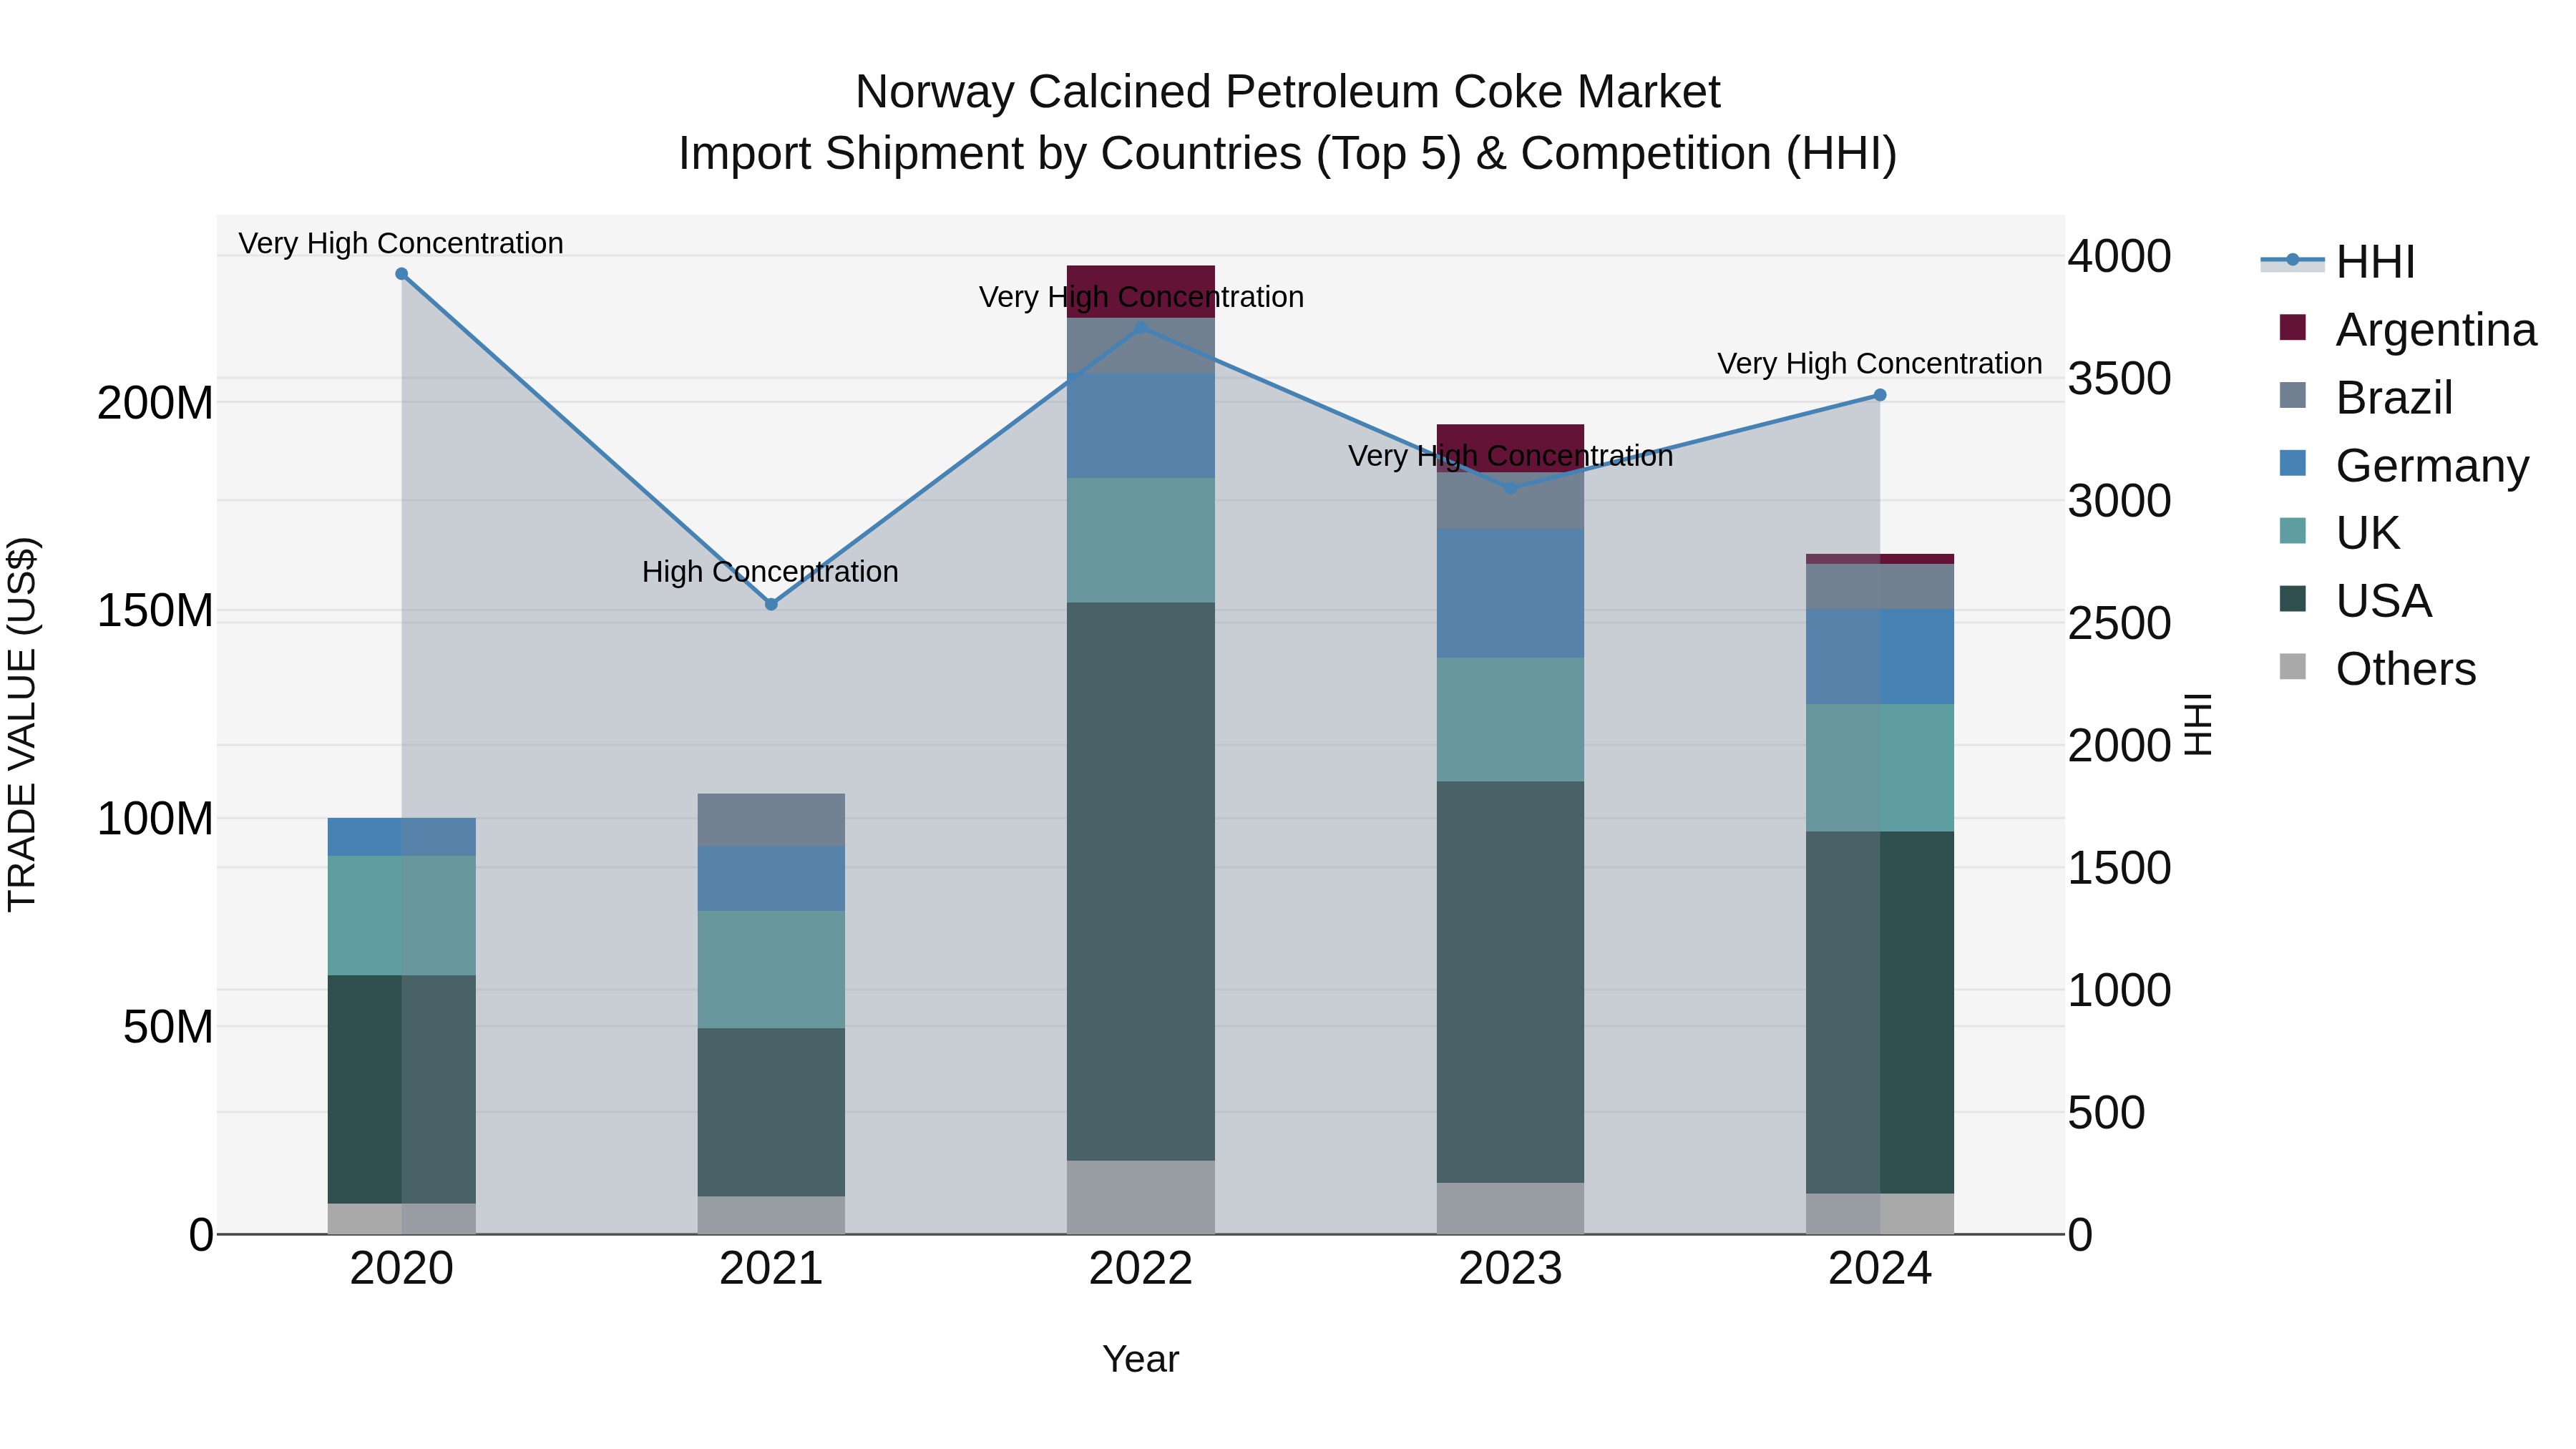
Norway Calcined Petroleum Coke Market Top 5 Importing Countries and Market Competition (HHI) Analysis
Norway`s calcined petroleum coke import market saw significant growth with a CAGR of 13.05% from 2020 to 2024, despite a slight decline in growth rate from 2023 to 2024 at -15.98%. The top exporting countries to Norway in 2024 were the USA, UK, Germany, Brazil, and Poland, indicating a diverse import source base. However, the market remained highly concentrated with a high Herfindahl-Hirschman Index (HHI) in 2024, suggesting potential market dominance by key players.
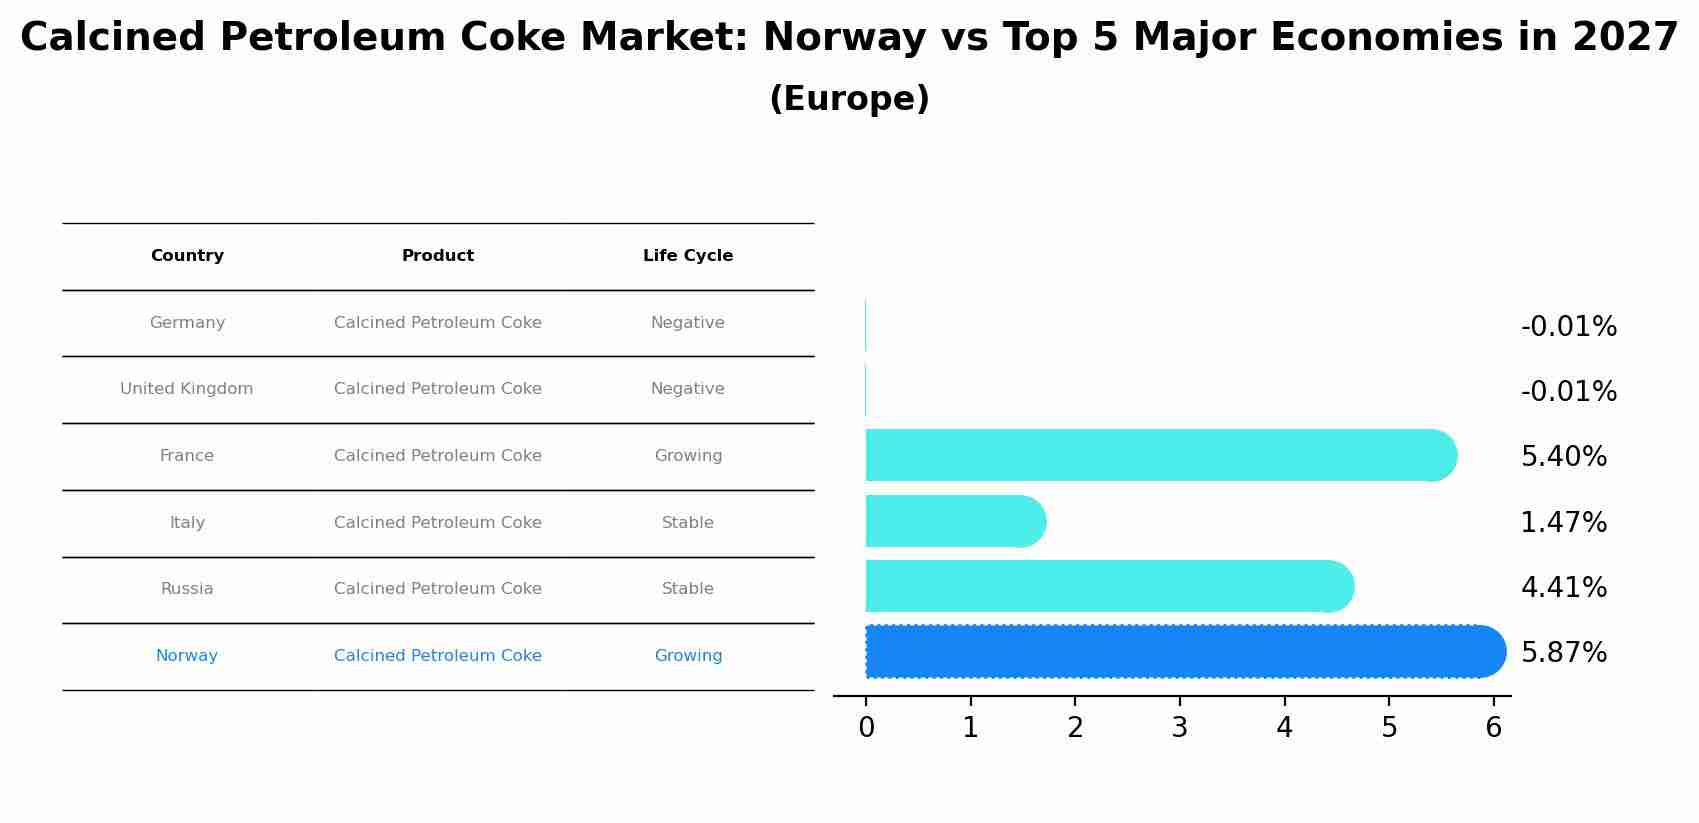
Calcined Petroleum Coke Market: Norway vs Top 5 Major Economies in 2027 (Europe)
Norway's Calcined Petroleum Coke market is anticipated to experience a growing growth rate of 5.87% by 2027, reflecting trends observed in the largest economy Germany, followed by United Kingdom, France, Italy and Russia.
Norway Calcined Petroleum Coke Market Overview
The calcined petroleum coke market in Norway is growing due to its use as a key raw material in the production of aluminum, steel, and other industrial products. Calcined petroleum coke is produced by heating petroleum coke to high temperatures, enhancing its properties for use in industrial processes. The market is influenced by demand from the aluminum and steel industries, fluctuations in petroleum coke prices, and advancements in production technology.
Drivers of the market
The Calcined Petroleum Coke Market in Norway is driven by its use in aluminum smelting and steel manufacturing. The growing demand for calcined coke as a key component in industrial processes, particularly in the metallurgical industry, supports market expansion.
Challenges of the market
Challenges in the Norway Calcined Petroleum Coke Market include the high cost of production and fluctuations in global oil prices. The market is influenced by demand from the aluminum and steel industries, but competition from alternative materials and the need for compliance with environmental regulations add to market complexity.
Government Policy of the market
Norwegian environmental policies related to carbon emissions and industrial waste management influence the calcined petroleum coke market. The government promotes sustainable practices in the refining and use of petroleum products, which impacts demand and regulatory compliance in this sector.
Key Highlights of the Report:
- Norway Calcined Petroleum Coke Market Outlook
- Market Size of Norway Calcined Petroleum Coke Market, 2024
- Forecast of Norway Calcined Petroleum Coke Market, 2031
- Historical Data and Forecast of Norway Calcined Petroleum Coke Revenues & Volume for the Period 2021-2031
- Norway Calcined Petroleum Coke Market Trend Evolution
- Norway Calcined Petroleum Coke Market Drivers and Challenges
- Norway Calcined Petroleum Coke Price Trends
- Norway Calcined Petroleum Coke Porter`s Five Forces
- Norway Calcined Petroleum Coke Industry Life Cycle
- Historical Data and Forecast of Norway Calcined Petroleum Coke Market Revenues & Volume By Type for the Period 2021-2031
- Historical Data and Forecast of Norway Calcined Petroleum Coke Market Revenues & Volume By Anode Grade for the Period 2021-2031
- Historical Data and Forecast of Norway Calcined Petroleum Coke Market Revenues & Volume By Needle Grade for the Period 2021-2031
- Historical Data and Forecast of Norway Calcined Petroleum Coke Market Revenues & Volume By for the Period 2021-2031
- Historical Data and Forecast of Norway Calcined Petroleum Coke Market Revenues & Volume By End-user for the Period 2021-2031
- Historical Data and Forecast of Norway Calcined Petroleum Coke Market Revenues & Volume By Carburizing & Recarburizing for the Period 2021-2031
- Historical Data and Forecast of Norway Calcined Petroleum Coke Market Revenues & Volume By Electric Arc & Induction Furnaces for the Period 2021-2031
- Historical Data and Forecast of Norway Calcined Petroleum Coke Market Revenues & Volume By Others for the Period 2021-2031
- Norway Calcined Petroleum Coke Import Export Trade Statistics
- Market Opportunity Assessment By Type
- Market Opportunity Assessment By End-user
- Norway Calcined Petroleum Coke Top Companies Market Share
- Norway Calcined Petroleum Coke Competitive Benchmarking By Technical and Operational Parameters
- Norway Calcined Petroleum Coke Company Profiles
- Norway Calcined Petroleum Coke Key Strategic Recommendations
Frequently Asked Questions About the Market Study (FAQs):
6Wresearch actively monitors the Norway Calcined Petroleum Coke Market and publishes its comprehensive annual report, highlighting emerging trends, growth drivers, revenue analysis, and forecast outlook. Our insights help businesses to make data-backed strategic decisions with ongoing market dynamics. Our analysts track relevent industries related to the Norway Calcined Petroleum Coke Market, allowing our clients with actionable intelligence and reliable forecasts tailored to emerging regional needs.
Yes, we provide customisation as per your requirements. To learn more, feel free to contact us on sales@6wresearch.com
1 Executive Summary |
2 Introduction |
2.1 Key Highlights of the Report |
2.2 Report Description |
2.3 Market Scope & Segmentation |
2.4 Research Methodology |
2.5 Assumptions |
3 Norway Calcined Petroleum Coke Market Overview |
3.1 Norway Country Macro Economic Indicators |
3.2 Norway Calcined Petroleum Coke Market Revenues & Volume, 2021 & 2031F |
3.3 Norway Calcined Petroleum Coke Market - Industry Life Cycle |
3.4 Norway Calcined Petroleum Coke Market - Porter's Five Forces |
3.5 Norway Calcined Petroleum Coke Market Revenues & Volume Share, By Type , 2021 & 2031F |
3.6 Norway Calcined Petroleum Coke Market Revenues & Volume Share, By End-user , 2021 & 2031F |
4 Norway Calcined Petroleum Coke Market Dynamics |
4.1 Impact Analysis |
4.2 Market Drivers |
4.2.1 Increasing demand for steel production in Norway |
4.2.2 Growing usage of calcined petroleum coke as a key raw material in various industries |
4.2.3 Favorable government regulations supporting the use of calcined petroleum coke in manufacturing processes |
4.3 Market Restraints |
4.3.1 Fluctuating prices of raw materials impacting the production cost of calcined petroleum coke |
4.3.2 Environmental concerns and regulations regarding the emission of greenhouse gases during the production of calcined petroleum coke |
5 Norway Calcined Petroleum Coke Market Trends |
6 Norway Calcined Petroleum Coke Market Segmentations |
6.1 Norway Calcined Petroleum Coke Market, By Type |
6.1.1 Overview and Analysis |
6.1.2 Norway Calcined Petroleum Coke Market Revenues & Volume, By Anode Grade, 2021-2031F |
6.1.3 Norway Calcined Petroleum Coke Market Revenues & Volume, By Needle Grade, 2021-2031F |
6.1.4 Norway Calcined Petroleum Coke Market Revenues & Volume, By , 2021-2031F |
6.2 Norway Calcined Petroleum Coke Market, By End-user |
6.2.1 Overview and Analysis |
6.2.2 Norway Calcined Petroleum Coke Market Revenues & Volume, By Carburizing & Recarburizing, 2021-2031F |
6.2.3 Norway Calcined Petroleum Coke Market Revenues & Volume, By Electric Arc & Induction Furnaces, 2021-2031F |
6.2.4 Norway Calcined Petroleum Coke Market Revenues & Volume, By Others, 2021-2031F |
7 Norway Calcined Petroleum Coke Market Import-Export Trade Statistics |
7.1 Norway Calcined Petroleum Coke Market Export to Major Countries |
7.2 Norway Calcined Petroleum Coke Market Imports from Major Countries |
8 Norway Calcined Petroleum Coke Market Key Performance Indicators |
8.1 Average selling price of calcined petroleum coke |
8.2 Utilization rate of calcined petroleum coke in steel production |
8.3 Number of new applications or industries adopting calcined petroleum coke as a raw material |
8.4 Carbon footprint reduction achieved through the use of calcined petroleum coke |
8.5 Research and development investments in enhancing the quality and efficiency of calcined petroleum coke production |
9 Norway Calcined Petroleum Coke Market - Opportunity Assessment |
9.1 Norway Calcined Petroleum Coke Market Opportunity Assessment, By Type , 2021 & 2031F |
9.2 Norway Calcined Petroleum Coke Market Opportunity Assessment, By End-user , 2021 & 2031F |
10 Norway Calcined Petroleum Coke Market - Competitive Landscape |
10.1 Norway Calcined Petroleum Coke Market Revenue Share, By Companies, 2024 |
10.2 Norway Calcined Petroleum Coke Market Competitive Benchmarking, By Operating and Technical Parameters |
11 Company Profiles |
12 Recommendations | 13 Disclaimer |
Global Go To Market Strategy - 2030
Export potential enables firms to identify high-growth global markets with greater confidence by combining advanced trade intelligence with a structured quantitative methodology. The framework analyzes emerging demand trends and country-level import patterns while integrating macroeconomic and trade datasets such as GDP and population forecasts, bilateral import–export flows, tariff structures, elasticity differentials between developed and developing economies, geographic distance, and import demand projections. Using weighted trade values from 2020–2024 as the base period to project country-to-country export potential for 2030, these inputs are operationalized through calculated drivers such as gravity model parameters, tariff impact factors, and projected GDP per-capita growth. Through an analysis of hidden potentials, demand hotspots, and market conditions that are most favorable to success, this method enables firms to focus on target countries, maximize returns, and global expansion with data, backed by accuracy.
By factoring in the projected importer demand gap that is currently unmet and could be potential opportunity, it identifies the potential for the Exporter (Country) among 190 countries, against the general trade analysis, which identifies the biggest importer or exporter.
To discover high-growth global markets and optimize your business strategy:
Click Here
Pricing
- Single User License$ 1,995
- Department License$ 2,400
- Site License$ 3,120
- Global License$ 3,795

Leadership Perspectives from Industry Events
Search
Thought Leadership and Analyst Meet


Our Clients
6WResearch In News
- India Air Conditioner Market Set for Strong Rebound in 2026 After Weather-Led Correction and GST-Driven Recovery: 6Wresearch
- ADAS in India: How Automatic Emergency Braking, Blind Spot Detection & Driver Monitoring are Transforming Road Safety
- Doha a strategic location for EV manufacturing hub: IPA Qatar
- Demand for luxury TVs surging in the GCC, says Samsung
- Empowering Growth: The Thriving Journey of Bangladesh’s Cable Industry
- Demand for luxury TVs surging in the GCC, says Samsung
Latest Reports
- Nicaragua RPG Gaming Market (2026-2032)
- New Zealand RPG Gaming Market (2026-2032)
- Netherlands RPG Gaming Market (2026-2032)
- Nauru RPG Gaming Market (2026-2032)
- Namibia RPG Gaming Market (2026-2032)
- Mozambique RPG Gaming Market (2026-2032)
- Montenegro RPG Gaming Market (2026-2032)
- Mongolia RPG Gaming Market (2026-2032)
- Monaco RPG Gaming Market (2026-2032)
- Micronesia RPG Gaming Market (2026-2032)
Industry Events and Analyst Meet

HIMTEX 2026

India Refining Summit 2026

India EV Show 2026

EV tech India Expo 2026

Auto Tech Asia 2026
Whitepaper
- Middle East & Africa Commercial Security Market Click here to view more.
- Middle East & Africa Fire Safety Systems & Equipment Market Click here to view more.
- GCC Drone Market Click here to view more.
- Middle East Lighting Fixture Market Click here to view more.
- GCC Physical & Perimeter Security Market Click here to view more.