Norway Colorants Market (2025-2031) | Revenue, Industry, Analysis, Growth, Size, Forecast, Share, Trends, Companies, Segmentation, Outlook & Value
Market Forecast By Type (Dyes, Pigments, Masterbatches, Color Concentrates), By End Use Industry (Packaging, Building & Construction, Automotive, Textiles, Paper & Printing) And Competitive Landscape
| Product Code: ETC5654824 | Publication Date: Nov 2023 | Updated Date: Nov 2025 | Product Type: Market Research Report | |
| Publisher: 6Wresearch | Author: Sumit Sagar | No. of Pages: 60 | No. of Figures: 30 | No. of Tables: 5 |
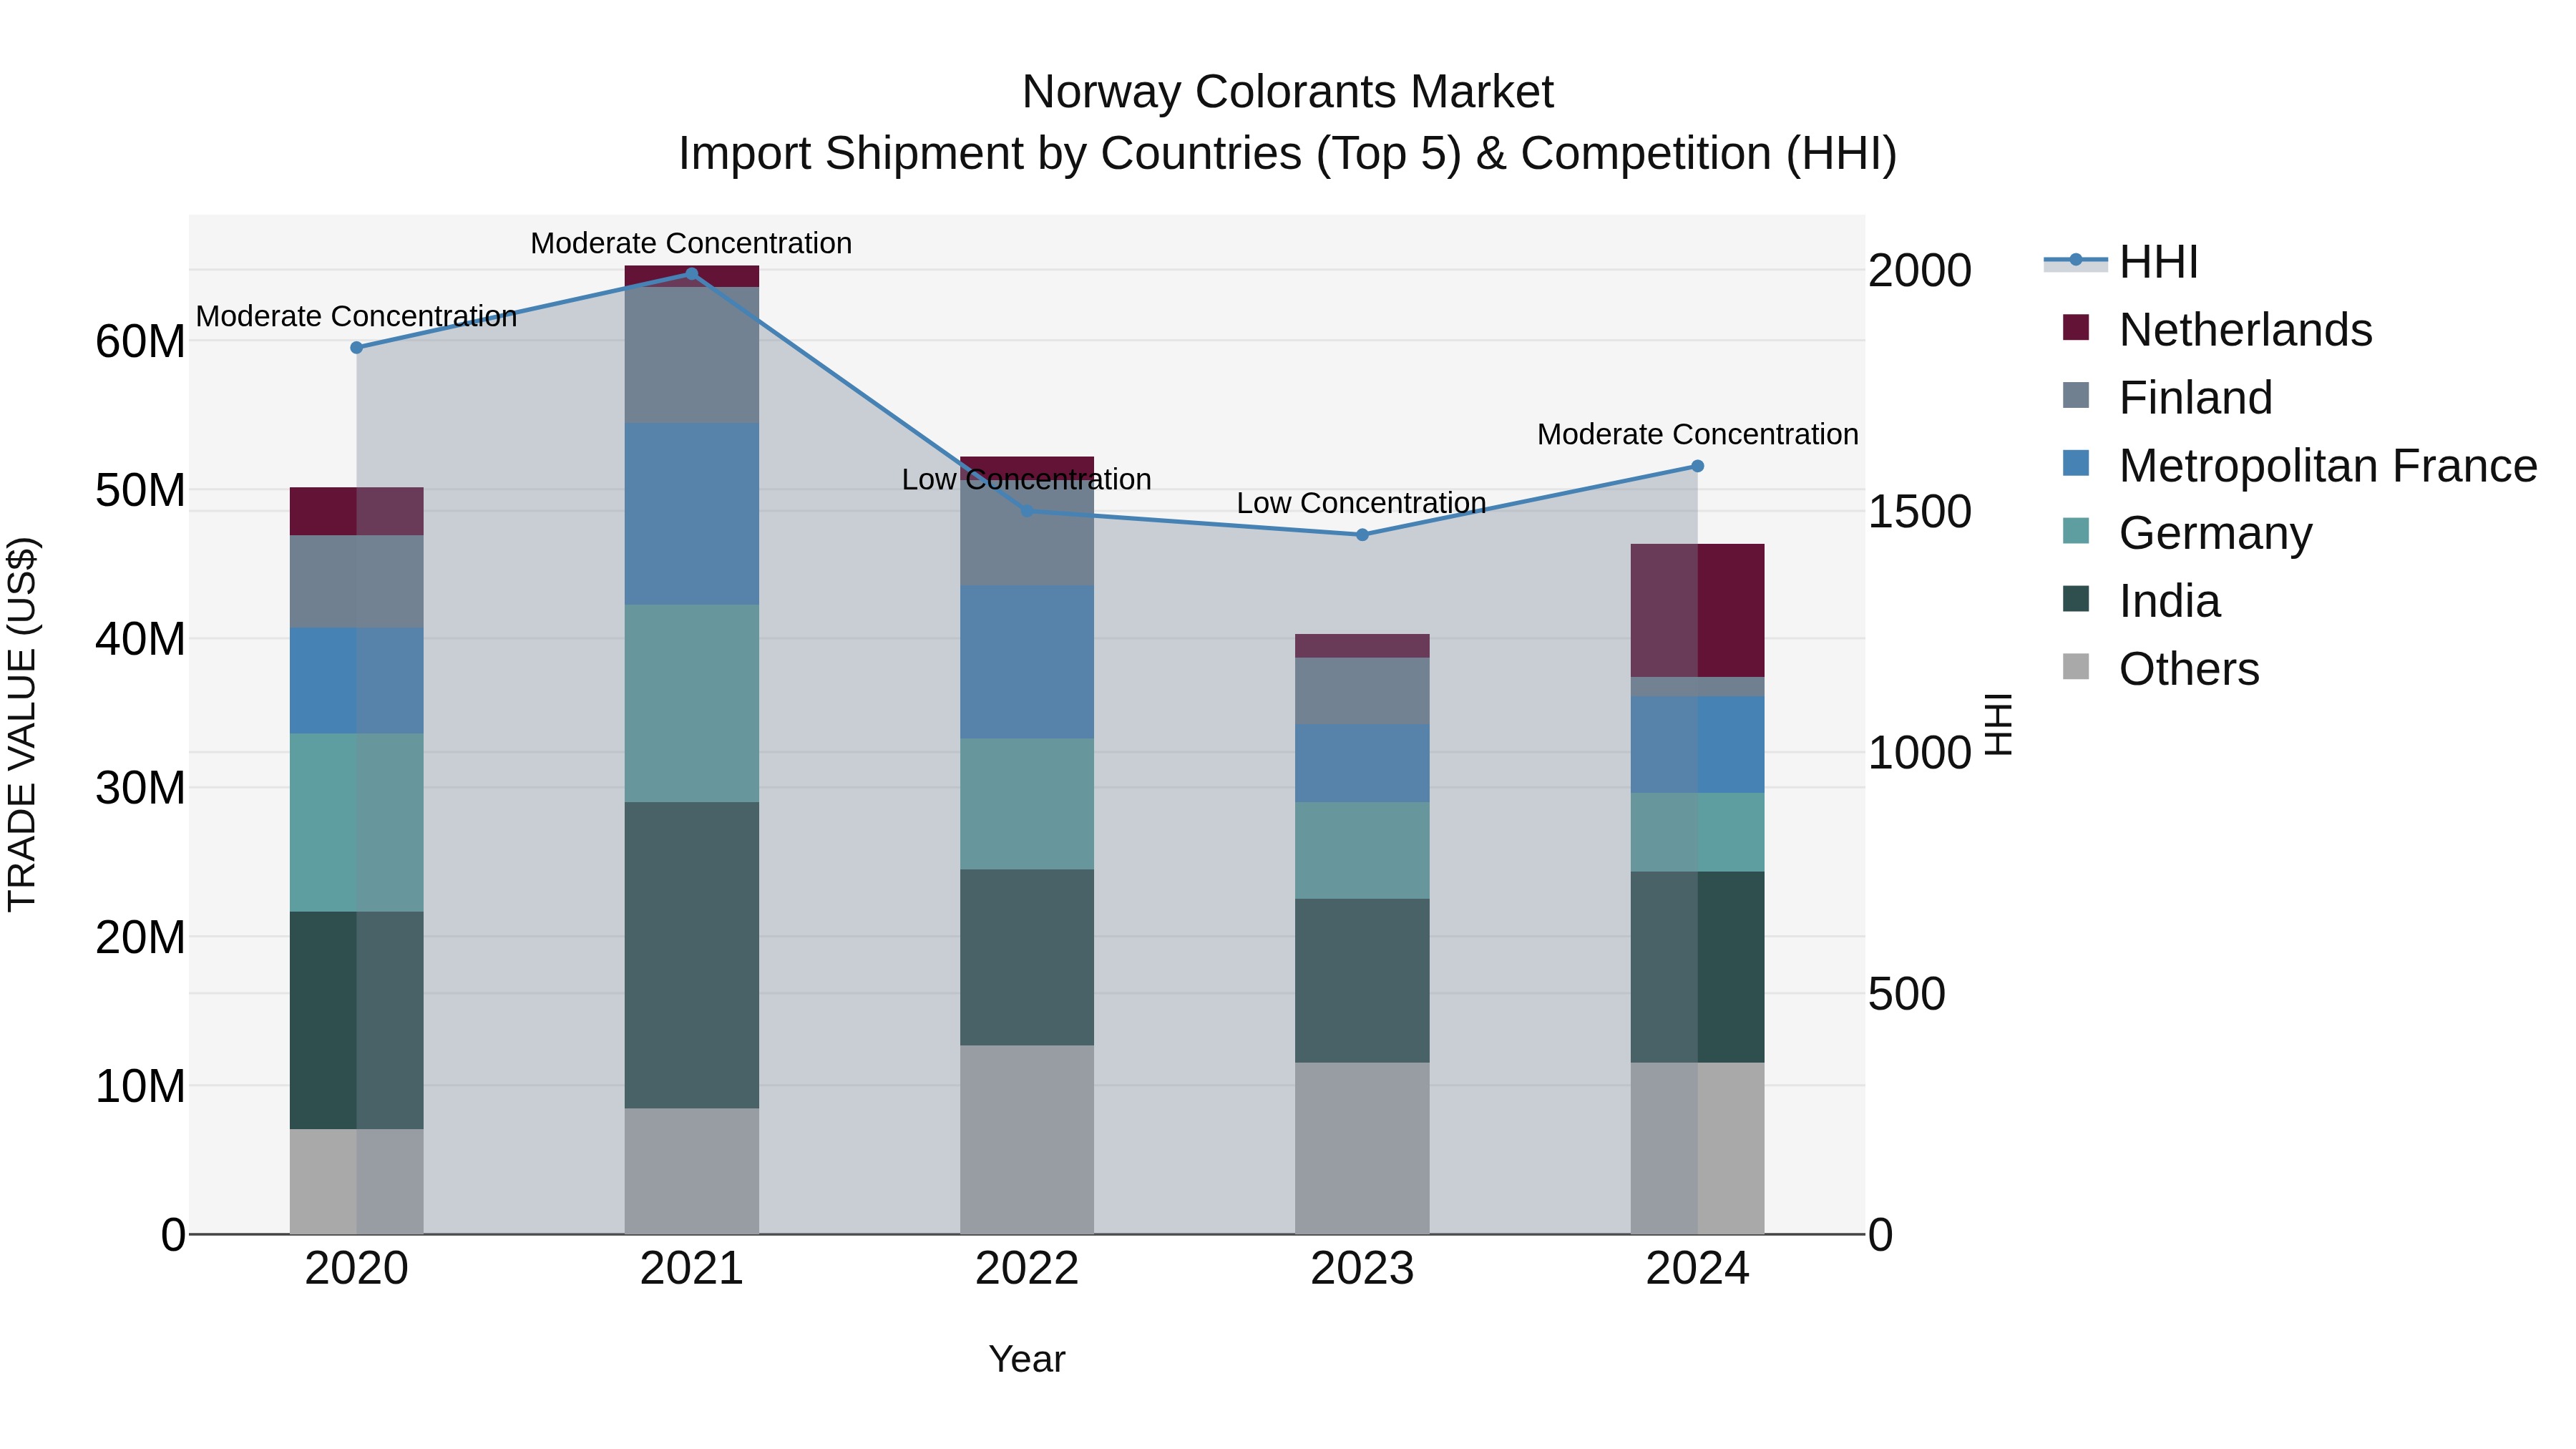
Norway Colorants Market Top 5 Importing Countries and Market Competition (HHI) Analysis
Norway`s colorants import market saw a shift in concentration levels from low to moderate in 2024, indicating increased competition among suppliers. The top exporting countries to Norway in 2024 were India, Netherlands, Metropolitan France, Germany, and China. Despite a negative CAGR of -1.95% from 2020 to 2024, the market experienced a notable growth rate of 15.07% from 2023 to 2024. This growth suggests potential opportunities for both existing and new players in the colorants import industry to capitalize on the evolving market dynamics in Norway.
Norway Colorants Market Overview
The colorants market in Norway is diverse, encompassing dyes, pigments, and other coloring agents used in industries such as textiles, plastics, and cosmetics. The market is influenced by the demand for eco-friendly and non-toxic colorants, particularly as consumers and industries shift toward more sustainable practices.
Drivers of the market
The Norway Colorants Market sees growth due to the increasing demand in sectors like textiles, plastics, and food. The focus on environmentally friendly and sustainable colorants drives innovation in this market.
Challenges of the market
The colorants market in Norway faces challenges due to the growing demand for environmentally friendly and non-toxic products, which increases production costs. Furthermore, the market is highly competitive, with manufacturers needing to differentiate their products in order to maintain a competitive edge.
Government Policy of the market
The Colorants market in Norway is shaped by government policies that promote product safety and environmental responsibility. Regulations ensure that colorants meet stringent safety standards and do not pose risks to health or the environment. The government supports research into safer and more sustainable colorant technologies and provides incentives for businesses adopting eco-friendly colorant solutions.
Key Highlights of the Report:
- Norway Colorants Market Outlook
- Market Size of Norway Colorants Market, 2024
- Forecast of Norway Colorants Market, 2031
- Historical Data and Forecast of Norway Colorants Revenues & Volume for the Period 2021-2031
- Norway Colorants Market Trend Evolution
- Norway Colorants Market Drivers and Challenges
- Norway Colorants Price Trends
- Norway Colorants Porter`s Five Forces
- Norway Colorants Industry Life Cycle
- Historical Data and Forecast of Norway Colorants Market Revenues & Volume By Type for the Period 2021-2031
- Historical Data and Forecast of Norway Colorants Market Revenues & Volume By Dyes for the Period 2021-2031
- Historical Data and Forecast of Norway Colorants Market Revenues & Volume By Pigments for the Period 2021-2031
- Historical Data and Forecast of Norway Colorants Market Revenues & Volume By Masterbatches for the Period 2021-2031
- Historical Data and Forecast of Norway Colorants Market Revenues & Volume By Color Concentrates for the Period 2021-2031
- Historical Data and Forecast of Norway Colorants Market Revenues & Volume By End Use Industry for the Period 2021-2031
- Historical Data and Forecast of Norway Colorants Market Revenues & Volume By Packaging for the Period 2021-2031
- Historical Data and Forecast of Norway Colorants Market Revenues & Volume By Building & Construction for the Period 2021-2031
- Historical Data and Forecast of Norway Colorants Market Revenues & Volume By Automotive for the Period 2021-2031
- Historical Data and Forecast of Norway Colorants Market Revenues & Volume By Textiles for the Period 2021-2031
- Historical Data and Forecast of Norway Colorants Market Revenues & Volume By Paper & Printing for the Period 2021-2031
- Norway Colorants Import Export Trade Statistics
- Market Opportunity Assessment By Type
- Market Opportunity Assessment By End Use Industry
- Norway Colorants Top Companies Market Share
- Norway Colorants Competitive Benchmarking By Technical and Operational Parameters
- Norway Colorants Company Profiles
- Norway Colorants Key Strategic Recommendations
Frequently Asked Questions About the Market Study (FAQs):
6Wresearch actively monitors the Norway Colorants Market and publishes its comprehensive annual report, highlighting emerging trends, growth drivers, revenue analysis, and forecast outlook. Our insights help businesses to make data-backed strategic decisions with ongoing market dynamics. Our analysts track relevent industries related to the Norway Colorants Market, allowing our clients with actionable intelligence and reliable forecasts tailored to emerging regional needs.
Yes, we provide customisation as per your requirements. To learn more, feel free to contact us on sales@6wresearch.com
1 Executive Summary |
2 Introduction |
2.1 Key Highlights of the Report |
2.2 Report Description |
2.3 Market Scope & Segmentation |
2.4 Research Methodology |
2.5 Assumptions |
3 Norway Colorants Market Overview |
3.1 Norway Country Macro Economic Indicators |
3.2 Norway Colorants Market Revenues & Volume, 2021 & 2031F |
3.3 Norway Colorants Market - Industry Life Cycle |
3.4 Norway Colorants Market - Porter's Five Forces |
3.5 Norway Colorants Market Revenues & Volume Share, By Type, 2021 & 2031F |
3.6 Norway Colorants Market Revenues & Volume Share, By End Use Industry, 2021 & 2031F |
4 Norway Colorants Market Dynamics |
4.1 Impact Analysis |
4.2 Market Drivers |
4.2.1 Increasing demand for eco-friendly and sustainable colorants |
4.2.2 Growing awareness about the harmful effects of synthetic colorants on health |
4.2.3 Rising adoption of natural and organic products in various industries |
4.3 Market Restraints |
4.3.1 Stringent regulations and policies related to the use of colorants in food and cosmetics |
4.3.2 Fluctuating prices of raw materials impacting the cost of colorants production |
5 Norway Colorants Market Trends |
6 Norway Colorants Market Segmentations |
6.1 Norway Colorants Market, By Type |
6.1.1 Overview and Analysis |
6.1.2 Norway Colorants Market Revenues & Volume, By Dyes, 2021-2031F |
6.1.3 Norway Colorants Market Revenues & Volume, By Pigments, 2021-2031F |
6.1.4 Norway Colorants Market Revenues & Volume, By Masterbatches, 2021-2031F |
6.1.5 Norway Colorants Market Revenues & Volume, By Color Concentrates, 2021-2031F |
6.2 Norway Colorants Market, By End Use Industry |
6.2.1 Overview and Analysis |
6.2.2 Norway Colorants Market Revenues & Volume, By Packaging, 2021-2031F |
6.2.3 Norway Colorants Market Revenues & Volume, By Building & Construction, 2021-2031F |
6.2.4 Norway Colorants Market Revenues & Volume, By Automotive, 2021-2031F |
6.2.5 Norway Colorants Market Revenues & Volume, By Textiles, 2021-2031F |
6.2.6 Norway Colorants Market Revenues & Volume, By Paper & Printing, 2021-2031F |
7 Norway Colorants Market Import-Export Trade Statistics |
7.1 Norway Colorants Market Export to Major Countries |
7.2 Norway Colorants Market Imports from Major Countries |
8 Norway Colorants Market Key Performance Indicators |
8.1 Percentage of market share held by eco-friendly colorants |
8.2 Number of new product launches using natural colorants |
8.3 Growth in demand for organic colorants in key industries |
8.4 Adoption rate of natural colorants in food and beverage sector |
8.5 Number of research studies highlighting the benefits of natural colorants |
9 Norway Colorants Market - Opportunity Assessment |
9.1 Norway Colorants Market Opportunity Assessment, By Type, 2021 & 2031F |
9.2 Norway Colorants Market Opportunity Assessment, By End Use Industry, 2021 & 2031F |
10 Norway Colorants Market - Competitive Landscape |
10.1 Norway Colorants Market Revenue Share, By Companies, 2024 |
10.2 Norway Colorants Market Competitive Benchmarking, By Operating and Technical Parameters |
11 Company Profiles |
12 Recommendations | 13 Disclaimer |
Global Go To Market Strategy - 2030
Export potential enables firms to identify high-growth global markets with greater confidence by combining advanced trade intelligence with a structured quantitative methodology. The framework analyzes emerging demand trends and country-level import patterns while integrating macroeconomic and trade datasets such as GDP and population forecasts, bilateral import–export flows, tariff structures, elasticity differentials between developed and developing economies, geographic distance, and import demand projections. Using weighted trade values from 2020–2024 as the base period to project country-to-country export potential for 2030, these inputs are operationalized through calculated drivers such as gravity model parameters, tariff impact factors, and projected GDP per-capita growth. Through an analysis of hidden potentials, demand hotspots, and market conditions that are most favorable to success, this method enables firms to focus on target countries, maximize returns, and global expansion with data, backed by accuracy.
By factoring in the projected importer demand gap that is currently unmet and could be potential opportunity, it identifies the potential for the Exporter (Country) among 190 countries, against the general trade analysis, which identifies the biggest importer or exporter.
To discover high-growth global markets and optimize your business strategy:
Click Here
Pricing
- Single User License$ 1,995
- Department License$ 2,400
- Site License$ 3,120
- Global License$ 3,795

Leadership Perspectives from Industry Events
Search
Thought Leadership and Analyst Meet


Our Clients
6WResearch In News
- India Export Attractiveness Tracker 2026
- India Air Conditioner Market Set for Strong Rebound in 2026 After Weather-Led Correction and GST-Driven Recovery: 6Wresearch
- ADAS in India: How Automatic Emergency Braking, Blind Spot Detection & Driver Monitoring are Transforming Road Safety
- Doha a strategic location for EV manufacturing hub: IPA Qatar
- Demand for luxury TVs surging in the GCC, says Samsung
- Empowering Growth: The Thriving Journey of Bangladesh’s Cable Industry
Latest Reports
- Nicaragua RPG Gaming Market (2026-2032)
- New Zealand RPG Gaming Market (2026-2032)
- Netherlands RPG Gaming Market (2026-2032)
- Nauru RPG Gaming Market (2026-2032)
- Namibia RPG Gaming Market (2026-2032)
- Mozambique RPG Gaming Market (2026-2032)
- Montenegro RPG Gaming Market (2026-2032)
- Mongolia RPG Gaming Market (2026-2032)
- Monaco RPG Gaming Market (2026-2032)
- Micronesia RPG Gaming Market (2026-2032)
Industry Events and Analyst Meet

EV India Expo 2026

HIMTEX 2026

India Refining Summit 2026

India EV Show 2026

EV tech India Expo 2026
Whitepaper
- Middle East & Africa Commercial Security Market Click here to view more.
- Middle East & Africa Fire Safety Systems & Equipment Market Click here to view more.
- GCC Drone Market Click here to view more.
- Middle East Lighting Fixture Market Click here to view more.
- GCC Physical & Perimeter Security Market Click here to view more.