Norway Micronutrients Market (2026-2032) | Outlook, Competitive Landscape, Segmentation, Share, Size & Revenue, Value, Trends, Analysis, Companies, Industry, Forecast, Growth
Market Forecast By Form (Chelated, Non-Chelated), By Product (Boron, Copper, Iron, Manganese, Molybdenum, Zinc, Others), By Crop (Cereals, Pulses and Oil Seeds, Fruits and Vegetables, Others), By Application (Fertigation, Foilar, Soil, Seed Treatment, Hydroponics, Others), By End-Use (Agriculture, Pharmaceutical, Cosmetics and Personal Care, Food and Beverages, Others) And Competitive Landscape
| Product Code: ETC8672627 | Publication Date: Sep 2024 | Updated Date: Apr 2026 | Product Type: Market Research Report | |
| Publisher: 6Wresearch | Author: Summon Dutta | No. of Pages: 75 | No. of Figures: 35 | No. of Tables: 20 |
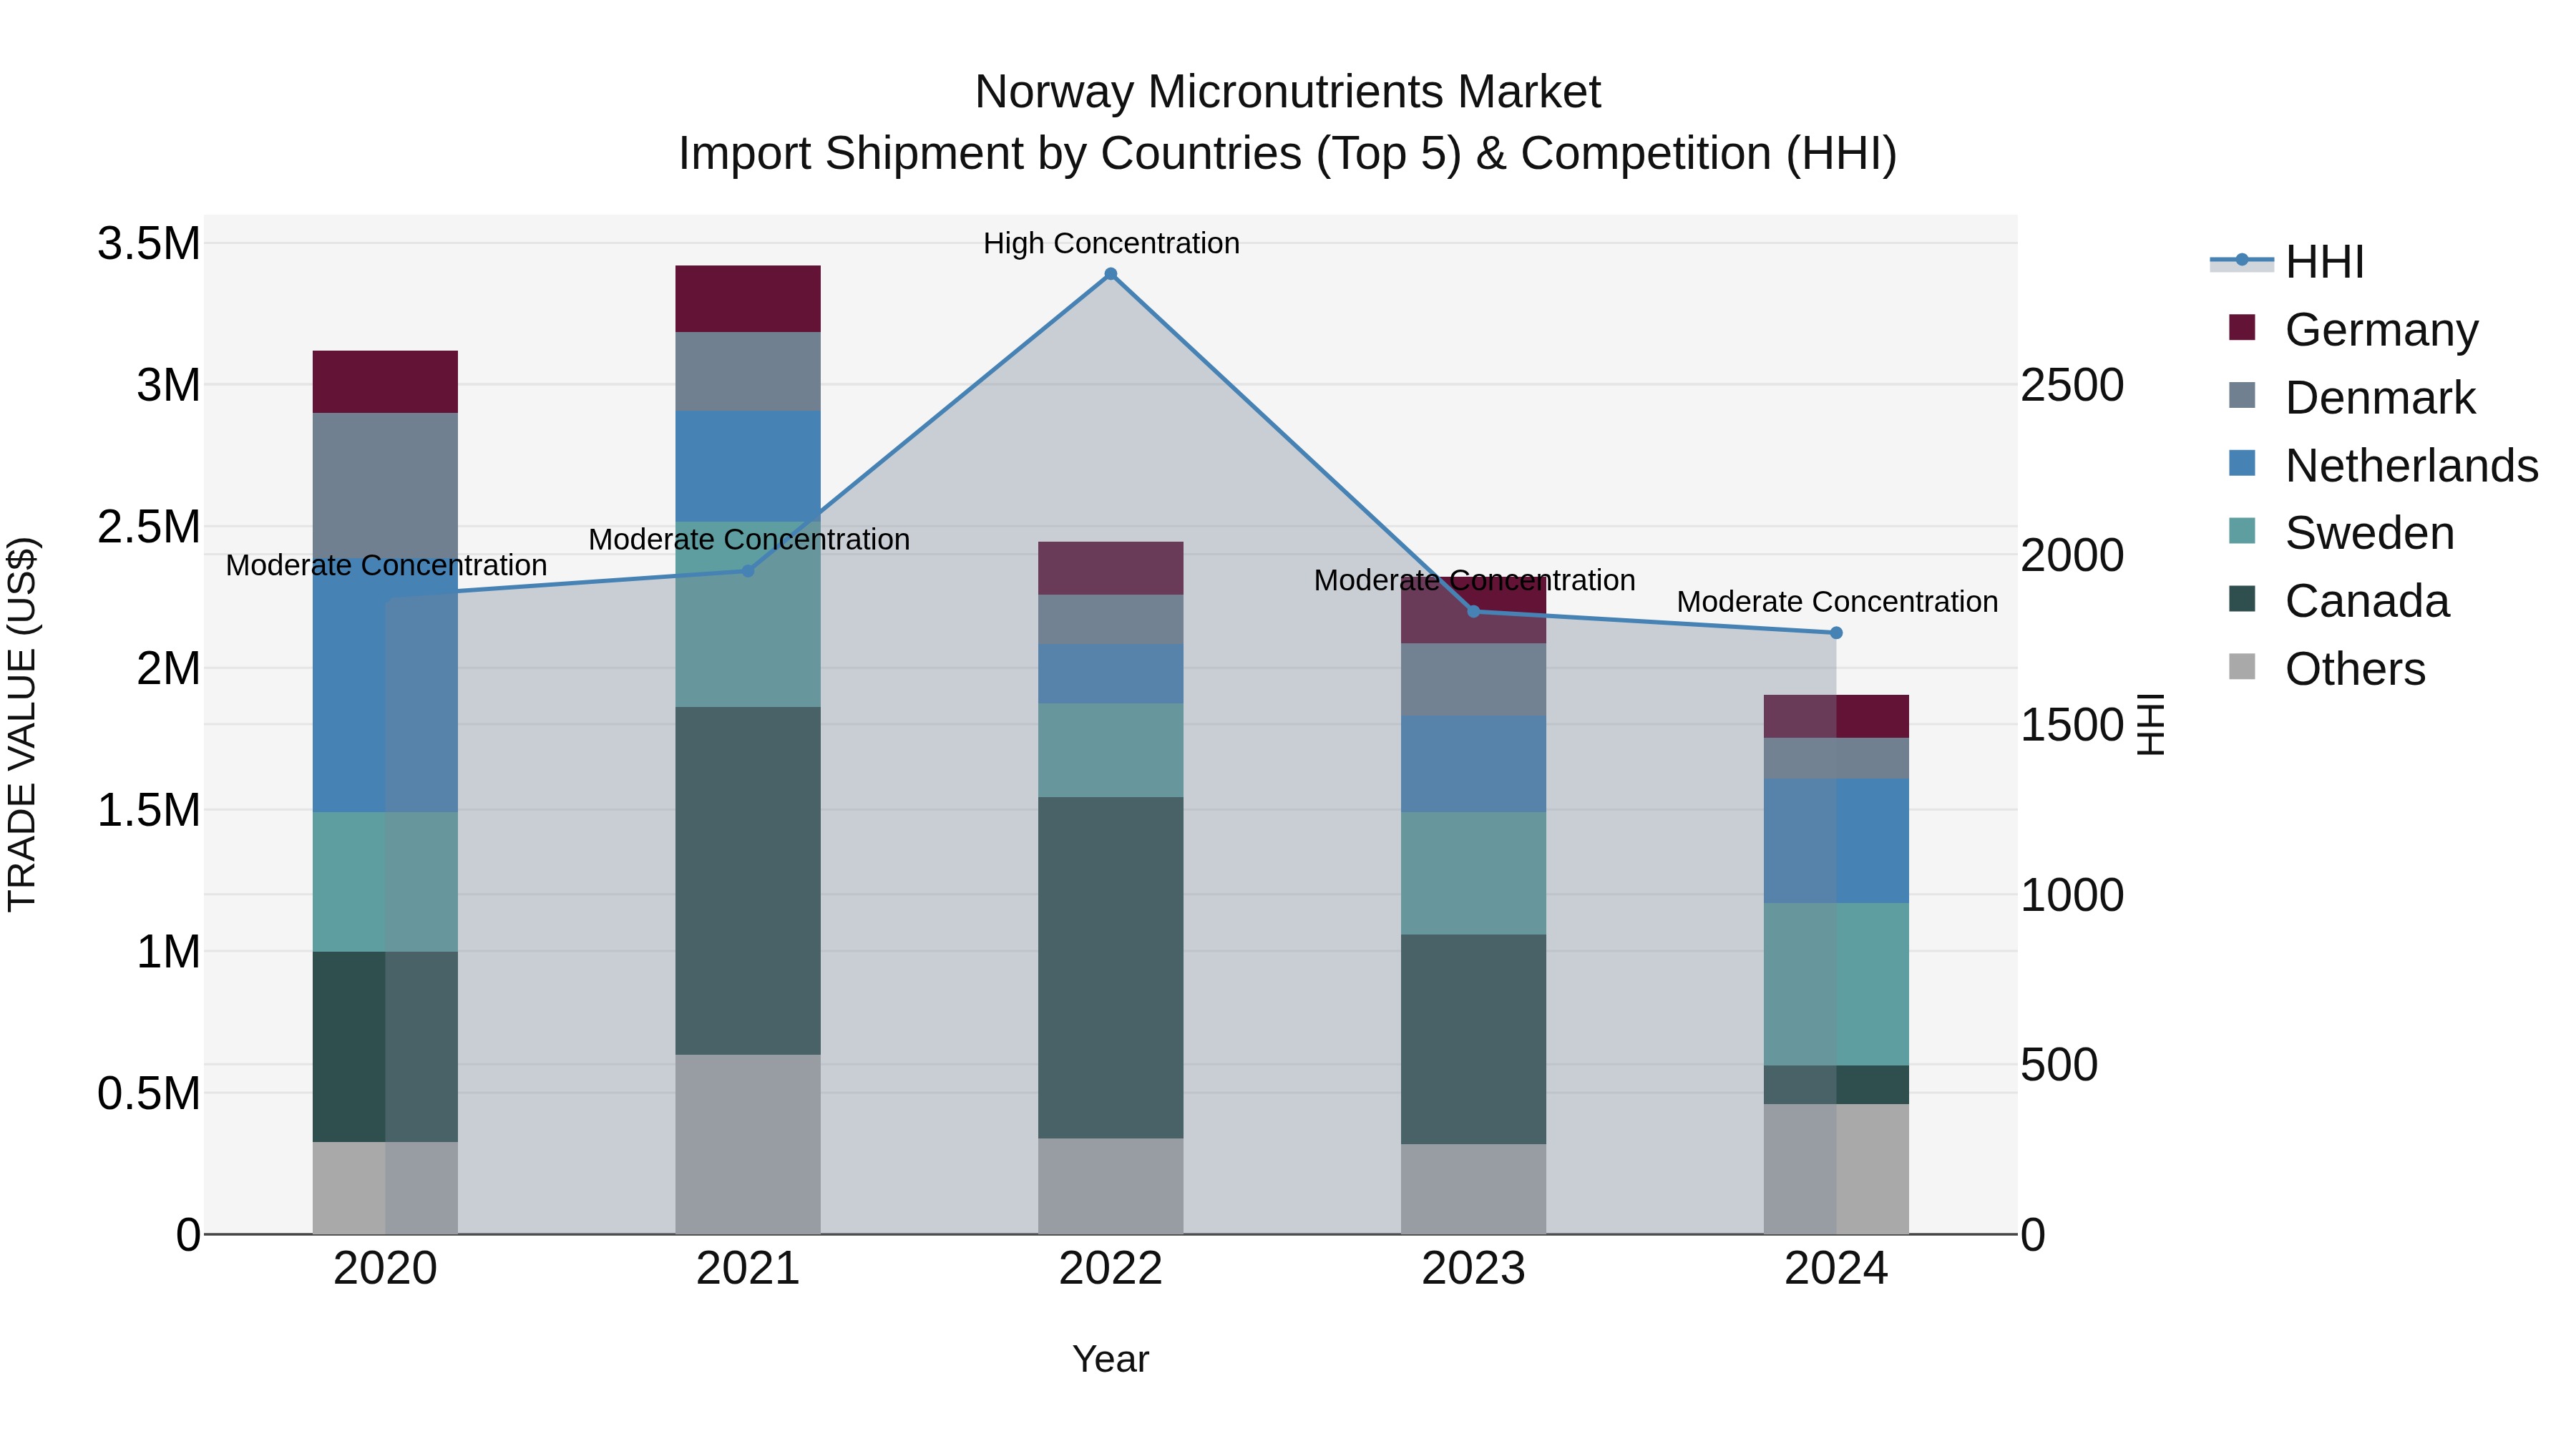
Norway Micronutrients Market Top 5 Importing Countries and Market Competition (HHI) Analysis
In 2024, Norway saw a steady flow of micronutrients imports from neighboring countries such as Sweden, Netherlands, Spain, Germany, and Denmark. Despite a negative CAGR of -11.6% from 2020 to 2024, the market remained moderately concentrated with the Herfindahl-Hirschman Index (HHI). However, the growth rate took a dip in 2024 with a decrease of -17.87% compared to the previous year. This trend indicates a potential shift in the dynamics of the Norwegian market for micronutrients imports, prompting a closer look at emerging trends and factors influencing these changes.
Key Highlights of the Report:
- Norway Micronutrients Market Outlook
- Market Size of Norway Micronutrients Market, 2025
- Forecast of Norway Micronutrients Market, 2032
- Historical Data and Forecast of Norway Micronutrients Revenues & Volume for the Period 2022 - 2032
- Norway Micronutrients Market Trend Evolution
- Norway Micronutrients Market Drivers and Challenges
- Norway Micronutrients Price Trends
- Norway Micronutrients Porter's Five Forces
- Norway Micronutrients Industry Life Cycle
- Historical Data and Forecast of Norway Micronutrients Market Revenues & Volume By Form for the Period 2022 - 2032
- Historical Data and Forecast of Norway Micronutrients Market Revenues & Volume By Chelated for the Period 2022 - 2032
- Historical Data and Forecast of Norway Micronutrients Market Revenues & Volume By Non-Chelated for the Period 2022 - 2032
- Historical Data and Forecast of Norway Micronutrients Market Revenues & Volume By Product for the Period 2022 - 2032
- Historical Data and Forecast of Norway Micronutrients Market Revenues & Volume By Boron for the Period 2022 - 2032
- Historical Data and Forecast of Norway Micronutrients Market Revenues & Volume By Copper for the Period 2022 - 2032
- Historical Data and Forecast of Norway Micronutrients Market Revenues & Volume By Iron for the Period 2022 - 2032
- Historical Data and Forecast of Norway Micronutrients Market Revenues & Volume By Manganese for the Period 2022 - 2032
- Historical Data and Forecast of Norway Micronutrients Market Revenues & Volume By Molybdenum for the Period 2022 - 2032
- Historical Data and Forecast of Norway Micronutrients Market Revenues & Volume By Zinc for the Period 2022 - 2032
- Historical Data and Forecast of Norway Micronutrients Market Revenues & Volume By Others for the Period 2022 - 2032
- Historical Data and Forecast of Norway Micronutrients Market Revenues & Volume By Crop for the Period 2022 - 2032
- Historical Data and Forecast of Norway Micronutrients Market Revenues & Volume By Cereals for the Period 2022 - 2032
- Historical Data and Forecast of Norway Micronutrients Market Revenues & Volume By Pulses and Oil Seeds for the Period 2022 - 2032
- Historical Data and Forecast of Norway Micronutrients Market Revenues & Volume By Fruits and Vegetables for the Period 2022 - 2032
- Historical Data and Forecast of Norway Micronutrients Market Revenues & Volume By Others for the Period 2022 - 2032
- Historical Data and Forecast of Norway Micronutrients Market Revenues & Volume By Application for the Period 2022 - 2032
- Historical Data and Forecast of Norway Micronutrients Market Revenues & Volume By Fertigation for the Period 2022 - 2032
- Historical Data and Forecast of Norway Micronutrients Market Revenues & Volume By Foilar for the Period 2022 - 2032
- Historical Data and Forecast of Norway Micronutrients Market Revenues & Volume By Soil for the Period 2022 - 2032
- Historical Data and Forecast of Norway Micronutrients Market Revenues & Volume By Seed Treatment for the Period 2022 - 2032
- Historical Data and Forecast of Norway Micronutrients Market Revenues & Volume By Hydroponics for the Period 2022 - 2032
- Historical Data and Forecast of Norway Micronutrients Market Revenues & Volume By Others for the Period 2022 - 2032
- Historical Data and Forecast of Norway Micronutrients Market Revenues & Volume By End-Use for the Period 2022 - 2032
- Historical Data and Forecast of Norway Micronutrients Market Revenues & Volume By Agriculture for the Period 2022 - 2032
- Historical Data and Forecast of Norway Micronutrients Market Revenues & Volume By Pharmaceutical for the Period 2022 - 2032
- Historical Data and Forecast of Norway Micronutrients Market Revenues & Volume By Cosmetics and Personal Care for the Period 2022 - 2032
- Historical Data and Forecast of Norway Micronutrients Market Revenues & Volume By Food and Beverages for the Period 2022 - 2032
- Historical Data and Forecast of Norway Micronutrients Market Revenues & Volume By Others for the Period 2022 - 2032
- Norway Micronutrients Import Export Trade Statistics
- Market Opportunity Assessment By Form
- Market Opportunity Assessment By Product
- Market Opportunity Assessment By Crop
- Market Opportunity Assessment By Application
- Market Opportunity Assessment By End-Use
- Norway Micronutrients Top Companies Market Share
- Norway Micronutrients Competitive Benchmarking By Technical and Operational Parameters
- Norway Micronutrients Company Profiles
- Norway Micronutrients Key Strategic Recommendations
Frequently Asked Questions About the Market Study (FAQs):
6Wresearch actively monitors the Norway Micronutrients Market and publishes its comprehensive annual report, highlighting emerging trends, growth drivers, revenue analysis, and forecast outlook. Our insights help businesses to make data-backed strategic decisions with ongoing market dynamics. Our analysts track relevent industries related to the Norway Micronutrients Market, allowing our clients with actionable intelligence and reliable forecasts tailored to emerging regional needs.
Yes, we provide customisation as per your requirements. To learn more, feel free to contact us on sales@6wresearch.com
1 Executive Summary |
2 Introduction |
2.1 Key Highlights of the Report |
2.2 Report Description |
2.3 Market Scope & Segmentation |
2.4 Research Methodology |
2.5 Assumptions |
3 Norway Micronutrients Market Overview |
3.1 Norway Country Macro Economic Indicators |
3.2 Norway Micronutrients Market Revenues & Volume, 2022 & 2032F |
3.3 Norway Micronutrients Market - Industry Life Cycle |
3.4 Norway Micronutrients Market - Porter's Five Forces |
3.5 Norway Micronutrients Market Revenues & Volume Share, By Form, 2022 & 2032F |
3.6 Norway Micronutrients Market Revenues & Volume Share, By Product, 2022 & 2032F |
3.7 Norway Micronutrients Market Revenues & Volume Share, By Crop, 2022 & 2032F |
3.8 Norway Micronutrients Market Revenues & Volume Share, By Application, 2022 & 2032F |
3.9 Norway Micronutrients Market Revenues & Volume Share, By End-Use, 2022 & 2032F |
4 Norway Micronutrients Market Dynamics |
4.1 Impact Analysis |
4.2 Market Drivers |
4.2.1 Increasing awareness about the importance of micronutrients in maintaining health and preventing diseases. |
4.2.2 Growing demand for fortified food and dietary supplements containing micronutrients. |
4.2.3 Government initiatives promoting the use of micronutrients in agriculture for enhancing crop yield and quality. |
4.3 Market Restraints |
4.3.1 Stringent regulations and approval processes for new micronutrient products. |
4.3.2 Limited consumer awareness and education regarding the benefits of micronutrients. |
4.3.3 Potential side effects or toxicity concerns associated with excessive consumption of certain micronutrients. |
5 Norway Micronutrients Market Trends |
6 Norway Micronutrients Market, By Types |
6.1 Norway Micronutrients Market, By Form |
6.1.1 Overview and Analysis |
6.1.2 Norway Micronutrients Market Revenues & Volume, By Form, 2022 - 2032F |
6.1.3 Norway Micronutrients Market Revenues & Volume, By Chelated, 2022 - 2032F |
6.1.4 Norway Micronutrients Market Revenues & Volume, By Non-Chelated, 2022 - 2032F |
6.2 Norway Micronutrients Market, By Product |
6.2.1 Overview and Analysis |
6.2.2 Norway Micronutrients Market Revenues & Volume, By Boron, 2022 - 2032F |
6.2.3 Norway Micronutrients Market Revenues & Volume, By Copper, 2022 - 2032F |
6.2.4 Norway Micronutrients Market Revenues & Volume, By Iron, 2022 - 2032F |
6.2.5 Norway Micronutrients Market Revenues & Volume, By Manganese, 2022 - 2032F |
6.2.6 Norway Micronutrients Market Revenues & Volume, By Molybdenum, 2022 - 2032F |
6.2.7 Norway Micronutrients Market Revenues & Volume, By Zinc, 2022 - 2032F |
6.3 Norway Micronutrients Market, By Crop |
6.3.1 Overview and Analysis |
6.3.2 Norway Micronutrients Market Revenues & Volume, By Cereals, 2022 - 2032F |
6.3.3 Norway Micronutrients Market Revenues & Volume, By Pulses and Oil Seeds, 2022 - 2032F |
6.3.4 Norway Micronutrients Market Revenues & Volume, By Fruits and Vegetables, 2022 - 2032F |
6.3.5 Norway Micronutrients Market Revenues & Volume, By Others, 2022 - 2032F |
6.4 Norway Micronutrients Market, By Application |
6.4.1 Overview and Analysis |
6.4.2 Norway Micronutrients Market Revenues & Volume, By Fertigation, 2022 - 2032F |
6.4.3 Norway Micronutrients Market Revenues & Volume, By Foilar, 2022 - 2032F |
6.4.4 Norway Micronutrients Market Revenues & Volume, By Soil, 2022 - 2032F |
6.4.5 Norway Micronutrients Market Revenues & Volume, By Seed Treatment, 2022 - 2032F |
6.4.6 Norway Micronutrients Market Revenues & Volume, By Hydroponics, 2022 - 2032F |
6.4.7 Norway Micronutrients Market Revenues & Volume, By Others, 2022 - 2032F |
6.5 Norway Micronutrients Market, By End-Use |
6.5.1 Overview and Analysis |
6.5.2 Norway Micronutrients Market Revenues & Volume, By Agriculture, 2022 - 2032F |
6.5.3 Norway Micronutrients Market Revenues & Volume, By Pharmaceutical, 2022 - 2032F |
6.5.4 Norway Micronutrients Market Revenues & Volume, By Cosmetics and Personal Care, 2022 - 2032F |
6.5.5 Norway Micronutrients Market Revenues & Volume, By Food and Beverages, 2022 - 2032F |
6.5.6 Norway Micronutrients Market Revenues & Volume, By Others, 2022 - 2032F |
7 Norway Micronutrients Market Import-Export Trade Statistics |
7.1 Norway Micronutrients Market Export to Major Countries |
7.2 Norway Micronutrients Market Imports from Major Countries |
8 Norway Micronutrients Market Key Performance Indicators |
8.1 Percentage increase in the adoption of fortified food products in the market. |
8.2 Number of new product launches containing micronutrients. |
8.3 Growth in the number of micronutrient-enriched agricultural products in the market. |
8.4 Consumer surveys indicating awareness and perception of the importance of micronutrients in health. |
8.5 Research and development investment in micronutrient technology and innovation. |
9 Norway Micronutrients Market - Opportunity Assessment |
9.1 Norway Micronutrients Market Opportunity Assessment, By Form, 2022 & 2032F |
9.2 Norway Micronutrients Market Opportunity Assessment, By Product, 2022 & 2032F |
9.3 Norway Micronutrients Market Opportunity Assessment, By Crop, 2022 & 2032F |
9.4 Norway Micronutrients Market Opportunity Assessment, By Application, 2022 & 2032F |
9.5 Norway Micronutrients Market Opportunity Assessment, By End-Use, 2022 & 2032F |
10 Norway Micronutrients Market - Competitive Landscape |
10.1 Norway Micronutrients Market Revenue Share, By Companies, 2025 |
10.2 Norway Micronutrients Market Competitive Benchmarking, By Operating and Technical Parameters |
11 Company Profiles |
12 Recommendations |
13 Disclaimer |
Export potential assessment - trade Analytics for 2030
Export potential enables firms to identify high-growth global markets with greater confidence by combining advanced trade intelligence with a structured quantitative methodology. The framework analyzes emerging demand trends and country-level import patterns while integrating macroeconomic and trade datasets such as GDP and population forecasts, bilateral import–export flows, tariff structures, elasticity differentials between developed and developing economies, geographic distance, and import demand projections. Using weighted trade values from 2020–2024 as the base period to project country-to-country export potential for 2030, these inputs are operationalized through calculated drivers such as gravity model parameters, tariff impact factors, and projected GDP per-capita growth. Through an analysis of hidden potentials, demand hotspots, and market conditions that are most favorable to success, this method enables firms to focus on target countries, maximize returns, and global expansion with data, backed by accuracy.
By factoring in the projected importer demand gap that is currently unmet and could be potential opportunity, it identifies the potential for the Exporter (Country) among 190 countries, against the general trade analysis, which identifies the biggest importer or exporter.
To discover high-growth global markets and optimize your business strategy:
Click Here
Pricing
- Single User License$ 1,995
- Department License$ 2,400
- Site License$ 3,120
- Global License$ 3,795

Search
Thought Leadership and Analyst Meet


Our Clients
Latest Reports
- India Ultrasonic Smart Water Meter Market (2026-2032) | Outlook, Competition, Drivers, Trends, Demand, Competitive, Strategic Insights, Companies, Challenges, Strategy, Consumer Insights, Analysis, Opportunities, Growth, Size, Share, Industry, Revenue, Segments, Value, Segmentation, Supply, Forecast, Restraints,
- India Electromagnetic Bulk Flow Meter Market (2026-2032) | Analysis, Challenges, Strategic Insights, Supply, Forecast, Growth, Share, Consumer Insights, Competitive, Value, Outlook, Size & Demand,
- India Battery Powered Bulk Flow Meter Market (2026-2032) | Outlook, Analysis, Competitive Landscape, Growth, Size, Trends, Value, Revenue, Companies, Segmentation, Share & Forecast
- Bosnia and Herzegovina Fuel-Efficient Winglets Market (2026-2032) | Growth, Competition, Strategy, Restraints, Trends, Challenges, segmentation, Value, Outlook, Investment Opportunities, Analysis, Revenue, Companies, Insights, Pricing, Size, Drivers, Demand, Share, Forecast
- Canada Cloud CFD Market (2026-2032) | Size & Revenue, Industry, Growth, Competitive Landscape, Forecast, Segmentation, Value, Outlook, Trends, Share, Analysis, Companies
- Taiwan Food Delivery Platform Market (2026-2032) | Companies, Outlook, Analysis, Trends, Value, Revenue, Segmentation, Share, Forecast, Competitive Landscape, Growth, Size & Forecast
- United Kingdom (UK) Long-term Care Insurance Market (2026-2032) | Growth, Share, Consumer Insights, Drivers, Opportunities, Competition, Pricing Analysis, Segments, Restraints, Companies, Competitive, Value, Outlook, Size, Demand, Analysis, Challenges, Strategic Insights, Investment Trends, Revenue, Trends, Supply, Forecast
- United Kingdom (UK) Long Term Care Market (2026-2032) | Companies, Outlook, Analysis, Trends, Value, Revenue, Segmentation, Share, Forecast, Competitive Landscape, Growth, Size & Forecast
- Iraq Insulation and Waterproofing Market (2026-2032) | Outlook, Drivers, Growth, Size, Share, Industry, Revenue, Trends, Demand, Competitive, Strategic Insights, Opportunities, Segments, Companies, Challenges, Strategy, Consumer Insights, Analysis, Investment Trends, Value, Segmentation, Forecast, Restraints
- India Switchgear Market Outlook (2026-2032) | Size, Share, Trends, Growth, Revenue, Forecast, Analysis, Value, Outlook
Industry Events and Analyst Meet

India EV Show 2026

EV tech India Expo 2026

Auto Tech Asia 2026

Battery Tech India 2026

Smart Production Solutions Guangzhou 2026
Whitepaper
- Middle East & Africa Commercial Security Market Click here to view more.
- Middle East & Africa Fire Safety Systems & Equipment Market Click here to view more.
- GCC Drone Market Click here to view more.
- Middle East Lighting Fixture Market Click here to view more.
- GCC Physical & Perimeter Security Market Click here to view more.
6WResearch In News
- Doha a strategic location for EV manufacturing hub: IPA Qatar
- Demand for luxury TVs surging in the GCC, says Samsung
- Empowering Growth: The Thriving Journey of Bangladesh’s Cable Industry
- Demand for luxury TVs surging in the GCC, says Samsung
- Video call with a traditional healer? Once unthinkable, it’s now common in South Africa
- Intelligent Buildings To Smooth GCC’s Path To Net Zero