Oman Commercial vehicles Market (2026-2032) | Companies, Industry, Growth, Value, Outlook, COVID-19 IMPACT, Trends, Analysis, Forecast, Size, Revenue & Share
Market Forecast By Product (Light Commercial Vehicles (LCVs), Heavy Trucks, Buses & Coaches), By End-Users (Industrial, Mining & Construction, Logistics, Passenger Transportation, Others) And Competitive Landscape
| Product Code: ETC028023 | Publication Date: Jun 2023 | Updated Date: Jun 2026 | Product Type: Report | |
| Publisher: 6Wresearch | Author: Ravi Bhandari | No. of Pages: 70 | No. of Figures: 35 | No. of Tables: 5 |
Oman Commercial vehicles Market Summary
The oman commercial vehicles market was estimated at USD 335 Million in 2025 and is projected to reach USD 472 Million by 2032, growing at a CAGR of 5.7% from 2026 to 2032.
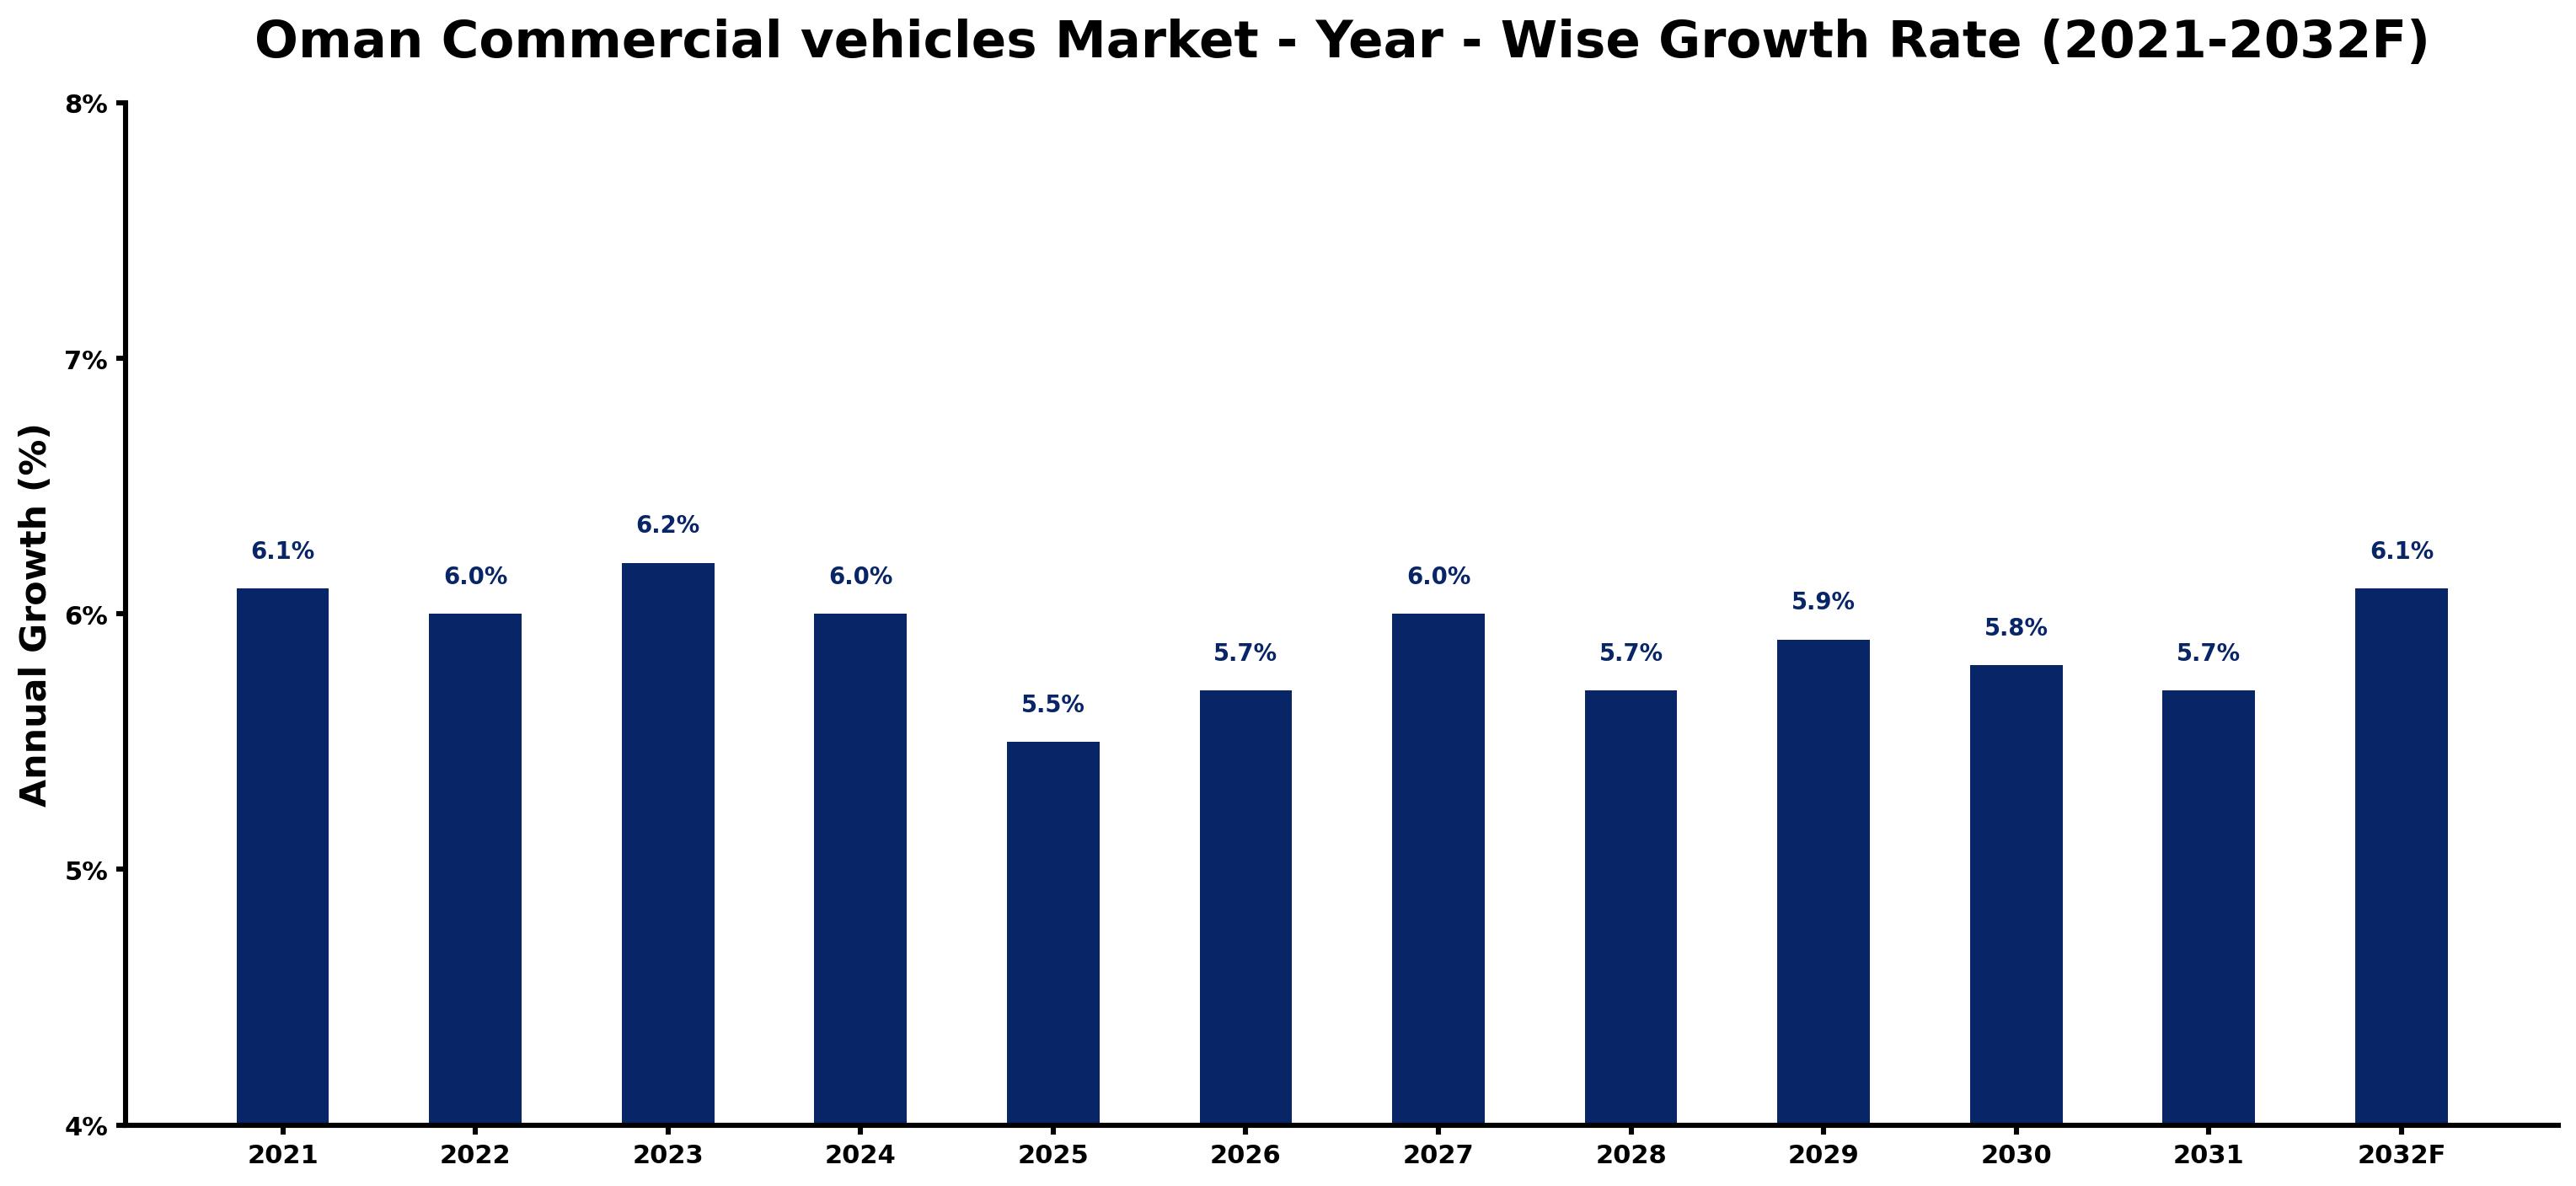
Oman Commercial vehicles Market Growth Rate Analysis (2021-2032)
The Omani commercial vehicles market has exhibited a stable growth pattern, with annual growth rates averaging around 6% over the past few years. Specifically, growth was recorded at 6.1% in 2021, slightly easing to 6.0% in 2022, before picking up again to 6.2% in 2023. This upward momentum can be attributed to increased consumer demand driven by infrastructure projects and a burgeoning logistics sector. Slight fluctuations are observed; for instance, a dip to 5.5% in 2025 aligns with global supply chain challenges impacting production. However, anticipated investments in technology and a commitment to energy transition are expected to sustain growth, culminating in a projected rate of 6.1% by 2032, reflecting Oman's strategic focus on modernization.
Oman Commercial vehicles Market Year-wise Growth Rate and Key Drivers
This graph highlights how the Oman Commercial vehicles Market has steadily grown over the past five years, supported by major growth factors.
The table below presents the year wise growth rates along with the key drivers influencing the market
| Year | Growth Rate | Major Drivers |
| 2021 | 6.1% | Post-pandemic recovery increased investments in infrastructure and construction projects across Oman. |
| 2022 | 6.0% | Local manufacturing initiatives encouraged the production of commercial vehicles within the Sultanate. |
| 2023 | 6.2% | Supply chain improvements enhanced vehicle availability, satisfying growing market needs effectively. |
| 2024 | 6.0% | Expansion of logistics networks highlighted the importance of reliable commercial transportation solutions. |
| 2025 | 5.5% | Technological developments in vehicle efficiency attracted fleet operators looking to reduce costs. |
| 2026 | 5.7% | Sustainability concerns prompted a shift towards electric and hybrid commercial vehicle models. |
| 2027 | 6.0% | Regional trade agreements opened new avenues for commercial vehicle market participants in Oman. |
| 2028 | 5.7% | Urbanization trends in Muscat and other cities spurred demand for transportation fleets dramatically. |
| 2029 | 5.9% | Increasing tourism initiatives necessitated versatile commercial vehicles for diverse operational requirements. |
| 2030 | 5.8% | Rising consumer expectations pushed manufacturers to enhance features and performance in vehicles. |
| 2031 | 5.7% | Integration of smart technologies in vehicles began reshaping operational efficiency and fleet management. |
| 2032 | 6.1% | Competitive financing options emerged, making commercial vehicles accessible to a broader customer base. |
Note - Market size estimations and growth projections presented in this report are based on 6Wresearch's advanced forecasting approach, validated with industry datasets as of June 2026.
Key Highlights of the Report:
- Oman Commercial vehicles Market Outlook
- Market Size of Oman Commercial vehicles Market, 2025
- Forecast of Oman Commercial vehicles Market, 2023F
- Historical Data and Forecast of Oman Commercial vehicles Revenues & Volume for the Period 2022-2032F
- Oman Commercial vehicles Market Trend Evolution
- Oman Commercial vehicles Market Drivers and Challenges
- Oman Commercial vehicles Price Trends
- Oman Commercial vehicles Porter's Five Forces
- Oman Commercial vehicles Industry Life Cycle
- Historical Data and Forecast of Oman Commercial vehicles Market Revenues & Volume By Product for the Period 2022-2032F
- Historical Data and Forecast of Oman Commercial vehicles Market Revenues & Volume By Light Commercial Vehicles (LCVs) for the Period 2022-2032F
- Historical Data and Forecast of Oman Commercial vehicles Market Revenues & Volume By Heavy Trucks for the Period 2022-2032F
- Historical Data and Forecast of Oman Commercial vehicles Market Revenues & Volume By Buses & Coaches for the Period 2022-2032F
- Historical Data and Forecast of Oman Commercial vehicles Market Revenues & Volume By End-Users for the Period 2022-2032F
- Historical Data and Forecast of Oman Commercial vehicles Market Revenues & Volume By Industrial for the Period 2022-2032F
- Historical Data and Forecast of Oman Commercial vehicles Market Revenues & Volume By Mining & Construction for the Period 2022-2032F
- Historical Data and Forecast of Oman Commercial vehicles Market Revenues & Volume By Logistics for the Period 2022-2032F
- Historical Data and Forecast of Oman Commercial vehicles Market Revenues & Volume By Passenger Transportation for the Period 2022-2032F
- Historical Data and Forecast of Oman Commercial vehicles Market Revenues & Volume By Others for the Period 2022-2032F
- Oman Commercial vehicles Import Export Trade Statistics
- Market Opportunity Assessment By Product
- Market Opportunity Assessment By End-Users
- Oman Commercial vehicles Top Companies Market Share
- Oman Commercial vehicles Competitive Benchmarking By Technical and Operational Parameters
- Oman Commercial vehicles Company Profiles
- Oman Commercial vehicles Key Strategic Recommendations
Frequently Asked Questions About the Market Study (FAQs):
6Wresearch actively monitors the Oman Commercial vehicles Market and publishes its comprehensive annual report, highlighting emerging trends, growth drivers, revenue analysis, and forecast outlook. Our insights help businesses to make data-backed strategic decisions with ongoing market dynamics. Our analysts track relevent industries related to the Oman Commercial vehicles Market, allowing our clients with actionable intelligence and reliable forecasts tailored to emerging regional needs.
Yes, we provide customisation as per your requirements. To learn more, feel free to contact us on sales@6wresearch.com
1 Executive Summary |
2 Introduction |
2.1 Key Highlights of the Report |
2.2 Report Description |
2.3 Market Scope & Segmentation |
2.4 Research Methodology |
2.5 Assumptions |
3 Oman Commercial vehicles Market Overview |
3.1 Oman Country Macro Economic Indicators |
3.2 Oman Commercial vehicles Market Revenues & Volume, 2022 & 2032F |
3.3 Oman Commercial vehicles Market - Industry Life Cycle |
3.4 Oman Commercial vehicles Market - Porter's Five Forces |
3.5 Oman Commercial vehicles Market Revenues & Volume Share, By Product, 2022 & 2032F |
3.6 Oman Commercial vehicles Market Revenues & Volume Share, By End-Users, 2022 & 2032F |
4 Oman Commercial vehicles Market Dynamics |
4.1 Impact Analysis |
4.2 Market Drivers |
4.3 Market Restraints |
5 Oman Commercial vehicles Market Trends |
6 Oman Commercial vehicles Market, By Types |
6.1 Oman Commercial vehicles Market, By Product |
6.1.1 Overview and Analysis |
6.1.2 Oman Commercial vehicles Market Revenues & Volume, By Product, 2016 - 2026F |
6.1.3 Oman Commercial vehicles Market Revenues & Volume, By Light Commercial Vehicles (LCVs), 2016 - 2026F |
6.1.4 Oman Commercial vehicles Market Revenues & Volume, By Heavy Trucks, 2016 - 2026F |
6.1.5 Oman Commercial vehicles Market Revenues & Volume, By Buses & Coaches, 2016 - 2026F |
6.2 Oman Commercial vehicles Market, By End-Users |
6.2.1 Overview and Analysis |
6.2.2 Oman Commercial vehicles Market Revenues & Volume, By Industrial, 2016 - 2026F |
6.2.3 Oman Commercial vehicles Market Revenues & Volume, By Mining & Construction, 2016 - 2026F |
6.2.4 Oman Commercial vehicles Market Revenues & Volume, By Logistics, 2016 - 2026F |
6.2.5 Oman Commercial vehicles Market Revenues & Volume, By Passenger Transportation, 2016 - 2026F |
6.2.6 Oman Commercial vehicles Market Revenues & Volume, By Others, 2016 - 2026F |
7 Oman Commercial vehicles Market Import-Export Trade Statistics |
7.1 Oman Commercial vehicles Market Export to Major Countries |
7.2 Oman Commercial vehicles Market Imports from Major Countries |
8 Oman Commercial vehicles Market Key Performance Indicators |
9 Oman Commercial vehicles Market - Opportunity Assessment |
9.1 Oman Commercial vehicles Market Opportunity Assessment, By Product, 2022 & 2032F |
9.2 Oman Commercial vehicles Market Opportunity Assessment, By End-Users, 2022 & 2032F |
10 Oman Commercial vehicles Market - Competitive Landscape |
10.1 Oman Commercial vehicles Market Revenue Share, By Companies, 2019 |
10.2 Oman Commercial vehicles Market Competitive Benchmarking, By Operating and Technical Parameters |
11 Company Profiles |
12 Recommendations |
13 Disclaimer |
Global Go To Market Strategy - 2030
Export potential enables firms to identify high-growth global markets with greater confidence by combining advanced trade intelligence with a structured quantitative methodology. The framework analyzes emerging demand trends and country-level import patterns while integrating macroeconomic and trade datasets such as GDP and population forecasts, bilateral import–export flows, tariff structures, elasticity differentials between developed and developing economies, geographic distance, and import demand projections. Using weighted trade values from 2020–2024 as the base period to project country-to-country export potential for 2030, these inputs are operationalized through calculated drivers such as gravity model parameters, tariff impact factors, and projected GDP per-capita growth. Through an analysis of hidden potentials, demand hotspots, and market conditions that are most favorable to success, this method enables firms to focus on target countries, maximize returns, and global expansion with data, backed by accuracy.
By factoring in the projected importer demand gap that is currently unmet and could be potential opportunity, it identifies the potential for the Exporter (Country) among 190 countries, against the general trade analysis, which identifies the biggest importer or exporter.
To discover high-growth global markets and optimize your business strategy:
Click Here
Pricing
- Single User License$ 1,995
- Department License$ 2,400
- Site License$ 3,120
- Global License$ 3,795

Leadership Perspectives from Industry Events
Search
Thought Leadership and Analyst Meet


Our Clients
6WResearch In News
- India Air Conditioner Market Set for Strong Rebound in 2026 After Weather-Led Correction and GST-Driven Recovery: 6Wresearch
- ADAS in India: How Automatic Emergency Braking, Blind Spot Detection & Driver Monitoring are Transforming Road Safety
- Doha a strategic location for EV manufacturing hub: IPA Qatar
- Demand for luxury TVs surging in the GCC, says Samsung
- Empowering Growth: The Thriving Journey of Bangladesh’s Cable Industry
- Demand for luxury TVs surging in the GCC, says Samsung
Latest Reports
- Nicaragua RPG Gaming Market (2026-2032)
- New Zealand RPG Gaming Market (2026-2032)
- Netherlands RPG Gaming Market (2026-2032)
- Nauru RPG Gaming Market (2026-2032)
- Namibia RPG Gaming Market (2026-2032)
- Mozambique RPG Gaming Market (2026-2032)
- Montenegro RPG Gaming Market (2026-2032)
- Mongolia RPG Gaming Market (2026-2032)
- Monaco RPG Gaming Market (2026-2032)
- Micronesia RPG Gaming Market (2026-2032)
Industry Events and Analyst Meet

HIMTEX 2026

India Refining Summit 2026

India EV Show 2026

EV tech India Expo 2026

Auto Tech Asia 2026
Whitepaper
- Middle East & Africa Commercial Security Market Click here to view more.
- Middle East & Africa Fire Safety Systems & Equipment Market Click here to view more.
- GCC Drone Market Click here to view more.
- Middle East Lighting Fixture Market Click here to view more.
- GCC Physical & Perimeter Security Market Click here to view more.