Pakistan Automotive Composites Market (2026-2032) Outlook | Size, Revenue, Growth, Companies, Forecast, Share, Industry, Value, Trends & Analysis
Market Forecast By Fiber (Glass, Carbon, Others), By Resin (Thermoset, Thermoplastic), By Application (Interior, Exterior, Powertrain, Chassis), By Vehicle (Non-electric, Electric) And Competitive Landscape
| Product Code: ETC069596 | Publication Date: Jun 2021 | Updated Date: Mar 2026 | Product Type: Report | |
| Publisher: 6Wresearch | Author: Ravi Bhandari | No. of Pages: 70 | No. of Figures: 35 | No. of Tables: 5 |
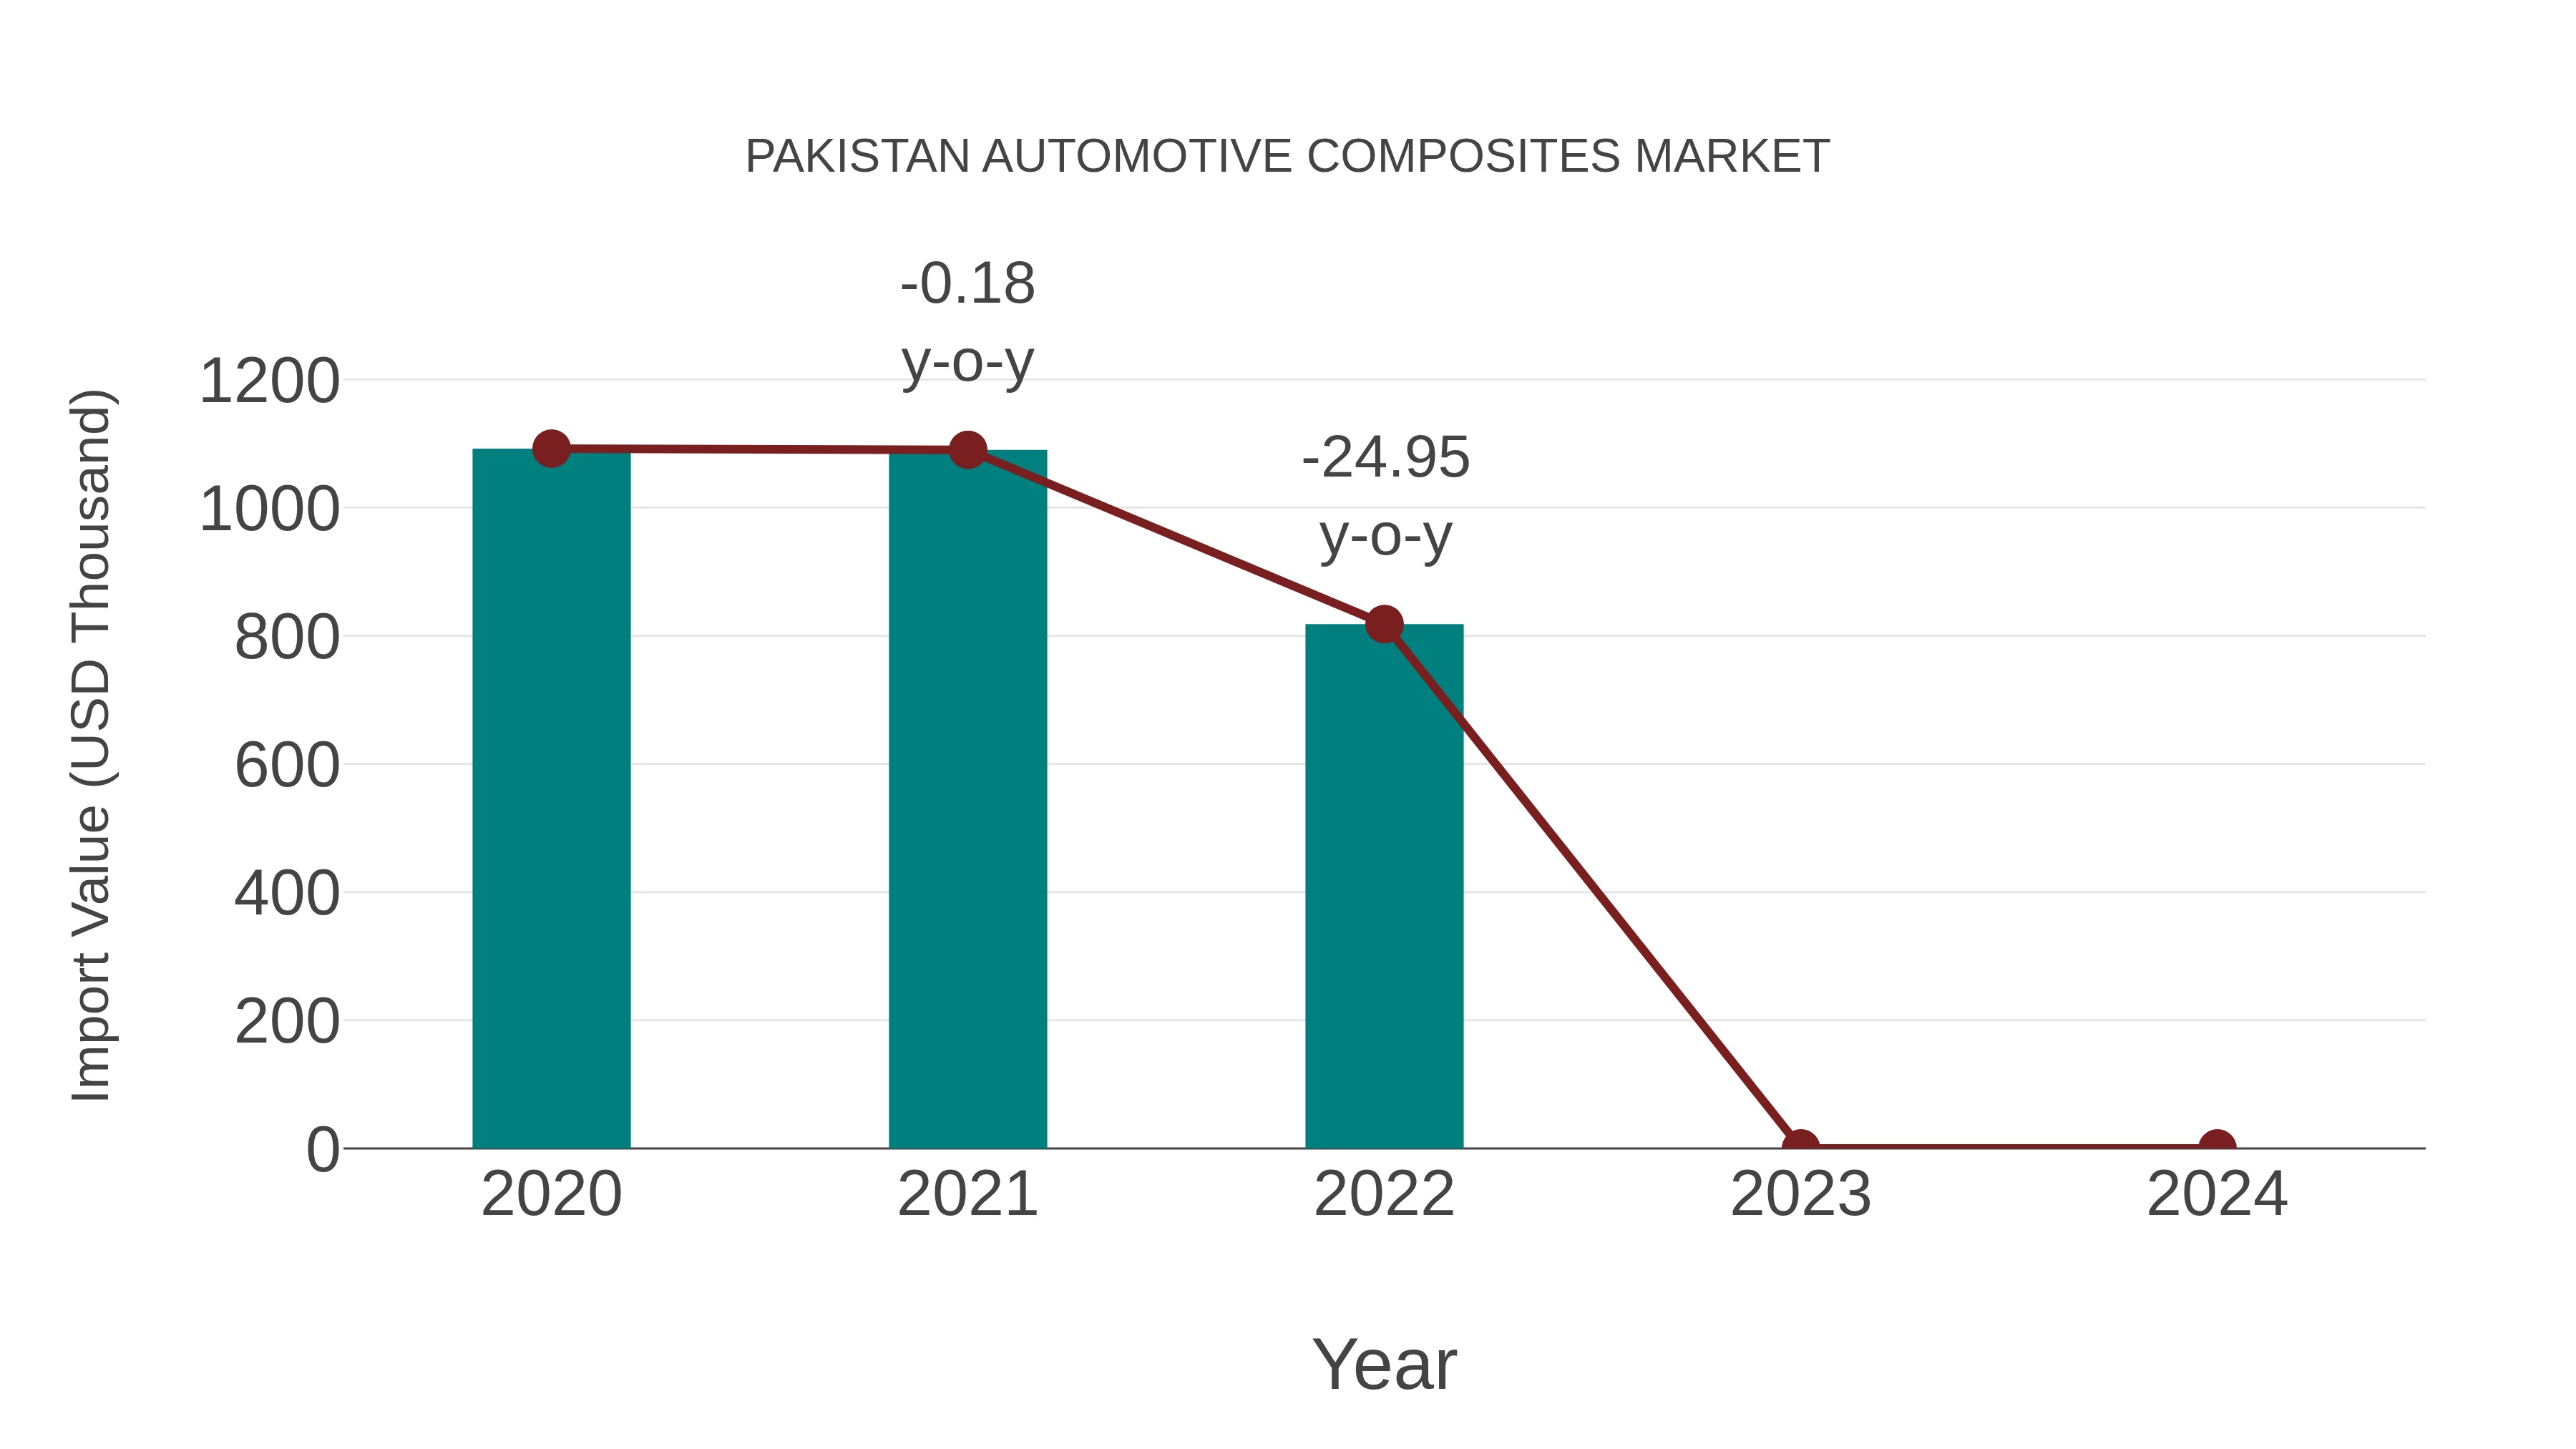
Pakistan Automotive Composites Market: Import Trend Analysis
In the Pakistan automotive composites market, the import trend experienced a negative Compound Annual Growth Rate (CAGR) of -13.45% from 2020 to 2024. This decline in imports could be attributed to factors such as shifting demand dynamics, market saturation, or changes in consumer preferences impacting trade performance.
Pakistan Automotive Composites Market Overview
The automotive composites market in Pakistan is witnessing steady growth owing to lightweighting trends in the automotive industry. Composites are increasingly used to manufacture vehicle components such as body panels, interiors, and under-the-hood applications. Environmental regulations and fuel efficiency norms are key factors driving the adoption of composites in automotive manufacturing.
Drivers of the market
The automotive composites market in Pakistan is witnessing growth due to the demand for lightweight and fuel-efficient vehicles. Composites offer high strength-to-weight ratios, corrosion resistance, and design flexibility, which are crucial in automotive applications. Government regulations promoting vehicle emission reduction are also driving the adoption of composites in the automotive sector.
Challenges of the market
The automotive composites market in Pakistan grapples with issues related to material cost and manufacturing complexity. While composite materials offer advantages such as weight reduction and enhanced fuel efficiency, their high production costs limit widespread adoption among local automotive manufacturers. Additionally, the lack of infrastructure for composite fabrication and limited expertise in composite design and production further hinder market growth in Pakistan.
Government Policy of the market
To support the automotive composites market, Pakistan has implemented policies to attract investment in composite materials manufacturing. Government initiatives include subsidies for research and development, promoting lightweight materials to improve vehicle fuel efficiency and safety standards, and reducing import tariffs on raw materials.
Key Highlights of the Report:
- Pakistan Automotive Composites Market Outlook
- Market Size of Pakistan Automotive Composites Market, 2025
- Forecast of Pakistan Automotive Composites Market, 2032
- Historical Data and Forecast of Pakistan Automotive Composites Revenues & Volume for the Period 2022-2032F
- Pakistan Automotive Composites Market Trend Evolution
- Pakistan Automotive Composites Market Drivers and Challenges
- Pakistan Automotive Composites Price Trends
- Pakistan Automotive Composites Porter's Five Forces
- Pakistan Automotive Composites Industry Life Cycle
- Historical Data and Forecast of Pakistan Automotive Composites Market Revenues & Volume By Fiber for the Period 2022-2032F
- Historical Data and Forecast of Pakistan Automotive Composites Market Revenues & Volume By Glass for the Period 2022-2032F
- Historical Data and Forecast of Pakistan Automotive Composites Market Revenues & Volume By Carbon for the Period 2022-2032F
- Historical Data and Forecast of Pakistan Automotive Composites Market Revenues & Volume By Others for the Period 2022-2032F
- Historical Data and Forecast of Pakistan Automotive Composites Market Revenues & Volume By Resin for the Period 2022-2032F
- Historical Data and Forecast of Pakistan Automotive Composites Market Revenues & Volume By Thermoset for the Period 2022-2032F
- Historical Data and Forecast of Pakistan Automotive Composites Market Revenues & Volume By Thermoplastic for the Period 2022-2032F
- Historical Data and Forecast of Pakistan Automotive Composites Market Revenues & Volume By Application for the Period 2022-2032F
- Historical Data and Forecast of Pakistan Automotive Composites Market Revenues & Volume By Interior for the Period 2022-2032F
- Historical Data and Forecast of Pakistan Automotive Composites Market Revenues & Volume By Exterior for the Period 2022-2032F
- Historical Data and Forecast of Pakistan Automotive Composites Market Revenues & Volume By Powertrain for the Period 2022-2032F
- Historical Data and Forecast of Pakistan Automotive Composites Market Revenues & Volume By Chassis for the Period 2022-2032F
- Historical Data and Forecast of Pakistan Automotive Composites Market Revenues & Volume By Vehicle for the Period 2022-2032F
- Historical Data and Forecast of Pakistan Automotive Composites Market Revenues & Volume By Non-electric for the Period 2022-2032F
- Historical Data and Forecast of Pakistan Automotive Composites Market Revenues & Volume By Electric for the Period 2022-2032F
- Pakistan Automotive Composites Import Export Trade Statistics
- Market Opportunity Assessment By Fiber
- Market Opportunity Assessment By Resin
- Market Opportunity Assessment By Application
- Market Opportunity Assessment By Vehicle
- Pakistan Automotive Composites Top Companies Market Share
- Pakistan Automotive Composites Competitive Benchmarking By Technical and Operational Parameters
- Pakistan Automotive Composites Company Profiles
- Pakistan Automotive Composites Key Strategic Recommendations
Pakistan Automotive Composites Market (2026-2032): FAQs
6Wresearch actively monitors the Pakistan Automotive Composites Market and publishes its comprehensive annual report, highlighting emerging trends, growth drivers, revenue analysis, and forecast outlook. Our insights help businesses to make data-backed strategic decisions with ongoing market dynamics. Our analysts track relevent industries related to the Pakistan Automotive Composites Market, allowing our clients with actionable intelligence and reliable forecasts tailored to emerging regional needs.
Yes, we provide customisation as per your requirements. To learn more, feel free to contact us on sales@6wresearch.com
1 Executive Summary |
2 Introduction |
2.1 Key Highlights of the Report |
2.2 Report Description |
2.3 Market Scope & Segmentation |
2.4 Research Methodology |
2.5 Assumptions |
3 Pakistan Automotive Composites Market Overview |
3.1 Pakistan Country Macro Economic Indicators |
3.2 Pakistan Automotive Composites Market Revenues & Volume, 2022 & 2032F |
3.3 Pakistan Automotive Composites Market - Industry Life Cycle |
3.4 Pakistan Automotive Composites Market - Porter's Five Forces |
3.5 Pakistan Automotive Composites Market Revenues & Volume Share, By Fiber, 2022 & 2032F |
3.6 Pakistan Automotive Composites Market Revenues & Volume Share, By Resin, 2022 & 2032F |
3.7 Pakistan Automotive Composites Market Revenues & Volume Share, By Form, 2022 & 2032F |
3.8 Pakistan Automotive Composites Market Revenues & Volume Share, By Vehicle, 2022 & 2032F |
4 Pakistan Automotive Composites Market Dynamics |
4.1 Impact Analysis |
4.2 Market Drivers |
4.3 Market Restraints |
5 Pakistan Automotive Composites Market Trends |
6 Pakistan Automotive Composites Market, By Types |
6.1 Pakistan Automotive Composites Market, By Fiber |
6.1.1 Overview and Analysis |
6.1.2 Pakistan Automotive Composites Market Revenues & Volume, By Fiber, 2022-2032F |
6.1.3 Pakistan Automotive Composites Market Revenues & Volume, By Glass, 2022-2032F |
6.1.4 Pakistan Automotive Composites Market Revenues & Volume, By Carbon, 2022-2032F |
6.1.5 Pakistan Automotive Composites Market Revenues & Volume, By Others, 2022-2032F |
6.2 Pakistan Automotive Composites Market, By Resin |
6.2.1 Overview and Analysis |
6.2.2 Pakistan Automotive Composites Market Revenues & Volume, By Thermoset, 2022-2032F |
6.2.3 Pakistan Automotive Composites Market Revenues & Volume, By Thermoplastic, 2022-2032F |
6.3 Pakistan Automotive Composites Market, By Application |
6.3.1 Overview and Analysis |
6.3.2 Pakistan Automotive Composites Market Revenues & Volume, By Interior, 2022-2032F |
6.3.3 Pakistan Automotive Composites Market Revenues & Volume, By Exterior, 2022-2032F |
6.3.4 Pakistan Automotive Composites Market Revenues & Volume, By Powertrain, 2022-2032F |
6.3.5 Pakistan Automotive Composites Market Revenues & Volume, By Chassis, 2022-2032F |
6.4 Pakistan Automotive Composites Market, By Vehicle |
6.4.1 Overview and Analysis |
6.4.2 Pakistan Automotive Composites Market Revenues & Volume, By Non-electric, 2022-2032F |
6.4.3 Pakistan Automotive Composites Market Revenues & Volume, By Electric, 2022-2032F |
7 Pakistan Automotive Composites Market Import-Export Trade Statistics |
7.1 Pakistan Automotive Composites Market Export to Major Countries |
7.2 Pakistan Automotive Composites Market Imports from Major Countries |
8 Pakistan Automotive Composites Market Key Performance Indicators |
9 Pakistan Automotive Composites Market - Opportunity Assessment |
9.1 Pakistan Automotive Composites Market Opportunity Assessment, By Fiber, 2022 & 2032F |
9.2 Pakistan Automotive Composites Market Opportunity Assessment, By Resin, 2022 & 2032F |
9.3 Pakistan Automotive Composites Market Opportunity Assessment, By Application, 2022 & 2032F |
9.4 Pakistan Automotive Composites Market Opportunity Assessment, By Vehicle, 2022 & 2032F |
10 Pakistan Automotive Composites Market - Competitive Landscape |
10.1 Pakistan Automotive Composites Market Revenue Share, By Companies, 2025 |
10.2 Pakistan Automotive Composites Market Competitive Benchmarking, By Operating and Technical Parameters |
11 Company Profiles |
12 Recommendations |
13 Disclaimer |
Global Go To Market Strategy - 2030
Export potential enables firms to identify high-growth global markets with greater confidence by combining advanced trade intelligence with a structured quantitative methodology. The framework analyzes emerging demand trends and country-level import patterns while integrating macroeconomic and trade datasets such as GDP and population forecasts, bilateral import–export flows, tariff structures, elasticity differentials between developed and developing economies, geographic distance, and import demand projections. Using weighted trade values from 2020–2024 as the base period to project country-to-country export potential for 2030, these inputs are operationalized through calculated drivers such as gravity model parameters, tariff impact factors, and projected GDP per-capita growth. Through an analysis of hidden potentials, demand hotspots, and market conditions that are most favorable to success, this method enables firms to focus on target countries, maximize returns, and global expansion with data, backed by accuracy.
By factoring in the projected importer demand gap that is currently unmet and could be potential opportunity, it identifies the potential for the Exporter (Country) among 190 countries, against the general trade analysis, which identifies the biggest importer or exporter.
To discover high-growth global markets and optimize your business strategy:
Click Here
Pricing
- Single User License$ 1,995
- Department License$ 2,400
- Site License$ 3,120
- Global License$ 3,795

Leadership Perspectives from Industry Events
Search
Thought Leadership and Analyst Meet


Our Clients
6WResearch In News
- India Air Conditioner Market Set for Strong Rebound in 2026 After Weather-Led Correction and GST-Driven Recovery: 6Wresearch
- ADAS in India: How Automatic Emergency Braking, Blind Spot Detection & Driver Monitoring are Transforming Road Safety
- Doha a strategic location for EV manufacturing hub: IPA Qatar
- Demand for luxury TVs surging in the GCC, says Samsung
- Empowering Growth: The Thriving Journey of Bangladesh’s Cable Industry
- Demand for luxury TVs surging in the GCC, says Samsung
Latest Reports
- Nicaragua RPG Gaming Market (2026-2032)
- New Zealand RPG Gaming Market (2026-2032)
- Netherlands RPG Gaming Market (2026-2032)
- Nauru RPG Gaming Market (2026-2032)
- Namibia RPG Gaming Market (2026-2032)
- Mozambique RPG Gaming Market (2026-2032)
- Montenegro RPG Gaming Market (2026-2032)
- Mongolia RPG Gaming Market (2026-2032)
- Monaco RPG Gaming Market (2026-2032)
- Micronesia RPG Gaming Market (2026-2032)
Industry Events and Analyst Meet

HIMTEX 2026

India Refining Summit 2026

India EV Show 2026

EV tech India Expo 2026

Auto Tech Asia 2026
Whitepaper
- Middle East & Africa Commercial Security Market Click here to view more.
- Middle East & Africa Fire Safety Systems & Equipment Market Click here to view more.
- GCC Drone Market Click here to view more.
- Middle East Lighting Fixture Market Click here to view more.
- GCC Physical & Perimeter Security Market Click here to view more.