Peru industrial vehicles Market (2026-2032) | Share, Analysis, Industry, Size, Growth, Forecast, Revenue, Companies, Outlook, Trends & Value
Market Forecast By Product Type (Forklift, Aisle Truck, Tow Tractor, Container Handler), By Drive Type (Internal Combustion Engine, Battery-Operated, Gas-Powered), By Application (Industrial , Cargo) And Competitive Landscape
| Product Code: ETC029726 | Publication Date: Oct 2020 | Updated Date: Jun 2026 | Product Type: Report | |
| Publisher: 6Wresearch | Author: Dhaval Chaurasia | No. of Pages: 70 | No. of Figures: 35 | No. of Tables: 5 |
Peru industrial vehicles Market Summary
The peru industrial vehicles market was estimated at USD 204 Million in 2025 and is projected to reach USD 224 Million by 2032, growing at a CAGR of 1.3% from 2026 to 2032.
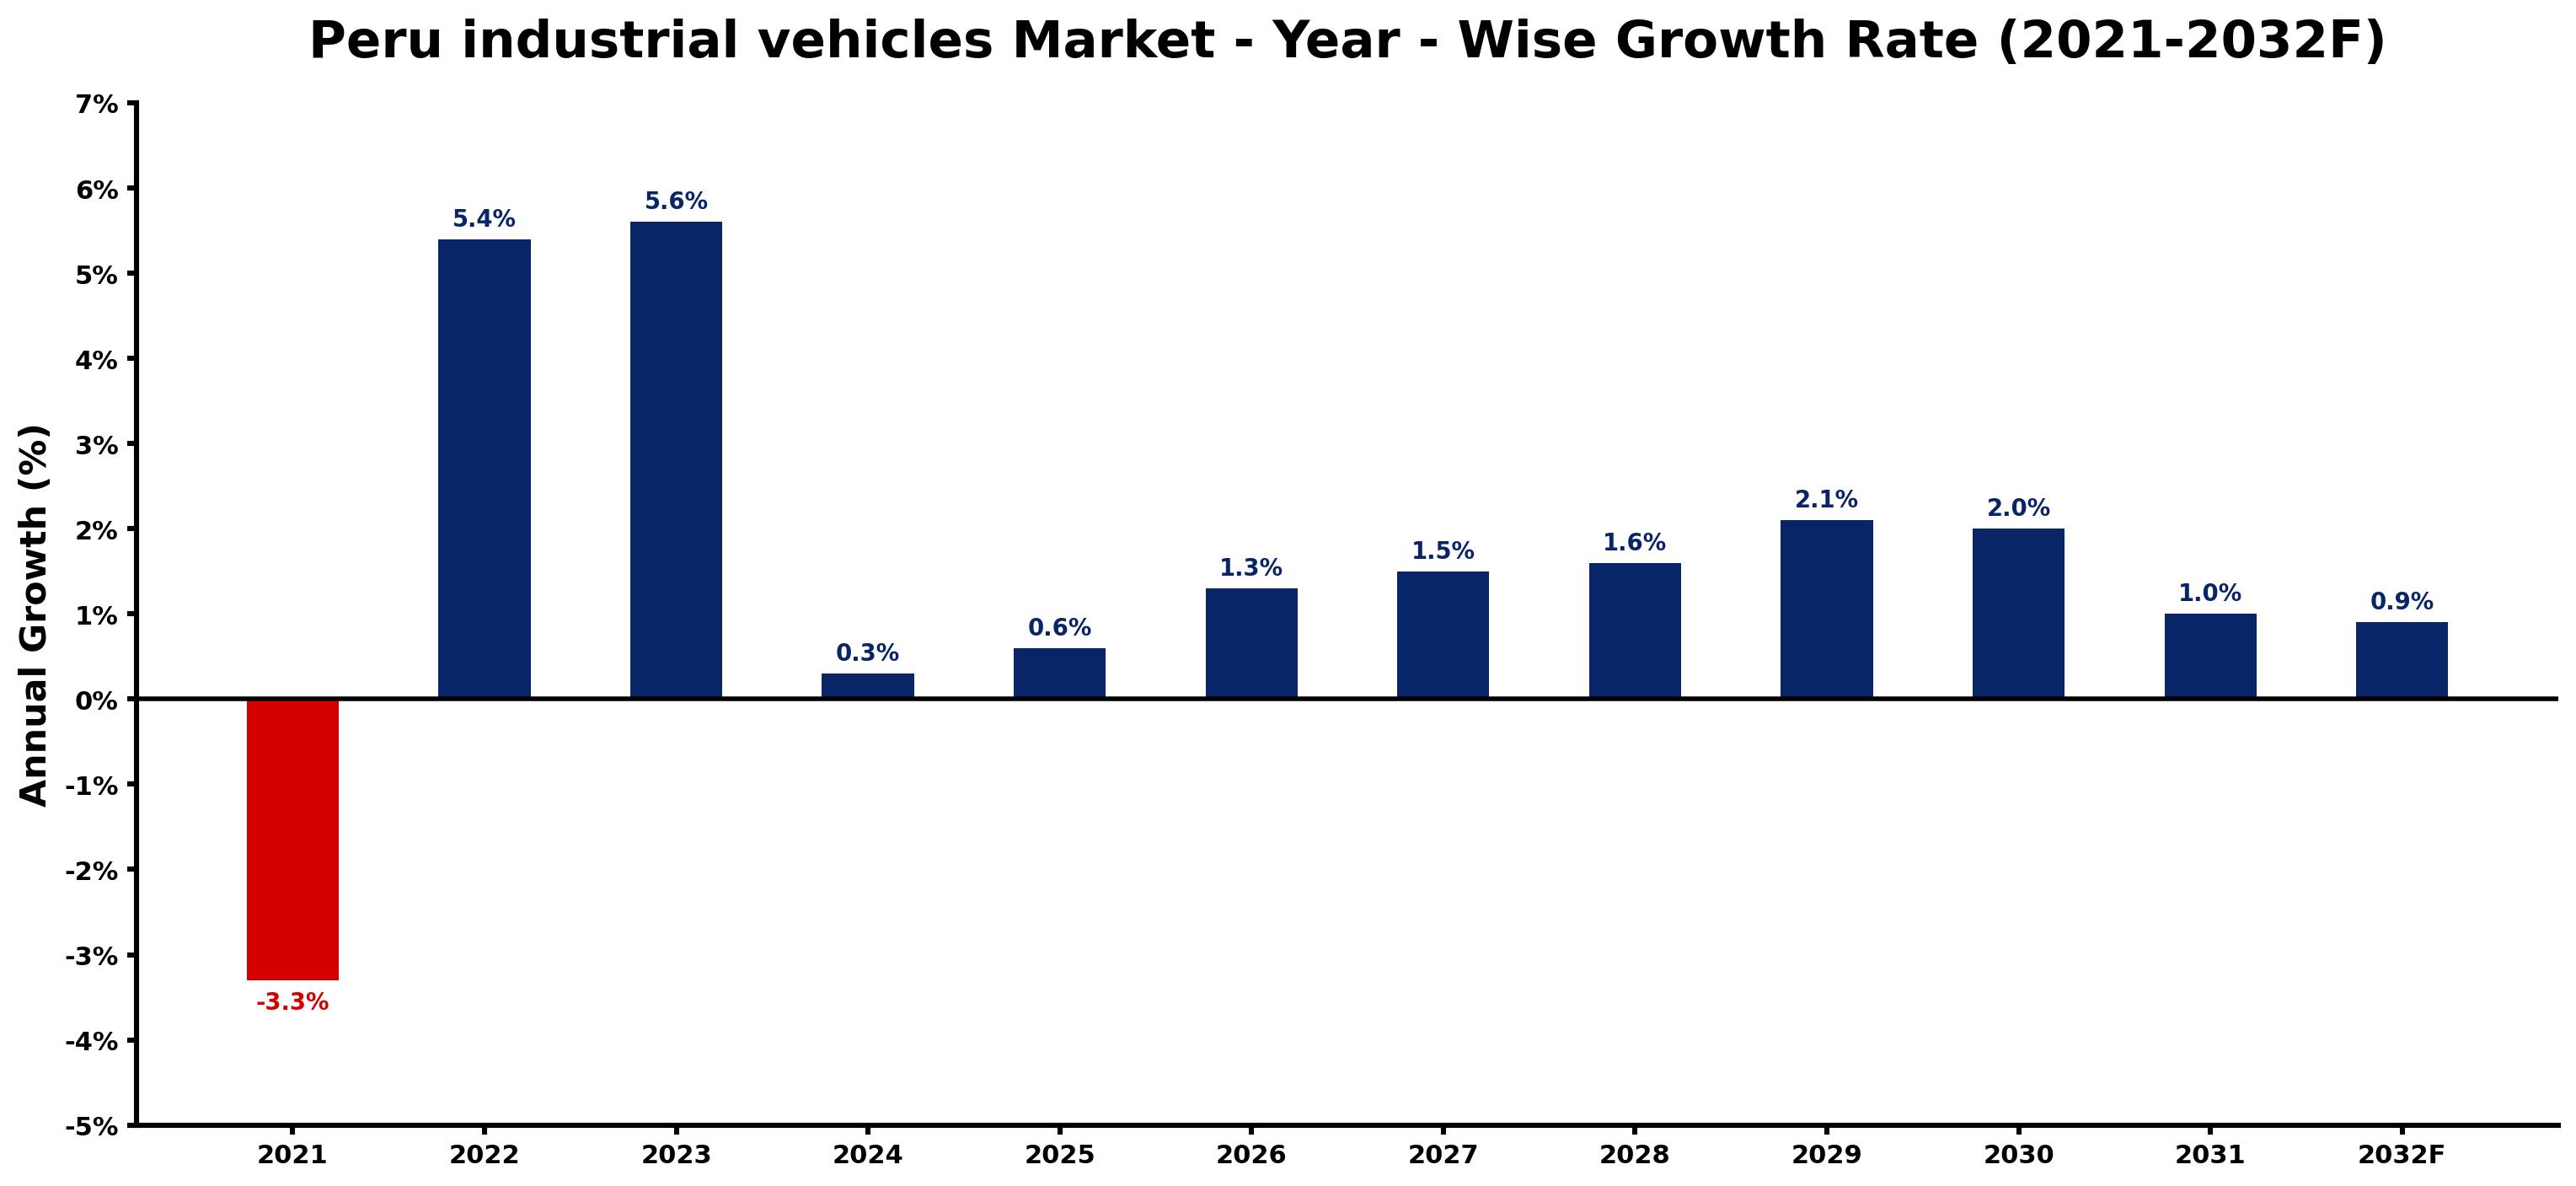
Peru industrial vehicles Market Growth Rate Analysis (2021-2032)
The Peru industrial vehicles market in the U.S. is navigating a complex landscape, reflecting an upward trend in demand following a challenging drop of -3.3% in 2021. This negative shift was primarily influenced by supply chain disruptions and diminished consumer demand during the pandemic. However, recovery ensued with notable growth of 5.4% in 2022 and 5.6% in 2023, driven by increased investments in infrastructure projects and a push towards sustainable energy solutions. As the years progress, growth rates are expected to stabilize, with 1.3% in 2026 and 2.1% by 2029, reflecting ongoing digitalization and advancements in industrial technology that cater to evolving market needs.
Peru industrial vehicles Market Year-wise Growth Rate and Key Drivers
This graph highlights how the Peru industrial vehicles Market has steadily grown over the past five years, supported by major growth factors.
The table below presents the year wise growth rates along with the key drivers influencing the market
| Year | Growth Rate | Major Drivers |
| 2021 | -3.3% | Supply chain disruptions due to the pandemic hindered production capacity, negatively impacting the industrial vehicles market. |
| 2022 | 5.4% | Infrastructure investments pour into urban development, driving vehicle needs in key sectors. |
| 2023 | 5.6% | Renewable energy projects prompt demand for specialized vehicles in logistics and transportation. |
| 2024 | 0.3% | Mining sector expansion fuels demand for heavy-duty trucks and support vehicles. |
| 2025 | 0.6% | Local manufacturing efforts necessitate increased transport solutions, enhancing industrial vehicle sales. |
| 2026 | 1.3% | Technological upgrades in fleet management systems improve operational efficiency for businesses. |
| 2027 | 1.5% | Emerging logistics hubs in coastal cities require modern vehicles for enhanced distribution. |
| 2028 | 1.6% | Urbanization trends create demand for versatile vehicles suited for city construction projects. |
| 2029 | 2.1% | Economic diversification encourages industrial companies to modernize fleets for competitiveness. |
| 2030 | 2.0% | Sustainability goals lead organizations to invest in electric and hybrid industrial vehicles. |
| 2031 | 1.0% | Partnerships with international firms introduce advanced vehicle technologies into the market. |
| 2032 | 0.9% | Robust economic growth supports a thriving market for diverse industrial vehicle offerings. |
Note - Market size estimations and growth projections presented in this report are based on 6Wresearch's advanced forecasting approach, validated with industry datasets as of June 2026.
Peru industrial vehicles Market Synopsis
The Peru industrial vehicles Market is projected to reach 1.3% and witness significant growth during the forecast period (2026-2032). This growth is primarily driven by the rapid expansion of the industrial sector, particularly in mining and construction, which has necessitated the demand for efficient material handling equipment. The market includes a diverse array of industrial vehicles such as forklifts, cranes, and excavators that cater to varying industrial requirements.
Peru industrial vehicles Market Growth Drivers
The growth of the Peru industrial vehicles market is influenced by several critical factors:
- Increasing demand for industrial vehicles in the mining sector, which requires heavy-duty machinery for excavation, material handling, and transportation.
- Growing infrastructure development projects across the country, particularly in urban areas, boosting the need for construction-related vehicles.
- The rise in agricultural activities, leading to a demand for specialized vehicles that aid in farming operations.
- Innovations in vehicle technology aimed at enhancing efficiency, safety, and productivity within industrial operations.
- Shifting preferences towards electric and hybrid vehicles, driven by environmental sustainability and emissions reduction initiatives.
Peru industrial vehicles Market Trends and Opportunities
Current trends in the Peru industrial vehicles market highlight notable shifts and opportunities:
- The transition towards cleaner energy sources is prompting companies to invest in electric and hybrid vehicle technologies, which align with global sustainability goals.
- Advanced automation technologies and telematics are increasingly integrated into industrial vehicles, improving operational efficiency and real-time data monitoring.
- There is a notable uptick in the demand for smaller, more maneuverable vehicles designed for urban environments, responding to the constraints of limited spaces.
- Investment opportunities are burgeoning in logistics, with rising demand for vehicles that support efficient transportation and distribution systems.
- The government's commitment to infrastructure improvements supports heightened demand for construction vehicles such as excavators and dump trucks.
Peru industrial vehicles Market Challenges and Restraints
Despite favorable growth prospects, the Peru industrial vehicles market faces several challenges:
- Economic instability and political uncertainty create an unpredictable business environment that can hinder investment decisions.
- Fluctuating currency exchange rates pose risks for international transactions and purchasing of foreign-manufactured vehicles.
- Accessibility to financing remains limited for businesses seeking to invest in necessary equipment, which can impede growth.
- Infrastructure deficiencies, including inadequate road networks, pose significant challenges for the logistics and operational efficiency of industrial vehicles.
- Increased competition from lower-cost imported vehicles may pressure domestic manufacturers to innovate and reduce prices.
Peru industrial vehicles Market Investment Opportunities
The potential for investment in the Peru industrial vehicles market is significant:
- The mining sector, with its continuous demand for heavy-duty equipment, offers fruitful opportunities for investment in advanced vehicles.
- Construction activities fueled by government initiatives pave the way for investments in construction machinery such as cranes and bulldozers.
- The agricultural sector's reliance on specialized vehicles highlights a niche investment opportunity in agricultural machinery.
- As logistics and transportation operations expand, there is an increasing need for reliable vehicles like trucks and trailers.
- Investing in technologies that enhance energy efficiency and reduce operational costs can lead to competitive advantages for market players.
Peru industrial vehicles Market Government Investment and Initiatives
Government policies significantly influence the Peru industrial vehicles market, focusing on promoting sustainability and technological advancement:
- Regulations have been put in place to encourage the adoption of cleaner, energy-efficient vehicles, particularly in the logistics and transportation sectors.
- The government offers incentives and tax breaks for companies investing in environmentally friendly vehicles, supporting the transition to greener alternatives.
- Public spending on infrastructure projects enhances the market environment for industrial vehicles by creating demand for construction equipment.
- Development plans aimed at improving transportation networks facilitate the movement of goods and materials, consequently boosting vehicle demand.
- Government initiatives that promote innovation and technology adoption align with global sustainability goals, shaping future market dynamics.
Peru industrial vehicles Market Latest Developments (May 2025 - June 2026)
Recent developments within the Peru industrial vehicles market reflect a dynamic industry landscape:
- There has been a notable increase in the integration of telematics and IoT technologies in vehicles to enhance operational efficiency and real-time data analysis.
- Electric and hybrid vehicle adoption is gaining traction among companies seeking to reduce their carbon footprint and comply with new regulations.
- The market has seen increased collaboration between manufacturers and technology firms to develop innovative vehicle solutions tailored to local needs.
- Infrastructure investments have accelerated, leading to heightened demand for construction vehicles, particularly in urban areas undergoing development.
- Awareness campaigns aimed at educating businesses on financing options for industrial vehicles have emerged, promoting investment in modern equipment.
Peru industrial vehicles Market - Key Attractiveness of the Report
- 10 Years of Market Numbers
- Historical Data Starting from 2022 to 2025
- Base Year: 2025
- Forecast Data until 2032
- Key Performance Indicators Impacting the Market
- Major Upcoming Developments and Projects
Key Highlights of the Report:
- Peru industrial vehicles Market Outlook
- Market Size of Peru industrial vehicles Market, 2025
- Forecast of Peru industrial vehicles Market, 2032F
- Historical Data and Forecast of Peru industrial vehicles Revenues & Volume for the Period 2022-2032F
- Peru industrial vehicles Market Trend Evolution
- Peru industrial vehicles Market Drivers and Challenges
- Peru industrial vehicles Price Trends
- Peru industrial vehicles Porter's Five Forces
- Peru industrial vehicles Industry Life Cycle
- Historical Data and Forecast of Peru industrial vehicles Market Revenues & Volume By Product Type for the Period 2022-2032F
- Historical Data and Forecast of Peru industrial vehicles Market Revenues & Volume By Forklift for the Period 2022-2032F
- Historical Data and Forecast of Peru industrial vehicles Market Revenues & Volume By Aisle Truck for the Period 2022-2032F
- Historical Data and Forecast of Peru industrial vehicles Market Revenues & Volume By Tow Tractor for the Period 2022-2032F
- Historical Data and Forecast of Peru industrial vehicles Market Revenues & Volume By Container Handler for the Period 2022-2032F
- Historical Data and Forecast of Peru industrial vehicles Market Revenues & Volume By Drive Type for the Period 2022-2032F
- Historical Data and Forecast of Peru industrial vehicles Market Revenues & Volume By Internal Combustion Engine for the Period 2022-2032F
- Historical Data and Forecast of Peru industrial vehicles Market Revenues & Volume By Battery-Operated for the Period 2022-2032F
- Historical Data and Forecast of Peru industrial vehicles Market Revenues & Volume By Gas-Powered for the Period 2022-2032F
- Historical Data and Forecast of Peru industrial vehicles Market Revenues & Volume By Application for the Period 2022-2032F
- Historical Data and Forecast of Peru industrial vehicles Market Revenues & Volume By Industrial for the Period 2022-2032F
- Historical Data and Forecast of Peru industrial vehicles Market Revenues & Volume By Cargo for the Period 2022-2032F
- Peru industrial vehicles Import Export Trade Statistics
- Market Opportunity Assessment By Product Type
- Market Opportunity Assessment By Drive Type
- Market Opportunity Assessment By Application
- Peru industrial vehicles Top Companies Market Share
- Peru industrial vehicles Competitive Benchmarking By Technical and Operational Parameters
- Peru industrial vehicles Company Profiles
- Peru industrial vehicles Key Strategic Recommendations
Frequently Asked Questions About the Market Study (FAQs):
Key factors include the expansion of the mining and construction sectors, increased demand for efficient material handling, and government support for sustainable vehicle technologies.
The market contends with economic fluctuations, limited access to financing, infrastructure deficiencies, and competition from imported vehicles.
Opportunities are present in sectors such as mining, agriculture, logistics, and construction, driven by ongoing infrastructure projects and technological advancements.
The government promotes sustainability through regulations and incentives aimed at encouraging the adoption of electric and hybrid vehicles, enhancing the market's growth potential.
6Wresearch actively monitors the Peru industrial vehicles Market and publishes its comprehensive annual report, highlighting emerging trends, growth drivers, revenue analysis, and forecast outlook. Our insights help businesses to make data-backed strategic decisions with ongoing market dynamics. Our analysts track relevent industries related to the Peru industrial vehicles Market, allowing our clients with actionable intelligence and reliable forecasts tailored to emerging regional needs.
Yes, we provide customisation as per your requirements. To learn more, feel free to contact us on sales@6wresearch.com
1 Executive Summary |
2 Introduction |
2.1 Key Highlights of the Report |
2.2 Report Description |
2.3 Market Scope & Segmentation |
2.4 Research Methodology |
2.5 Assumptions |
3 Peru industrial vehicles Market Overview |
3.1 Peru Country Macro Economic Indicators |
3.2 Peru industrial vehicles Market Revenues & Volume, 2022 & 2032F |
3.3 Peru industrial vehicles Market - Industry Life Cycle |
3.4 Peru industrial vehicles Market - Porter's Five Forces |
3.5 Peru industrial vehicles Market Revenues & Volume Share, By Product Type, 2022 & 2032F |
3.6 Peru industrial vehicles Market Revenues & Volume Share, By Drive Type, 2022 & 2032F |
3.7 Peru industrial vehicles Market Revenues & Volume Share, By Application, 2022 & 2032F |
4 Peru industrial vehicles Market Dynamics |
4.1 Impact Analysis |
4.2 Market Drivers |
4.2.1 Growth in the mining sector leading to increased demand for industrial vehicles |
4.2.2 Expansion of construction projects driving the need for industrial vehicles |
4.2.3 Government initiatives promoting industrial development and infrastructure projects |
4.3 Market Restraints |
4.3.1 Economic instability affecting investment in industrial vehicles |
4.3.2 High import taxes impacting the cost of industrial vehicles |
4.3.3 Limited availability of skilled labor for operating and maintaining industrial vehicles |
5 Peru industrial vehicles Market Trends |
6 Peru industrial vehicles Market, By Types |
6.1 Peru industrial vehicles Market, By Product Type |
6.1.1 Overview and Analysis |
6.1.2 Peru industrial vehicles Market Revenues & Volume, By Product Type, 2022-2032F |
6.1.3 Peru industrial vehicles Market Revenues & Volume, By Forklift, 2022-2032F |
6.1.4 Peru industrial vehicles Market Revenues & Volume, By Aisle Truck, 2022-2032F |
6.1.5 Peru industrial vehicles Market Revenues & Volume, By Tow Tractor, 2022-2032F |
6.1.6 Peru industrial vehicles Market Revenues & Volume, By Container Handler, 2022-2032F |
6.2 Peru industrial vehicles Market, By Drive Type |
6.2.1 Overview and Analysis |
6.2.2 Peru industrial vehicles Market Revenues & Volume, By Internal Combustion Engine, 2022-2032F |
6.2.3 Peru industrial vehicles Market Revenues & Volume, By Battery-Operated, 2022-2032F |
6.2.4 Peru industrial vehicles Market Revenues & Volume, By Gas-Powered, 2022-2032F |
6.3 Peru industrial vehicles Market, By Application |
6.3.1 Overview and Analysis |
6.3.2 Peru industrial vehicles Market Revenues & Volume, By Industrial , 2022-2032F |
6.3.3 Peru industrial vehicles Market Revenues & Volume, By Cargo, 2022-2032F |
7 Peru industrial vehicles Market Import-Export Trade Statistics |
7.1 Peru industrial vehicles Market Export to Major Countries |
7.2 Peru industrial vehicles Market Imports from Major Countries |
8 Peru industrial vehicles Market Key Performance Indicators |
8.1 Average age of industrial vehicle fleet in Peru |
8.2 Number of infrastructure projects in the pipeline |
8.3 Utilization rate of industrial vehicles in key sectors |
8.4 Adoption rate of advanced technology in industrial vehicles |
8.5 Number of training programs for industrial vehicle operators in Peru |
9 Peru industrial vehicles Market - Opportunity Assessment |
9.1 Peru industrial vehicles Market Opportunity Assessment, By Product Type, 2022 & 2032F |
9.2 Peru industrial vehicles Market Opportunity Assessment, By Drive Type, 2022 & 2032F |
9.3 Peru industrial vehicles Market Opportunity Assessment, By Application, 2022 & 2032F |
10 Peru industrial vehicles Market - Competitive Landscape |
10.1 Peru industrial vehicles Market Revenue Share, By Companies, 2025 |
10.2 Peru industrial vehicles Market Competitive Benchmarking, By Operating and Technical Parameters |
11 Company Profiles |
12 Recommendations |
13 Disclaimer |
Global Go To Market Strategy - 2030
Export potential enables firms to identify high-growth global markets with greater confidence by combining advanced trade intelligence with a structured quantitative methodology. The framework analyzes emerging demand trends and country-level import patterns while integrating macroeconomic and trade datasets such as GDP and population forecasts, bilateral import–export flows, tariff structures, elasticity differentials between developed and developing economies, geographic distance, and import demand projections. Using weighted trade values from 2020–2024 as the base period to project country-to-country export potential for 2030, these inputs are operationalized through calculated drivers such as gravity model parameters, tariff impact factors, and projected GDP per-capita growth. Through an analysis of hidden potentials, demand hotspots, and market conditions that are most favorable to success, this method enables firms to focus on target countries, maximize returns, and global expansion with data, backed by accuracy.
By factoring in the projected importer demand gap that is currently unmet and could be potential opportunity, it identifies the potential for the Exporter (Country) among 190 countries, against the general trade analysis, which identifies the biggest importer or exporter.
To discover high-growth global markets and optimize your business strategy:
Click Here
Pricing
- Single User License$ 1,995
- Department License$ 2,400
- Site License$ 3,120
- Global License$ 3,795

Leadership Perspectives from Industry Events
Search
Thought Leadership and Analyst Meet


Our Clients
6WResearch In News
- India Air Conditioner Market Set for Strong Rebound in 2026 After Weather-Led Correction and GST-Driven Recovery: 6Wresearch
- ADAS in India: How Automatic Emergency Braking, Blind Spot Detection & Driver Monitoring are Transforming Road Safety
- Doha a strategic location for EV manufacturing hub: IPA Qatar
- Demand for luxury TVs surging in the GCC, says Samsung
- Empowering Growth: The Thriving Journey of Bangladesh’s Cable Industry
- Demand for luxury TVs surging in the GCC, says Samsung
Latest Reports
- Poland Fire Protection Systems Market (2026-2032)
- Cape Verde Portable Hand-Thrown Extinguisher Market (2026-2032)
- Canada Portable Hand-Thrown Extinguisher Market (2026-2032)
- Cameroon Portable Hand-Thrown Extinguisher Market (2026-2032)
- Burundi Portable Hand-Thrown Extinguisher Market (2026-2032)
- Burkina Faso Portable Hand-Thrown Extinguisher Market (2026-2032)
- Bulgaria Portable Hand-Thrown Extinguisher Market (2026-2032)
- Brunei Portable Hand-Thrown Extinguisher Market (2026-2032)
- Botswana Portable Hand-Thrown Extinguisher Market (2026-2032)
- Bosnia and Herzegovina Portable Hand-Thrown Extinguisher Market (2026-2032)
Industry Events and Analyst Meet

HIMTEX 2026

India Refining Summit 2026

India EV Show 2026

EV tech India Expo 2026

Auto Tech Asia 2026
Whitepaper
- Middle East & Africa Commercial Security Market Click here to view more.
- Middle East & Africa Fire Safety Systems & Equipment Market Click here to view more.
- GCC Drone Market Click here to view more.
- Middle East Lighting Fixture Market Click here to view more.
- GCC Physical & Perimeter Security Market Click here to view more.