Peru Personal Care Active Ingredients Market (2026-2032) Outlook | Growth, Companies, Analysis, Forecast, Value, Industry, Size, Revenue, Trends & Share
Market Forecast By Products (Hair Care, Skin Care, Bath and Shower, Oral Care, Men™s Grooming, Other Personal Care Products), By Gender (Women, Men), By Distribution Channel (Direct Selling, Hypermarkets and Retail Chains, E-Commerce, Specialty Stores, Other Distribution Channels) And Competitive Landscape
| Product Code: ETC069625 | Publication Date: Jun 2021 | Updated Date: Jun 2026 | Product Type: Report | |
| Publisher: 6Wresearch | Author: Bhawna Singh | No. of Pages: 70 | No. of Figures: 35 | No. of Tables: 5 |
Peru Personal Care Active Ingredients Market Size, Share & Growth Rate
The Peru Personal Care Active Ingredients Market was estimated at USD 597 Million in 2025 and is projected to reach USD 859 Million by 2032, growing at a CAGR of 5.3% from 2026 to 2032. This robust growth trajectory is primarily fueled by rising consumer awareness about personal care benefits and a burgeoning middle-class population eager to invest in high-quality grooming products. Additionally, the increasing preference for natural and organic ingredients further catalyzes market expansion as consumers seek safer, more effective skincare solutions.
Peru Personal Care Active Ingredients Market Growth Rate Analysis (2021-2032)
The Peru Personal Care Active Ingredients Market has experienced steady growth, beginning with a 5.9% increase in 2021 and progressing to an anticipated 6.5% by 2032. This consistent expansion, peaking at 6.4% in 2025 through 2027, is largely driven by rising consumer awareness around health and wellness, prompting demand for innovative and natural formulations. Furthermore, technological advancements in ingredient sourcing and production have enhanced efficiency, while investments from international players have bolstered local infrastructure. Despite slight fluctuations, such as a dip to 6.0% in 2024, the market has remained stable, benefiting from ongoing digitalization trends that shape consumer preferences and industry standards.
Peru Personal Care Active Ingredients Market Year-wise Growth Rate and Key Drivers
This graph highlights how the Peru Personal Care Active Ingredients Market has steadily grown over the past five years, supported by major growth factors.
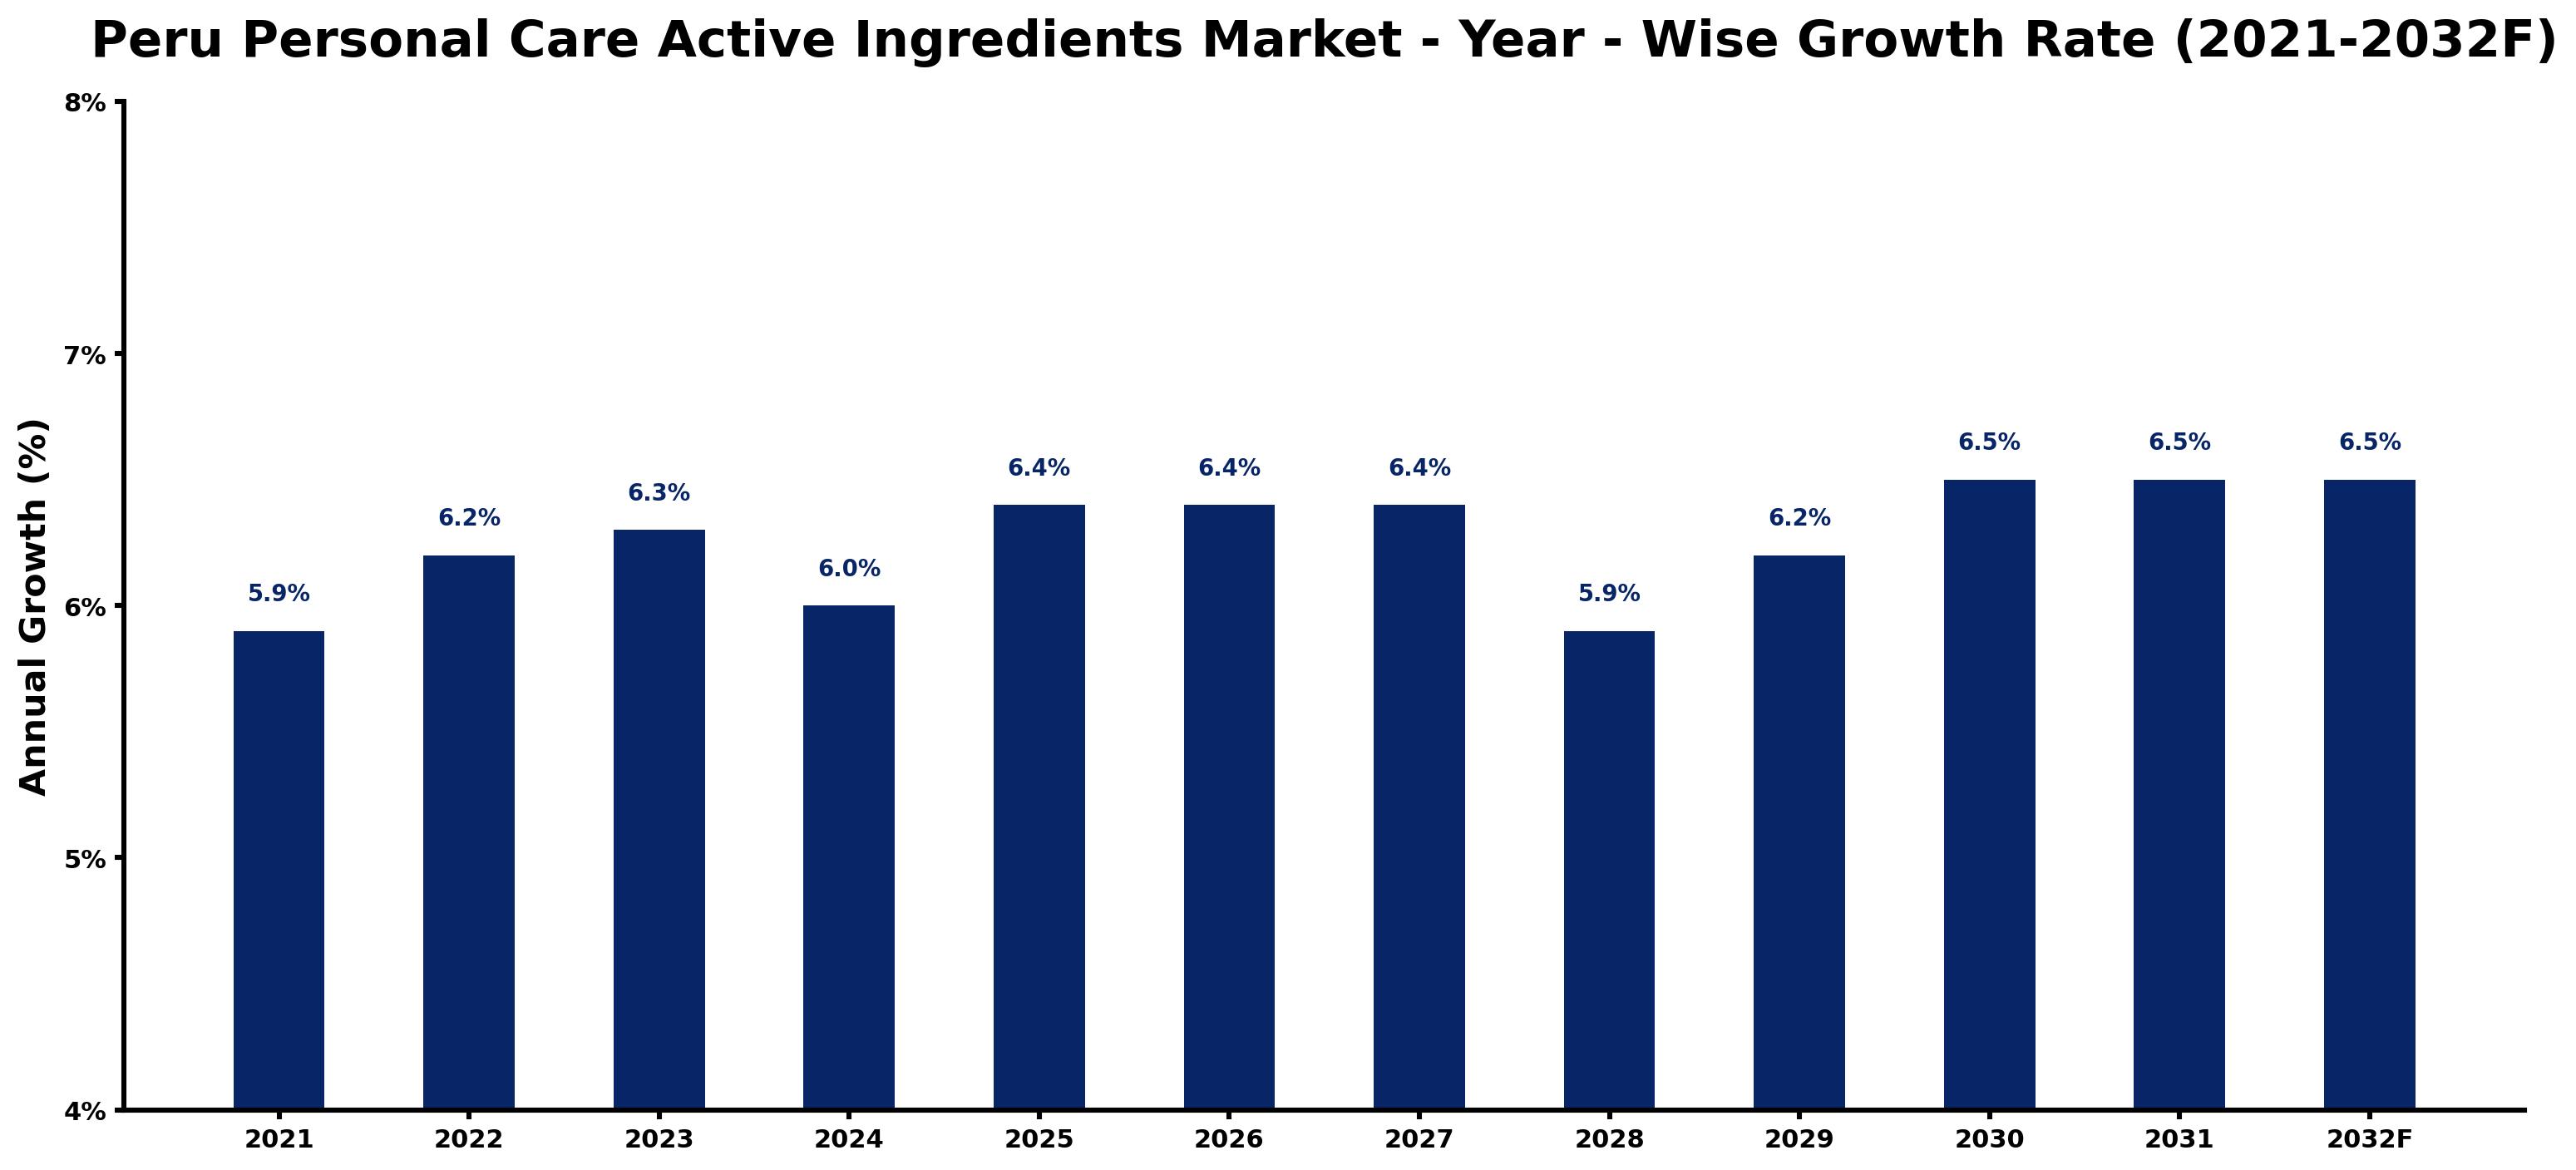
The table below presents the year‑wise growth rates along with the key drivers influencing the market
| Year | Growth Rate | Major Drivers |
| 2021 | 5.9% | Government infrastructure modernization initiatives |
| 2022 | 6.2% | Expansion of commercial construction activities |
| 2023 | 6.3% | Rapid growth in telecom and data center sectors |
| 2024 | 6.0% | Growing renewable energy integration projects |
| 2025 | 6.4% | Expansion of transportation and logistics networks |
| 2026 | 6.4% | Expansion of commercial construction activities |
| 2027 | 6.4% | Increasing adoption of advanced technologies |
| 2028 | 5.9% | Rising electricity demand across industries |
| 2029 | 6.2% | Increasing industrial automation investments |
| 2030 | 6.5% | Growing urbanization and commercial development |
| 2031 | 6.5% | Rising electricity demand across industries |
| 2032 | 6.5% | Government infrastructure modernization initiatives |
Note - Market size estimations and growth projections presented in this report are based on 6Wresearch’s advanced forecasting approach, validated with industry datasets as of June 2026.
Peru Personal Care Active Ingredients Market Synopsis
In Peru, there's a growing demand for active ingredients that offer multifunctional benefits, such as anti-aging, skin brightening, and environmental protection. Consumers are increasingly drawn to products containing botanical extracts and vitamins that promote skin health and wellness.
The shift towards clean beauty is also noteworthy, as Peruvians show a preference for personal care products that feature eco-friendly and ethically sourced ingredients. This trend has encouraged local manufacturers to innovate and adapt their product lines to meet these evolving consumer preferences.
Peru Personal Care Active Ingredients Market Key Takeaways
- The market is shifting towards natural and organic ingredients, reflecting a broader trend in clean beauty.
- Consumer interest in multifunctional active ingredients is rising, driving demand for more effective formulations.
- Local manufacturers are focusing on innovation to distinguish their products in a competitive landscape.
- Regulatory policies aim to ensure product safety, impacting ingredient sourcing and marketing strategies.
- Investment opportunities abound, particularly in companies committed to sustainable practices and product development.
Evaluation of Restraints in Peru Personal Care Active Ingredients Market
Despite the positive outlook, the Peru Personal Care Active Ingredients Market is not without its challenges. One significant restraint is the increasing competition from international players offering lower-priced alternatives, which can pressure local manufacturers. Furthermore, stringent regulations governing the use of specific active ingredients impose additional compliance costs, affecting product development timelines. Fluctuations in raw material prices and currency exchange rates also pose risks to production costs, making strategic planning essential for sustained growth in this evolving market.
Peru Personal Care Active Ingredients Market Trends
Current trends in the Peru Personal Care Active Ingredients Market emphasize a strong consumer shift towards natural and sustainable products. Ingredients derived from plants, such as botanical extracts and natural oils, are increasingly popular, driven by consumer perceptions of safety and efficacy. Moreover, there’s a growing interest in active ingredients that deliver multiple benefits, such as anti-aging, skin brightening, and pollution protection, further shaping product development and marketing strategies in this space.
Peru Personal Care Active Ingredients Market Opportunities
The landscape of the Peru Personal Care Active Ingredients Market is ripe with investment opportunities, particularly as consumers pivot towards products that embody health, wellness, and sustainability. Companies developing innovative, high-performance active ingredients stand to gain significantly, especially those that align with clean beauty principles. Additionally, the demand for premium personal care products among the growing middle-class population presents further avenues for growth, highlighting the potential for lucrative investments in this sector.
Government Initiatives in the Peru Personal Care Active Ingredients Market
Government policies in Peru play a crucial role in the Personal Care Active Ingredients Market by ensuring the safety and efficacy of products. The National Institute of Health (INS) oversees the approval and registration of new active ingredients, protecting consumer health and fostering transparency. Furthermore, the Ministry of Health enforces labeling requirements and quality standards, ensuring that personal care products meet consumer expectations while maintaining compliance with regulatory frameworks. These initiatives not only enhance consumer confidence but also support the overall growth of the industry.
Future Insights of the Peru Personal Care Active Ingredients Market
Looking ahead, the Peru Personal Care Active Ingredients Market is poised for steady growth through 2026-2032. Factors such as rising consumer awareness about personal grooming, increasing disposable incomes, and a heightened focus on natural and organic ingredients will drive demand. Manufacturers are expected to continue innovating and refining product offerings to align with changing consumer preferences and regulatory standards, further solidifying their positions in this competitive marketplace.
Peru Personal Care Active Ingredients Market Latest Developments (May 2025 - June 2026)
Recent developments in the Peru Personal Care Active Ingredients Market indicate a significant push towards sustainability and innovation. Many manufacturers are investing in research and development to create new product formulations that not only meet consumer demands but also adhere to environmental and ethical standards. Collaborations between local suppliers and international brands are becoming more prevalent as companies seek to enhance their product offerings and market presence, reflecting a dynamic shift in the industry’s landscape.
Peru Personal Care Active Ingredients Market - Key Attractiveness of the Report
- 10 Years of Market Numbers
- Historical Data Starting from 2022 to 2025
- Base Year: 2025
- Forecast Data until 2032
- Key Performance Indicators Impacting the Market
- Major Upcoming Developments and Projects
Key Highlights of the Report:
- Peru Personal Care Active Ingredients Market Outlook
- Market Size of Peru Personal Care Active Ingredients Market, 2025
- Forecast of Peru Personal Care Active Ingredients Market, 2032
- Historical Data and Forecast of Peru Personal Care Active Ingredients Revenues & Volume for the Period 2022-2032F
- Peru Personal Care Active Ingredients Market Trend Evolution
- Peru Personal Care Active Ingredients Market Drivers and Challenges
- Peru Personal Care Active Ingredients Price Trends
- Peru Personal Care Active Ingredients Porter's Five Forces
- Peru Personal Care Active Ingredients Industry Life Cycle
- Historical Data and Forecast of Peru Personal Care Active Ingredients Market Revenues & Volume By Products for the Period 2022-2032F
- Historical Data and Forecast of Peru Personal Care Active Ingredients Market Revenues & Volume By Hair Care for the Period 2022-2032F
- Historical Data and Forecast of Peru Personal Care Active Ingredients Market Revenues & Volume By Skin Care for the Period 2022-2032F
- Historical Data and Forecast of Peru Personal Care Active Ingredients Market Revenues & Volume By Bath and Shower for the Period 2022-2032F
- Historical Data and Forecast of Peru Personal Care Active Ingredients Market Revenues & Volume By Oral Care for the Period 2022-2032F
- Historical Data and Forecast of Peru Personal Care Active Ingredients Market Revenues & Volume By Men??s Grooming for the Period 2022-2032F
- Historical Data and Forecast of Peru Personal Care Active Ingredients Market Revenues & Volume By Other Personal Care Products for the Period 2022-2032F
- Historical Data and Forecast of Peru Personal Care Active Ingredients Market Revenues & Volume By Gender for the Period 2022-2032F
- Historical Data and Forecast of Peru Personal Care Active Ingredients Market Revenues & Volume By Women for the Period 2022-2032F
- Historical Data and Forecast of Peru Personal Care Active Ingredients Market Revenues & Volume By Men for the Period 2022-2032F
- Historical Data and Forecast of Peru Personal Care Active Ingredients Market Revenues & Volume By Distribution Channel for the Period 2022-2032F
- Historical Data and Forecast of Peru Personal Care Active Ingredients Market Revenues & Volume By Direct Selling for the Period 2022-2032F
- Historical Data and Forecast of Peru Personal Care Active Ingredients Market Revenues & Volume By Hypermarkets and Retail Chains for the Period 2022-2032F
- Historical Data and Forecast of Peru Personal Care Active Ingredients Market Revenues & Volume By E-Commerce for the Period 2022-2032F
- Historical Data and Forecast of Peru Personal Care Active Ingredients Market Revenues & Volume By Specialty Stores for the Period 2022-2032F
- Historical Data and Forecast of Peru Personal Care Active Ingredients Market Revenues & Volume By Other Distribution Channels for the Period 2022-2032F
- Peru Personal Care Active Ingredients Import Export Trade Statistics
- Market Opportunity Assessment By Products
- Market Opportunity Assessment By Gender
- Market Opportunity Assessment By Distribution Channel
- Peru Personal Care Active Ingredients Top Companies Market Share
- Peru Personal Care Active Ingredients Competitive Benchmarking By Technical and Operational Parameters
- Peru Personal Care Active Ingredients Company Profiles
- Peru Personal Care Active Ingredients Key Strategic Recommendations
Peru Personal Care Active Ingredients Market - Frequently Asked Questions
Key drivers include increasing consumer awareness of personal care products, a rising middle class with more disposable income, and a growing preference for natural and organic ingredients.
The market is estimated at USD 597 Million in 2025, projected to reach USD 859 Million by 2032, with a CAGR of 5.3% from 2026 to 2032.
Active ingredients like antioxidants, botanical extracts, and vitamins are particularly sought after due to their anti-aging and nourishing properties.
Regulations ensure product safety and efficacy, requiring companies to obtain approvals from the National Institute of Health, thereby influencing product development and marketing strategies.
Opportunities abound in companies developing sustainable and innovative products, especially those aligned with the growing trend for clean beauty and premium personal care.
6Wresearch actively monitors the Peru Personal Care Active Ingredients Market and publishes its comprehensive annual report, highlighting emerging trends, growth drivers, revenue analysis, and forecast outlook. Our insights help businesses to make data-backed strategic decisions with ongoing market dynamics. Our analysts track relevent industries related to the Peru Personal Care Active Ingredients Market, allowing our clients with actionable intelligence and reliable forecasts tailored to emerging regional needs.
Yes, we provide customisation as per your requirements. To learn more, feel free to contact us on sales@6wresearch.com
1 Executive Summary |
2 Introduction |
2.1 Key Highlights of the Report |
2.2 Report Description |
2.3 Market Scope & Segmentation |
2.4 Research Methodology |
2.5 Assumptions |
3 Peru Personal Care Active Ingredients Market Overview |
3.1 Peru Country Macro Economic Indicators |
3.2 Peru Personal Care Active Ingredients Market Revenues & Volume, 2022 & 2032F |
3.3 Peru Personal Care Active Ingredients Market - Industry Life Cycle |
3.4 Peru Personal Care Active Ingredients Market - Porter's Five Forces |
3.5 Peru Personal Care Active Ingredients Market Revenues & Volume Share, By Products, 2022 & 2032F |
3.6 Peru Personal Care Active Ingredients Market Revenues & Volume Share, By Gender, 2022 & 2032F |
3.7 Peru Personal Care Active Ingredients Market Revenues & Volume Share, By Distribution Channel, 2022 & 2032F |
4 Peru Personal Care Active Ingredients Market Dynamics |
4.1 Impact Analysis |
4.2 Market Drivers |
4.3 Market Restraints |
5 Peru Personal Care Active Ingredients Market Trends |
6 Peru Personal Care Active Ingredients Market, By Types |
6.1 Peru Personal Care Active Ingredients Market, By Products |
6.1.1 Overview and Analysis |
6.1.2 Peru Personal Care Active Ingredients Market Revenues & Volume, By Products, 2022-2032F |
6.1.3 Peru Personal Care Active Ingredients Market Revenues & Volume, By Hair Care, 2022-2032F |
6.1.4 Peru Personal Care Active Ingredients Market Revenues & Volume, By Skin Care, 2022-2032F |
6.1.5 Peru Personal Care Active Ingredients Market Revenues & Volume, By Bath and Shower, 2022-2032F |
6.1.6 Peru Personal Care Active Ingredients Market Revenues & Volume, By Oral Care, 2022-2032F |
6.1.7 Peru Personal Care Active Ingredients Market Revenues & Volume, By Men??s Grooming, 2022-2032F |
6.1.8 Peru Personal Care Active Ingredients Market Revenues & Volume, By Other Personal Care Products, 2022-2032F |
6.2 Peru Personal Care Active Ingredients Market, By Gender |
6.2.1 Overview and Analysis |
6.2.2 Peru Personal Care Active Ingredients Market Revenues & Volume, By Women, 2022-2032F |
6.2.3 Peru Personal Care Active Ingredients Market Revenues & Volume, By Men, 2022-2032F |
6.3 Peru Personal Care Active Ingredients Market, By Distribution Channel |
6.3.1 Overview and Analysis |
6.3.2 Peru Personal Care Active Ingredients Market Revenues & Volume, By Direct Selling, 2022-2032F |
6.3.3 Peru Personal Care Active Ingredients Market Revenues & Volume, By Hypermarkets and Retail Chains, 2022-2032F |
6.3.4 Peru Personal Care Active Ingredients Market Revenues & Volume, By E-Commerce, 2022-2032F |
6.3.5 Peru Personal Care Active Ingredients Market Revenues & Volume, By Specialty Stores, 2022-2032F |
6.3.6 Peru Personal Care Active Ingredients Market Revenues & Volume, By Other Distribution Channels, 2022-2032F |
7 Peru Personal Care Active Ingredients Market Import-Export Trade Statistics |
7.1 Peru Personal Care Active Ingredients Market Export to Major Countries |
7.2 Peru Personal Care Active Ingredients Market Imports from Major Countries |
8 Peru Personal Care Active Ingredients Market Key Performance Indicators |
9 Peru Personal Care Active Ingredients Market - Opportunity Assessment |
9.1 Peru Personal Care Active Ingredients Market Opportunity Assessment, By Products, 2022 & 2032F |
9.2 Peru Personal Care Active Ingredients Market Opportunity Assessment, By Gender, 2022 & 2032F |
9.3 Peru Personal Care Active Ingredients Market Opportunity Assessment, By Distribution Channel, 2022 & 2032F |
10 Peru Personal Care Active Ingredients Market - Competitive Landscape |
10.1 Peru Personal Care Active Ingredients Market Revenue Share, By Companies, 2025 |
10.2 Peru Personal Care Active Ingredients Market Competitive Benchmarking, By Operating and Technical Parameters |
11 Company Profiles |
12 Recommendations |
13 Disclaimer |
Global Go To Market Strategy - 2030
Export potential enables firms to identify high-growth global markets with greater confidence by combining advanced trade intelligence with a structured quantitative methodology. The framework analyzes emerging demand trends and country-level import patterns while integrating macroeconomic and trade datasets such as GDP and population forecasts, bilateral import–export flows, tariff structures, elasticity differentials between developed and developing economies, geographic distance, and import demand projections. Using weighted trade values from 2020–2024 as the base period to project country-to-country export potential for 2030, these inputs are operationalized through calculated drivers such as gravity model parameters, tariff impact factors, and projected GDP per-capita growth. Through an analysis of hidden potentials, demand hotspots, and market conditions that are most favorable to success, this method enables firms to focus on target countries, maximize returns, and global expansion with data, backed by accuracy.
By factoring in the projected importer demand gap that is currently unmet and could be potential opportunity, it identifies the potential for the Exporter (Country) among 190 countries, against the general trade analysis, which identifies the biggest importer or exporter.
To discover high-growth global markets and optimize your business strategy:
Click Here
Pricing
- Single User License$ 1,995
- Department License$ 2,400
- Site License$ 3,120
- Global License$ 3,795

Leadership Perspectives from Industry Events
Search
Thought Leadership and Analyst Meet


Our Clients
6WResearch In News
- India Air Conditioner Market Set for Strong Rebound in 2026 After Weather-Led Correction and GST-Driven Recovery: 6Wresearch
- ADAS in India: How Automatic Emergency Braking, Blind Spot Detection & Driver Monitoring are Transforming Road Safety
- Doha a strategic location for EV manufacturing hub: IPA Qatar
- Demand for luxury TVs surging in the GCC, says Samsung
- Empowering Growth: The Thriving Journey of Bangladesh’s Cable Industry
- Demand for luxury TVs surging in the GCC, says Samsung
Latest Reports
- Poland Fire Protection Systems Market (2026-2032)
- Cape Verde Portable Hand-Thrown Extinguisher Market (2026-2032)
- Canada Portable Hand-Thrown Extinguisher Market (2026-2032)
- Cameroon Portable Hand-Thrown Extinguisher Market (2026-2032)
- Burundi Portable Hand-Thrown Extinguisher Market (2026-2032)
- Burkina Faso Portable Hand-Thrown Extinguisher Market (2026-2032)
- Bulgaria Portable Hand-Thrown Extinguisher Market (2026-2032)
- Brunei Portable Hand-Thrown Extinguisher Market (2026-2032)
- Botswana Portable Hand-Thrown Extinguisher Market (2026-2032)
- Bosnia and Herzegovina Portable Hand-Thrown Extinguisher Market (2026-2032)
Industry Events and Analyst Meet

HIMTEX 2026

India Refining Summit 2026

India EV Show 2026

EV tech India Expo 2026

Auto Tech Asia 2026
Whitepaper
- Middle East & Africa Commercial Security Market Click here to view more.
- Middle East & Africa Fire Safety Systems & Equipment Market Click here to view more.
- GCC Drone Market Click here to view more.
- Middle East Lighting Fixture Market Click here to view more.
- GCC Physical & Perimeter Security Market Click here to view more.