Peru Underground Utility Mapping Market Size & Growth Rate (2026-2032)
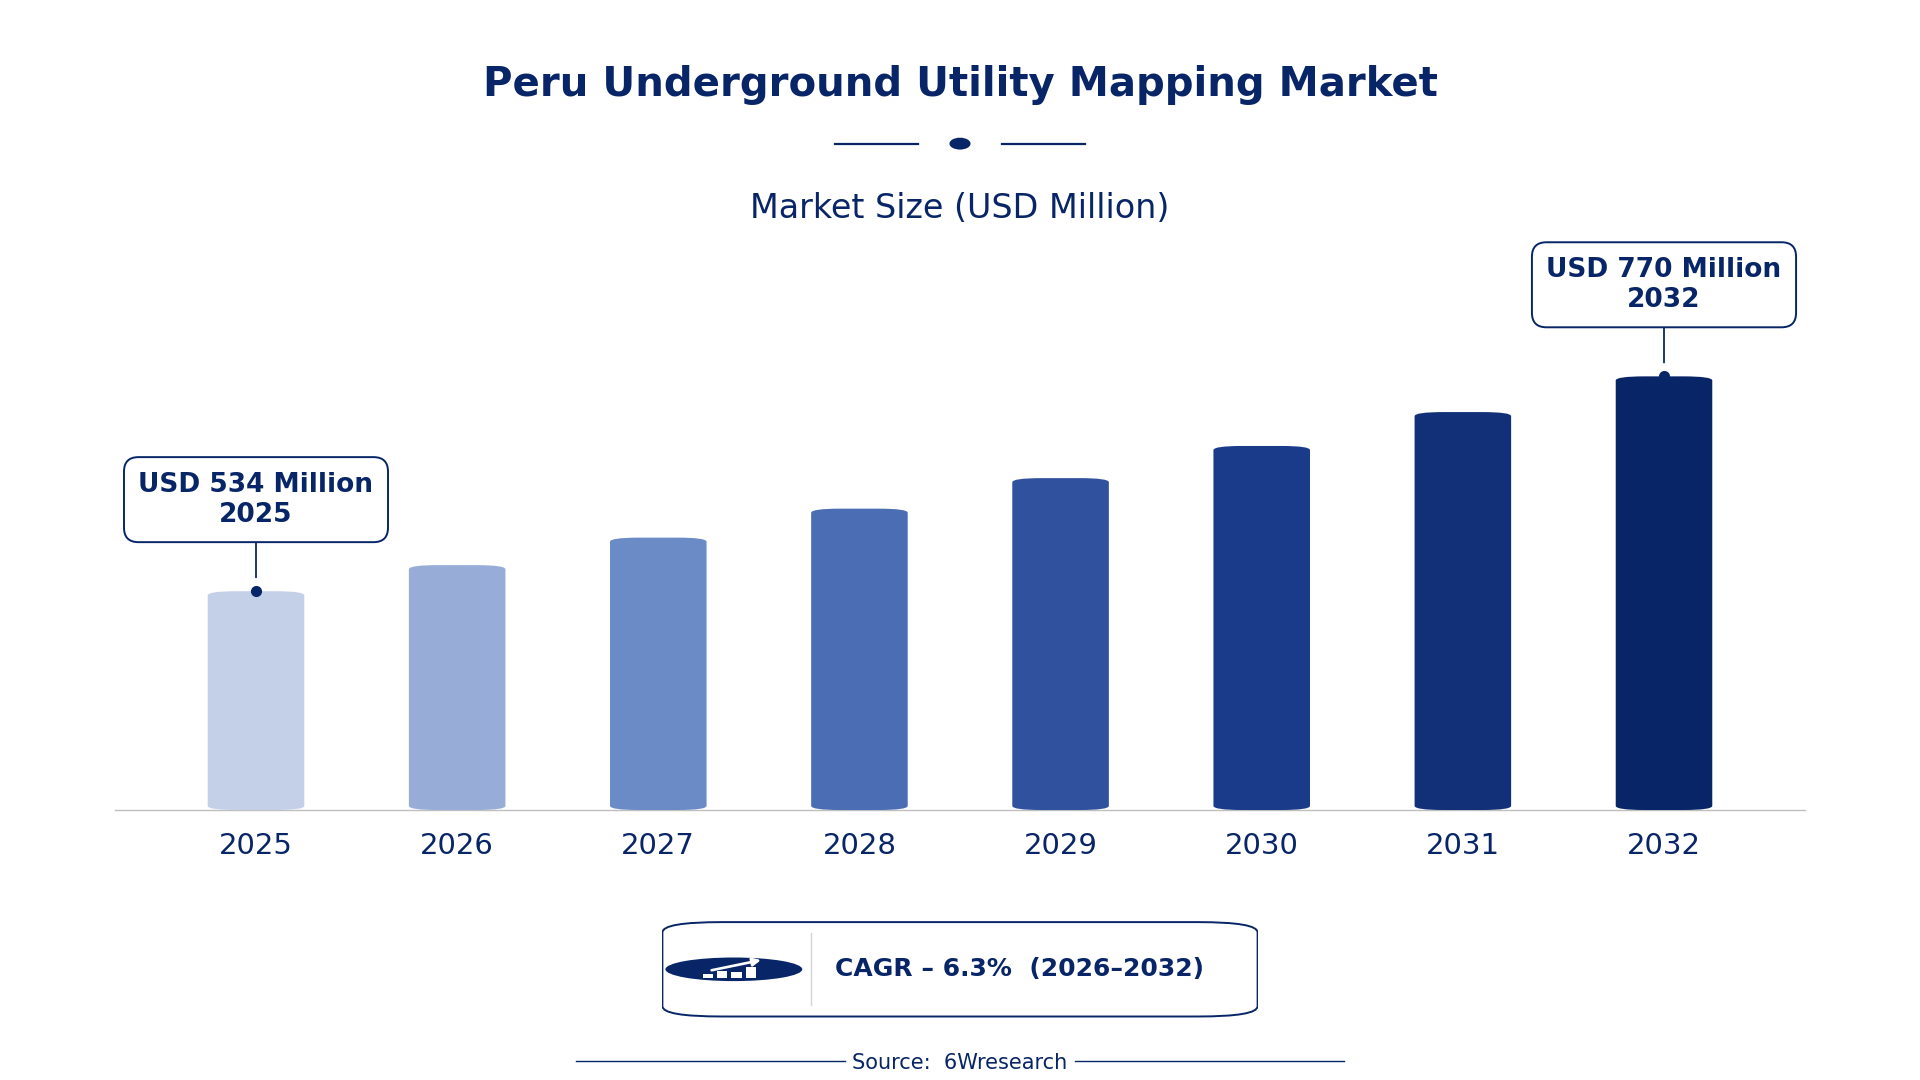
The Peru Underground Utility Mapping Market was estimated at USD 534 Million in 2025 and is projected to reach USD 770 Million by 2032, growing at a CAGR of 6.3% from 2026 to 2032.
Peru Underground Utility Mapping Market Synopsis
The primary force shaping the Peru Underground Utility Mapping Market is the increasing infrastructure development across the country. Government initiatives focusing on utility management are driving the demand for accurate mapping services, as the construction sector seeks to mitigate risks associated with underground utilities.
Advanced technologies such as Ground Penetrating Radar (GPR) and Geographic Information Systems (GIS) are becoming essential tools for utility mapping. As these technologies gain traction, they enable companies to deliver precise mapping solutions that enhance safety and efficiency in excavation practices.
Peru Underground Utility Mapping Market Year-wise Growth Rate and Key Drivers
This graph illustrates the annual growth rates of the Peru Underground Utility Mapping Market from 2021 to 2032, highlighting a steady upward trajectory and projected expansion over the forecast period.
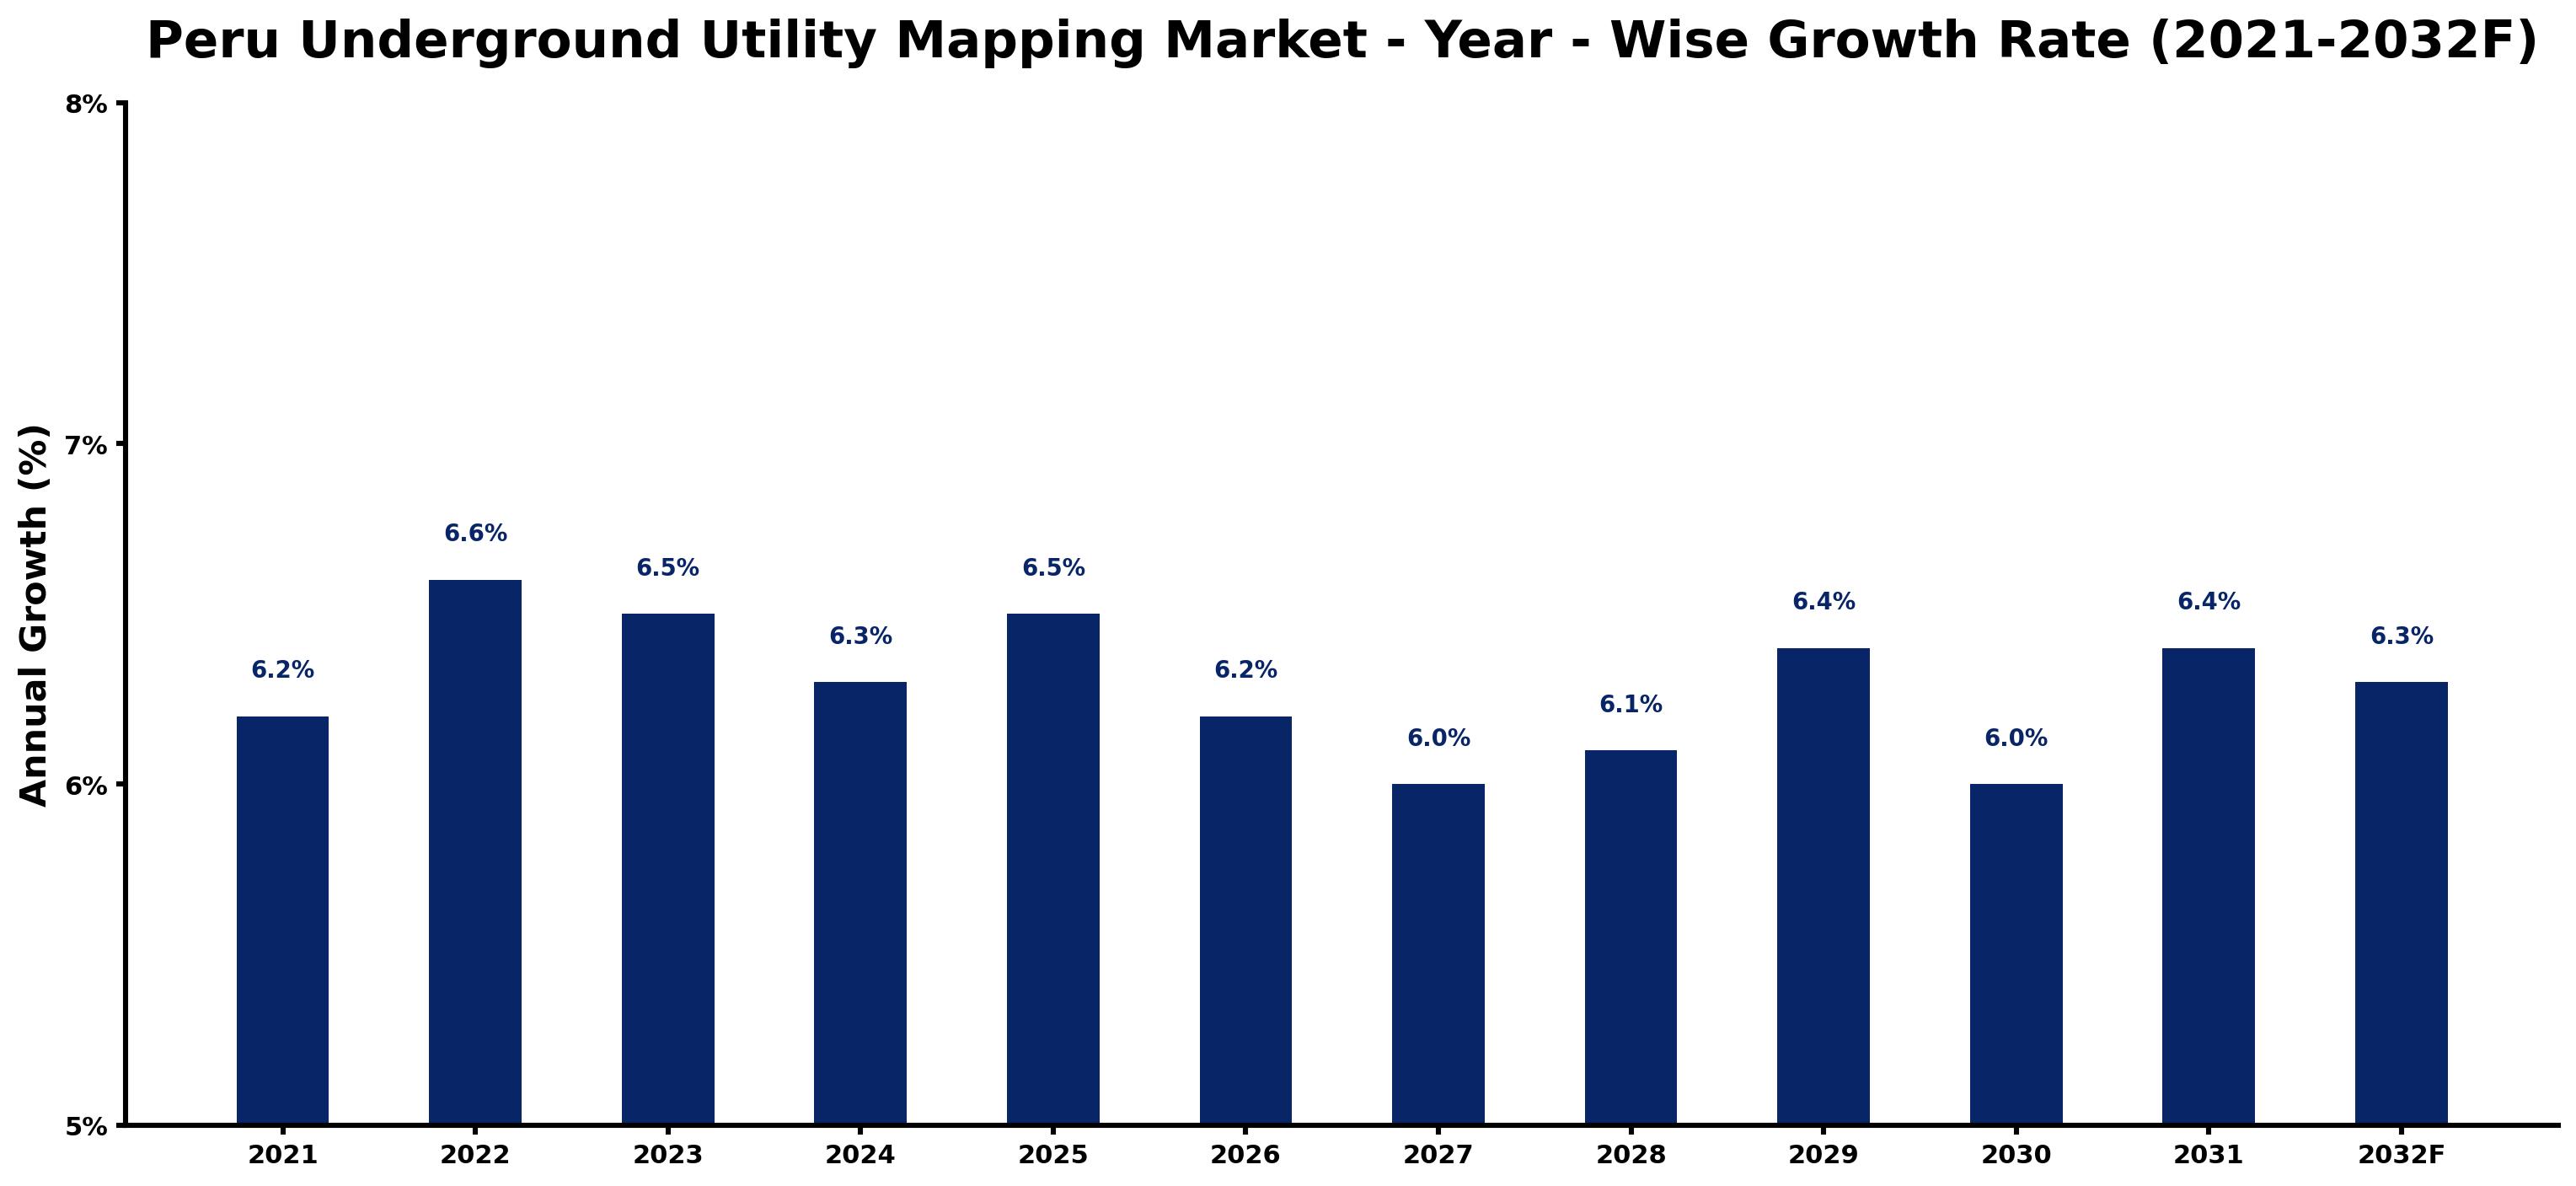
The table below presents the year‑wise growth rates along with the key drivers influencing the market
| Year | Growth Rate | Major Drivers |
| 2021 | 6.2% | Government regulations promoting utility infrastructure transparency. |
| 2022 | 6.6% | Increased demand for urban development and construction projects. |
| 2023 | 6.5% | Adoption of advanced mapping technologies by local firms. |
| 2024 | 6.3% | Growth in public investments for urban underground utilities. |
| 2025 | 6.5% | Rising awareness of utility safety among construction companies. |
| 2026 | 6.2% | Local municipalities implementing stricter excavation permitting requirements. |
| 2027 | 6.0% | Surge in infrastructure projects needing accurate utility mapping. |
| 2028 | 6.1% | Technological partnerships enhancing mapping capabilities nationwide. |
| 2029 | 6.4% | Focus on sustainable development driving underground utility assessments. |
| 2030 | 6.0% | Regulatory shifts encouraging relocation of outdated infrastructure. |
| 2031 | 6.4% | Public-private partnerships boosting underground mapping services. |
| 2032 | 6.3% | Emerging technologies improving utility detection efficiency. |
Note: Market size estimations and growth projections presented in this report are based on 6Wresearch's proprietary forecasting methodology, utilizing the latest available industry data, government publications, and primary research inputs.
Peru Underground Utility Mapping Market Key Takeaways
Below are some of the specific key takeaways from the market, including:
- Growing urbanization in Peru is significantly boosting the demand for underground utility mapping services.
- Government regulations are mandating utility mapping to improve construction safety and efficiency.
- Technological advancements are transforming utility detection and mapping practices.
- Increased focus on infrastructure projects is creating a favorable environment for market growth.
- Collaboration between public and private sectors is essential for enhancing mapping accuracy.
Evaluation of Restraints in Peru Underground Utility Mapping Market
The Peru Underground Utility Mapping Market faces several restraints that hinder its full potential. One major challenge is the inadequate accuracy of existing data and outdated mapping information, which can lead to costly infrastructure damage during excavation. on top of that, many utility companies and government agencies lack standardized procedures, making efficient mapping efforts difficult. The complexity of urban underground networks adds another layer of difficulty, complicating the identification and mapping of utility lines.
Peru Underground Utility Mapping Market Trends
The market is witnessing a shift towards the adoption of integrated mapping technologies, combining GIS and GPR for enhanced accuracy. Another trend is the increasing reliance on unmanned aerial vehicles (UAVs) for utility mapping, offering a new perspective and efficiency in data collection. Urban planning initiatives are placing a stronger emphasis on the importance of underground utility mapping to streamline construction processes and reduce risks.
Peru Underground Utility Mapping Market Opportunities
There are several growth opportunities within the Peru Underground Utility Mapping Market. The integration of cutting-edge technologies like LiDAR presents a chance for improved precision in mapping. Additionally, the regulatory push for pre-construction utility mapping creates a favorable landscape for service providers. Emerging sectors, such as renewable energy and telecommunications, are also driving demand for accurate utility mapping services.
Government Initiatives in the Peru Underground Utility Mapping Market
Government policies are playing a crucial role in shaping the Peru Underground Utility Mapping Market. The regulatory environment is increasingly supportive of initiatives that require accurate utility mapping prior to construction projects. This focus on safety and efficiency is vital in reducing infrastructure damage and ensuring smooth project execution.
- A regulatory framework introduced in 2025 mandates utility mapping before construction activities to enhance safety and efficiency.
- A national initiative launched in mid-2025 aims to improve urban planning through the implementation of advanced mapping technologies.
- Current efforts are underway to establish standardized procedures among utility companies to improve data accuracy.
- A planned public-private partnership expected to roll out by 2027 will focus on the integration of GIS technologies in utility mapping.
Future Insights of the Peru Underground Utility Mapping Market
Looking ahead to 2026-2032, the Peru Underground Utility Mapping Market is set for steady growth driven by urbanization and infrastructure development. The increasing adoption of advanced mapping technologies will enhance accuracy and efficiency in utility management. With government regulations firmly in place, companies must prioritize investment in innovative solutions to stay competitive and meet the growing demands of the market.
Peru Underground Utility Mapping Market Latest Developments
In the past 12-14 months, the Peru Underground Utility Mapping Market has seen notable activity, reflecting a strong commitment to improving utility mapping practices. Companies are investing in new technologies and expanding their services to better serve the growing infrastructure sector.
- A major technology vendor announced the rollout of a new GPR system in Q2 2025, enhancing detection capabilities for underground utilities.
- An ongoing initiative, started in early 2025, focuses on training programs for local construction teams on utility mapping best practices.
- A collaborative project between public agencies and private firms to develop a national utility mapping database is currently underway, aiming for completion by late 2026.
- Upcoming in early 2026, a pilot program will test the use of UAVs for utility mapping in urban areas.
Peru Underground Utility Mapping Market - Key Attractiveness of the Report
- 10 Years of Market Numbers
- Historical Data Starting from 2022 to 2025
- Base Year: 2025
- Forecast Data until 2032
- Key Performance Indicators Impacting the Market
- Major Upcoming Developments and Projects
Key sectors include construction, oil & gas, and transportation, all of which require precise mapping to avoid accidents and project delays.
Key Highlights of the Report:
- Peru Underground Utility Mapping Market Outlook
- Market Size of Peru Underground Utility Mapping Market, 2025
- Forecast of Peru Underground Utility Mapping Market, 2032
- Historical Data and Forecast of Peru Underground Utility Mapping Revenues & Volume for the Period 2022-2032F
- Peru Underground Utility Mapping Market Trend Evolution
- Peru Underground Utility Mapping Market Drivers and Challenges
- Peru Underground Utility Mapping Price Trends
- Peru Underground Utility Mapping Porter's Five Forces
- Peru Underground Utility Mapping Industry Life Cycle
- Historical Data and Forecast of Peru Underground Utility Mapping Market Revenues & Volume By Component for the Period 2022-2032F
- Historical Data and Forecast of Peru Underground Utility Mapping Market Revenues & Volume By Technological Solutions for the Period 2022-2032F
- Historical Data and Forecast of Peru Underground Utility Mapping Market Revenues & Volume By Services for the Period 2022-2032F
- Historical Data and Forecast of Peru Underground Utility Mapping Market Revenues & Volume By Vertical for the Period 2022-2032F
- Historical Data and Forecast of Peru Underground Utility Mapping Market Revenues & Volume By Oil & Gas for the Period 2022-2032F
- Historical Data and Forecast of Peru Underground Utility Mapping Market Revenues & Volume By Electricity for the Period 2022-2032F
- Historical Data and Forecast of Peru Underground Utility Mapping Market Revenues & Volume By Government & Public Safety for the Period 2022-2032F
- Historical Data and Forecast of Peru Underground Utility Mapping Market Revenues & Volume By Construction for the Period 2022-2032F
- Historical Data and Forecast of Peru Underground Utility Mapping Market Revenues & Volume By Telecommunication for the Period 2022-2032F
- Historical Data and Forecast of Peru Underground Utility Mapping Market Revenues & Volume By Others for the Period 2022-2032F
- Peru Underground Utility Mapping Import Export Trade Statistics
- Market Opportunity Assessment By Component
- Market Opportunity Assessment By Vertical
- Peru Underground Utility Mapping Top Companies Market Share
- Peru Underground Utility Mapping Competitive Benchmarking By Technical and Operational Parameters
- Peru Underground Utility Mapping Company Profiles
- Peru Underground Utility Mapping Key Strategic Recommendations