Philippines Nonferrous Metal Products Market (2026-2032) | Growth, Analysis, Value, Revenue, Forecast, Outlook, Share, Trends, Industry, Companies & Size
Market Forecast By Type (Smelting and Refining, Rolling, Drawing, Extruding, Alloying, Other), By Applications (Automotive, Electronic Power, Construction, Others) And Competitive Landscape
| Product Code: ETC033829 | Publication Date: Jul 2023 | Updated Date: Jun 2026 | Product Type: Report | |
| Publisher: 6Wresearch | Author: Ravi Bhandari | No. of Pages: 70 | No. of Figures: 35 | No. of Tables: 5 |
Philippines Nonferrous Metal Products Market Summary
The philippines nonferrous metal products market was estimated at USD 130 Million in 2025 and is projected to reach USD 141 Million by 2032, growing at a CAGR of 1.3% from 2026 to 2032.
Philippines Nonferrous Metal Products Market Year-wise Growth Rate and Key Drivers
This graph highlights how the Philippines Nonferrous Metal Products Market has steadily grown over the past five years, supported by major growth factors.
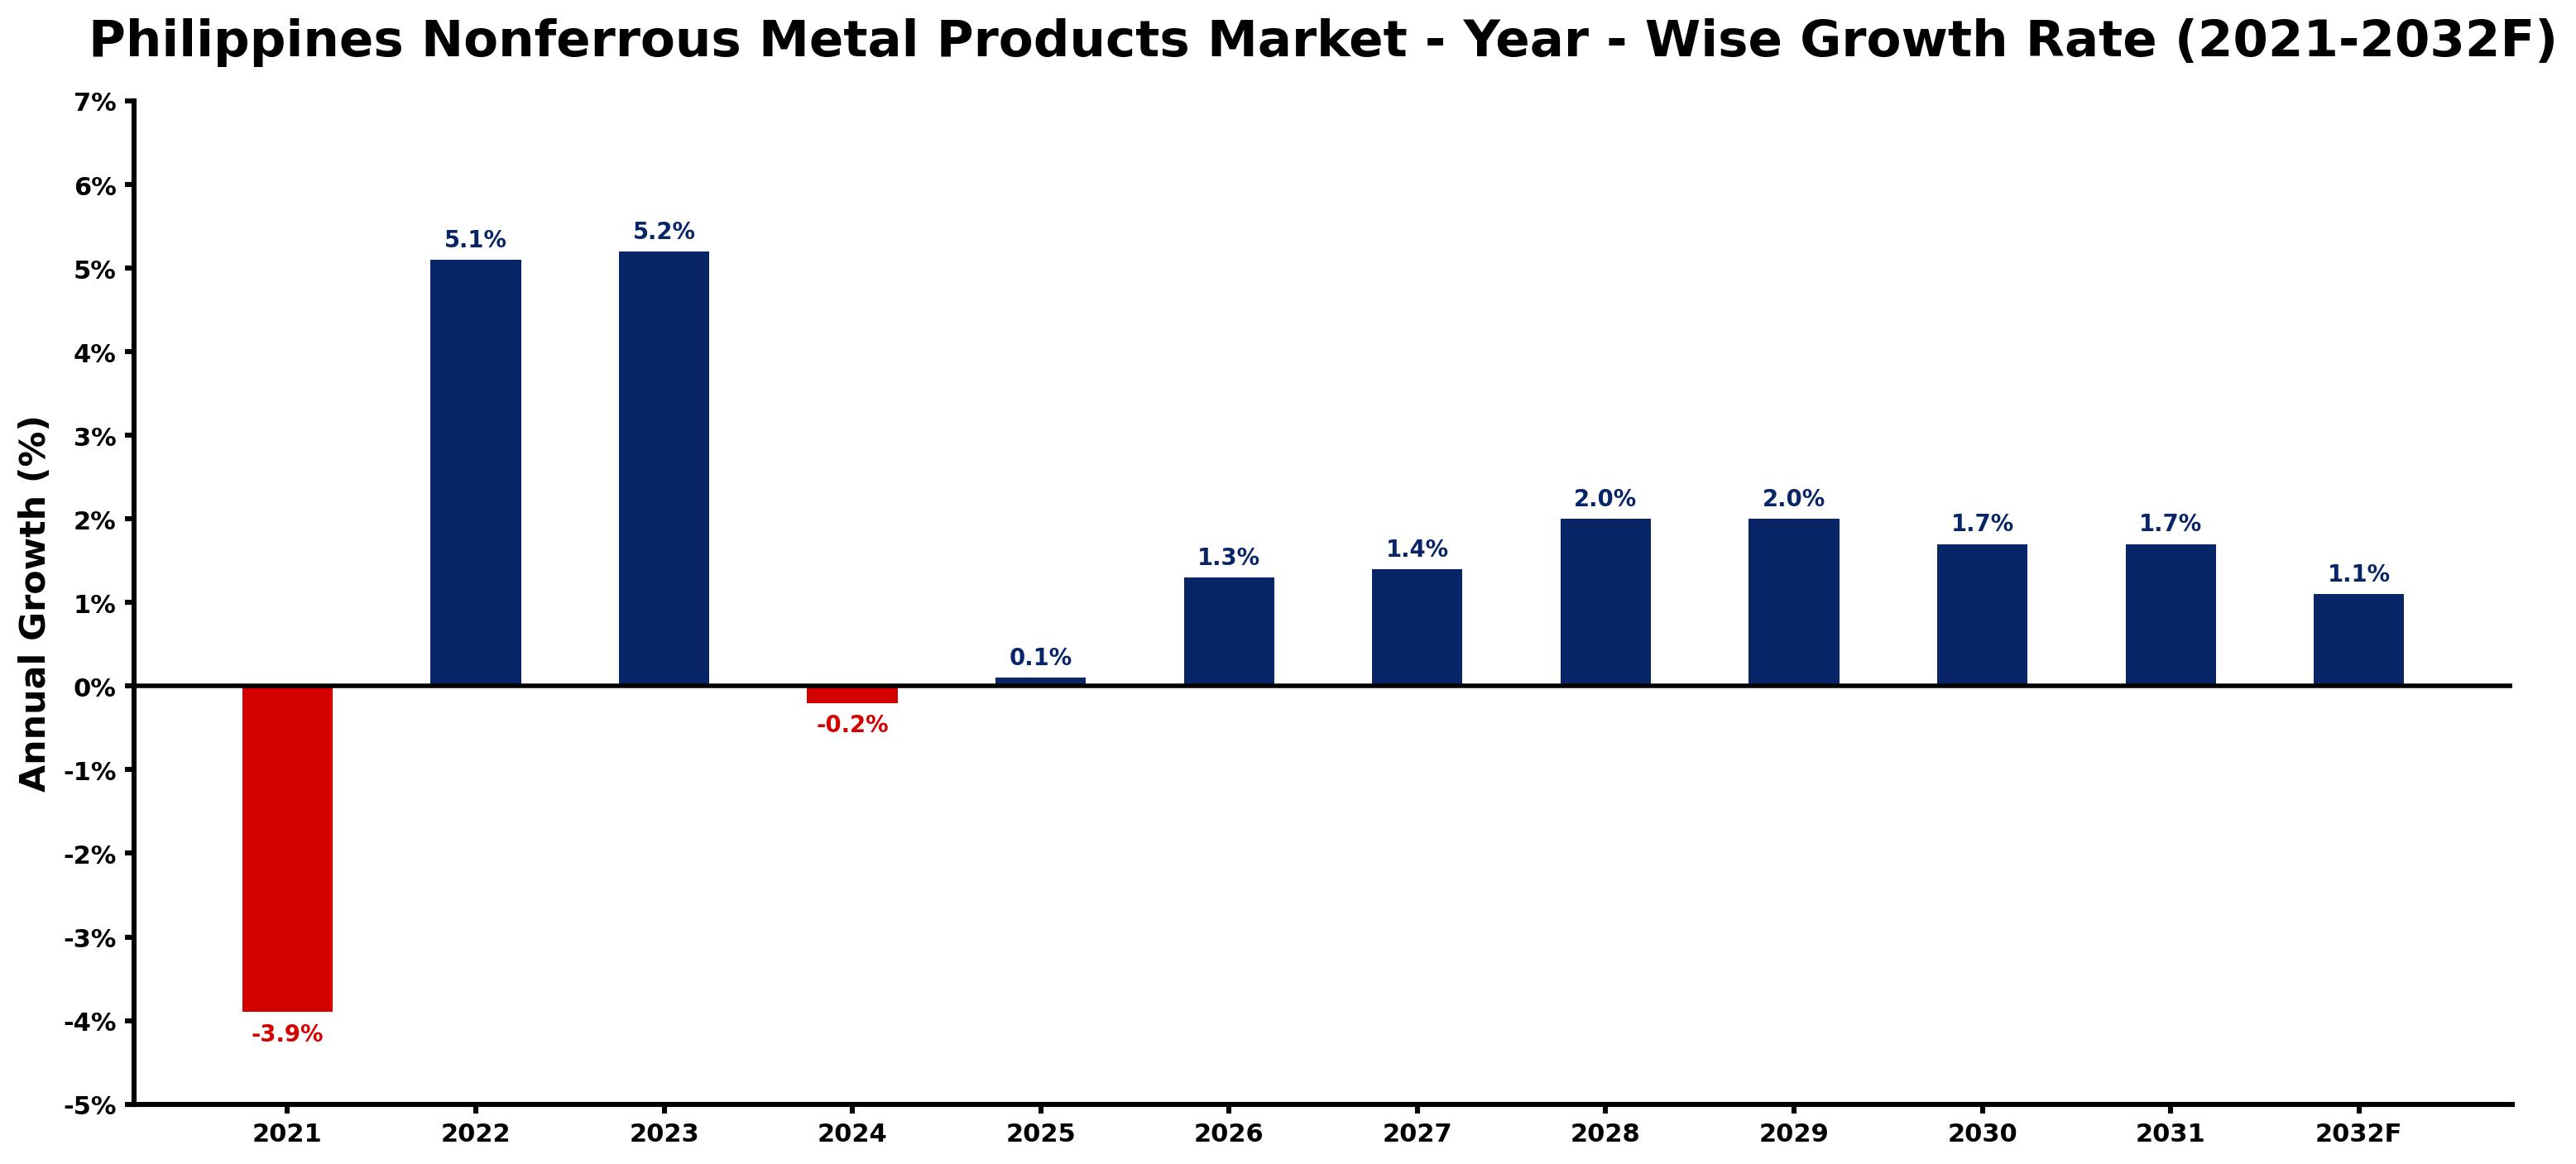
The table below presents the year wise growth rates along with the key drivers influencing the market
| Year | Growth Rate | Major Drivers |
| 2021 | -3.9% | Supply chain disruptions hindered manufacturing efficiency, leading to delays and increased costs in nonferrous metal production. |
| 2022 | 5.1% | Increased investment in renewable energy projects enhances demand for nonferrous metal components. |
| 2023 | 5.2% | Rising construction projects in urban areas drives copper and aluminum requirements significantly. |
| 2024 | -0.2% | Intensified global competition forced local producers to lower prices, eroding profit margins and market stability. |
| 2025 | 0.1% | Manufacturing sector expansion fuels demand for specialty alloys and metal fabrications. |
| 2026 | 1.3% | Technological advancements in recycling processes improve supply chains for nonferrous metals. |
| 2027 | 1.4% | Infrastructure modernization projects generate a sustained need for durable metal products. |
| 2028 | 2.0% | Electric grid upgrades emphasize the role of copper in enhancing energy efficiency. |
| 2029 | 2.0% | Regional trade agreements boost export potential for Philippine nonferrous metal products. |
| 2030 | 1.7% | Focus on sustainable construction methods increases the use of recycled metal materials. |
| 2031 | 1.7% | Market diversification into aerospace components leads to a surge in aluminum production. |
| 2032 | 1.1% | Innovations in lightweight materials influence consumer preferences toward nonferrous products. |
Note - Market size estimations and growth projections presented in this report are based on 6Wresearch's advanced forecasting approach, validated with industry datasets as of June 2026.
Philippines Nonferrous Metal Products Market Synopsis
The Philippines Nonferrous Metal Products Market is projected to reach 1.3% and witness significant growth during the forecast period (2026-2032). The market is expected to register a compound annual growth rate (CAGR) of 2.8%, driven by the increasing development of key sectors such as automotive and construction, which largely utilize non-ferrous metals including aluminum, copper, and zinc across various applications. The trend of urbanization and rising consumer demand further supports the expansion of this sector as the country prepares for several major industrial projects that will necessitate high-quality nonferrous metal products.
Philippines Nonferrous Metal Products Market Growth Drivers
The growth of the Philippines Nonferrous Metal Products Market can be attributed to several critical factors that are fostering increased consumption.
- Government investment in infrastructure projects is steadily increasing, enhancing demand for raw materials, including non-ferrous metals essential for modern architecture.
- Urbanization trends continue to reshape major metropolitan areas, resulting in improved living standards and higher disposable incomes that fuel the purchase of technology and electronic devices made from non-ferrous metals.
- Growing automotive production in the Philippines is contributing to the requirement for lightweight and durable materials, which non-ferrous metals provide.
- The construction sector shows a persistent inclination towards sustainable and efficient materials, encouraging builders to opt for non-ferrous metals known for their recyclability and longevity.
- Export opportunities in the global market for nonferrous metals are increasing, providing local manufacturers with access to new revenue streams and collaboration with international players.
Philippines Nonferrous Metal Products Market Challenges and Restraints
Despite the favorable conditions driving the market, several challenges must be addressed to ensure steady growth in the Philippines Nonferrous Metal Products Market.
- Intensifying competition from cheaper imports may pressure local manufacturers, impacting profit margins and market share.
- Environmental regulations regarding mining and production processes can hinder operations and require significant investment for compliance.
- Fluctuations in global metal prices can lead to volatility affecting both production costs and market stability in the domestic sphere.
- The reliance on foreign technology and expertise for advanced manufacturing processes can limit the competitiveness of local players.
- Supply chain disruptions, particularly in sourcing raw materials and logistics constraints, can present operational challenges that affect timely product delivery.
Philippines Nonferrous Metal Products Market Government Investment and Initiatives
The Philippine government is actively fostering a conducive environment for growth in the nonferrous metal products sector through various initiatives and strategic investments.
- Significant allocations in the national budget for infrastructure enhancement are aimed at bolstering the construction sector, which relies heavily on non-ferrous metals.
- The government's 'Build, Build, Build' program continues to encourage large-scale public works that utilize non-ferrous items, thereby stimulating local production.
- Policy frameworks are being developed to support sustainable mining practices, which address environmental concerns while ensuring raw material availability.
- International trade agreements are being pursued to enhance the export potential of Philippines-made nonferrous metal products.
- Investment incentives, including tax breaks for businesses engaging in sustainable practices within the metals sector, are being offered to promote growth and innovation.
Philippines Nonferrous Metal Products Market Latest Developments (May 2025 - June 2026)
The period from May 2025 to June 2026 has witnessed notable developments in the Philippines Nonferrous Metal Products Market that point towards a dynamic industry landscape.
- Increased collaboration between local manufacturers and international partners is emerging, aimed at adopting advanced technologies in production processes.
- Several large construction projects have been green-lighted, specifically focusing on green building initiatives that leverage non-ferrous materials.
- Regulatory bodies are enhancing their framework to accommodate industry innovations that target sustainability and efficiency in the use of non-ferrous metals.
- Investment in recycling facilities is gaining momentum, responding to the growing emphasis on circular economy principles within the nonferrous sector.
- The market is experiencing a shift towards product diversification, with manufacturers exploring new applications for non-ferrous metals in sectors beyond traditional usage.
Philippines Nonferrous Metal Products Market - Key Attractiveness of the Report
- 10 Years of Market Numbers
- Historical Data Starting from 2022 to 2025
- Base Year: 2025
- Forecast Data until 2032
- Key Performance Indicators Impacting the Market
- Major Upcoming Developments and Projects
Key Highlights of the Report:
- Philippines Nonferrous Metal Products Market Outlook
- Market Size of Philippines Nonferrous Metal Products Market, 2025
- Forecast of Philippines Nonferrous Metal Products Market, 2032
- Historical Data and Forecast of Philippines Nonferrous Metal Products Revenues & Volume for the Period 2022-2032F
- Philippines Nonferrous Metal Products Market Trend Evolution
- Philippines Nonferrous Metal Products Market Drivers and Challenges
- Philippines Nonferrous Metal Products Price Trends
- Philippines Nonferrous Metal Products Porter's Five Forces
- Philippines Nonferrous Metal Products Industry Life Cycle
- Historical Data and Forecast of Philippines Nonferrous Metal Products Market Revenues & Volume By Type for the Period 2022-2032F
- Historical Data and Forecast of Philippines Nonferrous Metal Products Market Revenues & Volume By Smelting and Refining for the Period 2022-2032F
- Historical Data and Forecast of Philippines Nonferrous Metal Products Market Revenues & Volume By Rolling for the Period 2022-2032F
- Historical Data and Forecast of Philippines Nonferrous Metal Products Market Revenues & Volume By Drawing for the Period 2022-2032F
- Historical Data and Forecast of Philippines Nonferrous Metal Products Market Revenues & Volume By Extruding for the Period 2022-2032F
- Historical Data and Forecast of Philippines Nonferrous Metal Products Market Revenues & Volume By Alloying for the Period 2022-2032F
- Historical Data and Forecast of Philippines Nonferrous Metal Products Market Revenues & Volume By Other for the Period 2022-2032F
- Historical Data and Forecast of Philippines Nonferrous Metal Products Market Revenues & Volume By Applications for the Period 2022-2032F
- Historical Data and Forecast of Philippines Nonferrous Metal Products Market Revenues & Volume By Automotive for the Period 2022-2032F
- Historical Data and Forecast of Philippines Nonferrous Metal Products Market Revenues & Volume By Electronic Power for the Period 2022-2032F
- Historical Data and Forecast of Philippines Nonferrous Metal Products Market Revenues & Volume By Construction for the Period 2022-2032F
- Historical Data and Forecast of Philippines Nonferrous Metal Products Market Revenues & Volume By Others for the Period 2022-2032F
- Philippines Nonferrous Metal Products Import Export Trade Statistics
- Market Opportunity Assessment By Type
- Market Opportunity Assessment By Applications
- Philippines Nonferrous Metal Products Top Companies Market Share
- Philippines Nonferrous Metal Products Competitive Benchmarking By Technical and Operational Parameters
- Philippines Nonferrous Metal Products Company Profiles
- Philippines Nonferrous Metal Products Key Strategic Recommendations
Frequently Asked Questions About the Market Study (FAQs):
The growth is driven by increasing infrastructure investments, urbanization, and heightened consumer demand across various industrial sectors.
Challenges include competition from imports, fluctuating metal prices, and the need for compliance with environmental regulations.
Government initiatives include funding infrastructure projects, developing sustainable mining policies, and providing investment incentives to support the sector.
Recent developments include collaboration with international partners, endorsements of green building projects, and a rise in recycling initiatives in the sector.
6Wresearch actively monitors the Philippines Nonferrous Metal Products Market and publishes its comprehensive annual report, highlighting emerging trends, growth drivers, revenue analysis, and forecast outlook. Our insights help businesses to make data-backed strategic decisions with ongoing market dynamics. Our analysts track relevent industries related to the Philippines Nonferrous Metal Products Market, allowing our clients with actionable intelligence and reliable forecasts tailored to emerging regional needs.
Yes, we provide customisation as per your requirements. To learn more, feel free to contact us on sales@6wresearch.com
1 Executive Summary |
2 Introduction |
2.1 Key Highlights of the Report |
2.2 Report Description |
2.3 Market Scope & Segmentation |
2.4 Research Methodology |
2.5 Assumptions |
3 Philippines Nonferrous Metal Products Market Overview |
3.1 Philippines Country Macro Economic Indicators |
3.2 Philippines Nonferrous Metal Products Market Revenues & Volume, 2022 & 2032F |
3.3 Philippines Nonferrous Metal Products Market - Industry Life Cycle |
3.4 Philippines Nonferrous Metal Products Market - Porter's Five Forces |
3.5 Philippines Nonferrous Metal Products Market Revenues & Volume Share, By Type, 2022 & 2032F |
3.6 Philippines Nonferrous Metal Products Market Revenues & Volume Share, By Applications, 2022 & 2032F |
4 Philippines Nonferrous Metal Products Market Dynamics |
4.1 Impact Analysis |
4.2 Market Drivers |
4.2.1 Growing infrastructure development projects in the Philippines |
4.2.2 Increasing demand for lightweight and durable materials in the manufacturing sector |
4.2.3 Rising focus on renewable energy sources driving demand for nonferrous metal products |
4.3 Market Restraints |
4.3.1 Fluctuating prices of raw materials impacting production costs |
4.3.2 Regulatory challenges related to environmental compliance and sustainability goals |
4.3.3 Competition from alternative materials like composites and plastics |
5 Philippines Nonferrous Metal Products Market Trends |
6 Philippines Nonferrous Metal Products Market, By Types |
6.1 Philippines Nonferrous Metal Products Market, By Type |
6.1.1 Overview and Analysis |
6.1.2 Philippines Nonferrous Metal Products Market Revenues & Volume, By Type, 2022-2032F |
6.1.3 Philippines Nonferrous Metal Products Market Revenues & Volume, By Smelting and Refining, 2022-2032F |
6.1.4 Philippines Nonferrous Metal Products Market Revenues & Volume, By Rolling, 2022-2032F |
6.1.5 Philippines Nonferrous Metal Products Market Revenues & Volume, By Drawing, 2022-2032F |
6.1.6 Philippines Nonferrous Metal Products Market Revenues & Volume, By Extruding, 2022-2032F |
6.1.7 Philippines Nonferrous Metal Products Market Revenues & Volume, By Alloying, 2022-2032F |
6.1.8 Philippines Nonferrous Metal Products Market Revenues & Volume, By Other, 2022-2032F |
6.2 Philippines Nonferrous Metal Products Market, By Applications |
6.2.1 Overview and Analysis |
6.2.2 Philippines Nonferrous Metal Products Market Revenues & Volume, By Automotive, 2022-2032F |
6.2.3 Philippines Nonferrous Metal Products Market Revenues & Volume, By Electronic Power, 2022-2032F |
6.2.4 Philippines Nonferrous Metal Products Market Revenues & Volume, By Construction, 2022-2032F |
6.2.5 Philippines Nonferrous Metal Products Market Revenues & Volume, By Others, 2022-2032F |
7 Philippines Nonferrous Metal Products Market Import-Export Trade Statistics |
7.1 Philippines Nonferrous Metal Products Market Export to Major Countries |
7.2 Philippines Nonferrous Metal Products Market Imports from Major Countries |
8 Philippines Nonferrous Metal Products Market Key Performance Indicators |
8.1 Average selling price of nonferrous metal products |
8.2 Percentage of revenue from new product innovations |
8.3 Percentage of revenue from export markets |
8.4 Adoption rate of nonferrous metal products in key industries |
8.5 Investment in research and development for new nonferrous metal products |
9 Philippines Nonferrous Metal Products Market - Opportunity Assessment |
9.1 Philippines Nonferrous Metal Products Market Opportunity Assessment, By Type, 2022 & 2032F |
9.2 Philippines Nonferrous Metal Products Market Opportunity Assessment, By Applications, 2022 & 2032F |
10 Philippines Nonferrous Metal Products Market - Competitive Landscape |
10.1 Philippines Nonferrous Metal Products Market Revenue Share, By Companies, 2025 |
10.2 Philippines Nonferrous Metal Products Market Competitive Benchmarking, By Operating and Technical Parameters |
11 Company Profiles |
12 Recommendations |
13 Disclaimer |
Global Go To Market Strategy - 2030
Export potential enables firms to identify high-growth global markets with greater confidence by combining advanced trade intelligence with a structured quantitative methodology. The framework analyzes emerging demand trends and country-level import patterns while integrating macroeconomic and trade datasets such as GDP and population forecasts, bilateral import–export flows, tariff structures, elasticity differentials between developed and developing economies, geographic distance, and import demand projections. Using weighted trade values from 2020–2024 as the base period to project country-to-country export potential for 2030, these inputs are operationalized through calculated drivers such as gravity model parameters, tariff impact factors, and projected GDP per-capita growth. Through an analysis of hidden potentials, demand hotspots, and market conditions that are most favorable to success, this method enables firms to focus on target countries, maximize returns, and global expansion with data, backed by accuracy.
By factoring in the projected importer demand gap that is currently unmet and could be potential opportunity, it identifies the potential for the Exporter (Country) among 190 countries, against the general trade analysis, which identifies the biggest importer or exporter.
To discover high-growth global markets and optimize your business strategy:
Click Here
Pricing
- Single User License$ 1,995
- Department License$ 2,400
- Site License$ 3,120
- Global License$ 3,795

Leadership Perspectives from Industry Events
Search
Thought Leadership and Analyst Meet


Our Clients
6WResearch In News
- India Air Conditioner Market Set for Strong Rebound in 2026 After Weather-Led Correction and GST-Driven Recovery: 6Wresearch
- ADAS in India: How Automatic Emergency Braking, Blind Spot Detection & Driver Monitoring are Transforming Road Safety
- Doha a strategic location for EV manufacturing hub: IPA Qatar
- Demand for luxury TVs surging in the GCC, says Samsung
- Empowering Growth: The Thriving Journey of Bangladesh’s Cable Industry
- Demand for luxury TVs surging in the GCC, says Samsung
Latest Reports
- Nicaragua RPG Gaming Market (2026-2032)
- New Zealand RPG Gaming Market (2026-2032)
- Netherlands RPG Gaming Market (2026-2032)
- Nauru RPG Gaming Market (2026-2032)
- Namibia RPG Gaming Market (2026-2032)
- Mozambique RPG Gaming Market (2026-2032)
- Montenegro RPG Gaming Market (2026-2032)
- Mongolia RPG Gaming Market (2026-2032)
- Monaco RPG Gaming Market (2026-2032)
- Micronesia RPG Gaming Market (2026-2032)
Industry Events and Analyst Meet

EV India Expo 2026

HIMTEX 2026

India Refining Summit 2026

India EV Show 2026

EV tech India Expo 2026
Whitepaper
- Middle East & Africa Commercial Security Market Click here to view more.
- Middle East & Africa Fire Safety Systems & Equipment Market Click here to view more.
- GCC Drone Market Click here to view more.
- Middle East Lighting Fixture Market Click here to view more.
- GCC Physical & Perimeter Security Market Click here to view more.