Philippines Soft Drinks Packaging Market (2026-2032) Outlook | Industry, Forecast, Value, Analysis, Growth, Size, Share, Revenue, Companies & Trends
Market Forecast By Material (Paper, Plastic, Metal, Glass), By Product Type (Cans, Boxes, Bottles, Cartons), By Capacity (Up to 100 ml, 100 to 250 ml, 250 to 500 ml, 500 to 1000 ml, 1000 to 2000 ml, Above 2000 ml), By Application (Carbonated soft drinks, Functional Drinks, Sport Drinks, Energy Drinks, Others, Juices) And Competitive Landscape
| Product Code: ETC189881 | Publication Date: May 2022 | Updated Date: Jun 2026 | Product Type: Market Research Report | |
| Publisher: 6Wresearch | Author: Ravi Bhandari | No. of Pages: 60 | No. of Figures: 40 | No. of Tables: 7 |
Philippines Soft Drinks Packaging Market Size, Share & Growth Rate
The Philippines Soft Drinks Packaging Market was estimated at USD 916 Million in 2025 and is projected to reach USD 1317 Million by 2032, growing at a CAGR of 5.3% from 2026 to 2032. This upward trend is propelled by a growing urban population that prioritizes convenience and portability in their consumption habits. As more consumers opt for on-the-go packaging options, the demand for innovative designs that enhance product appeal and functionality continues to surge.
Philippines Soft Drinks Packaging Market Year-wise Growth Rate and Key Drivers
This graph highlights how the Philippines Soft Drinks Packaging Market has steadily grown over the years, supported by major growth factors.
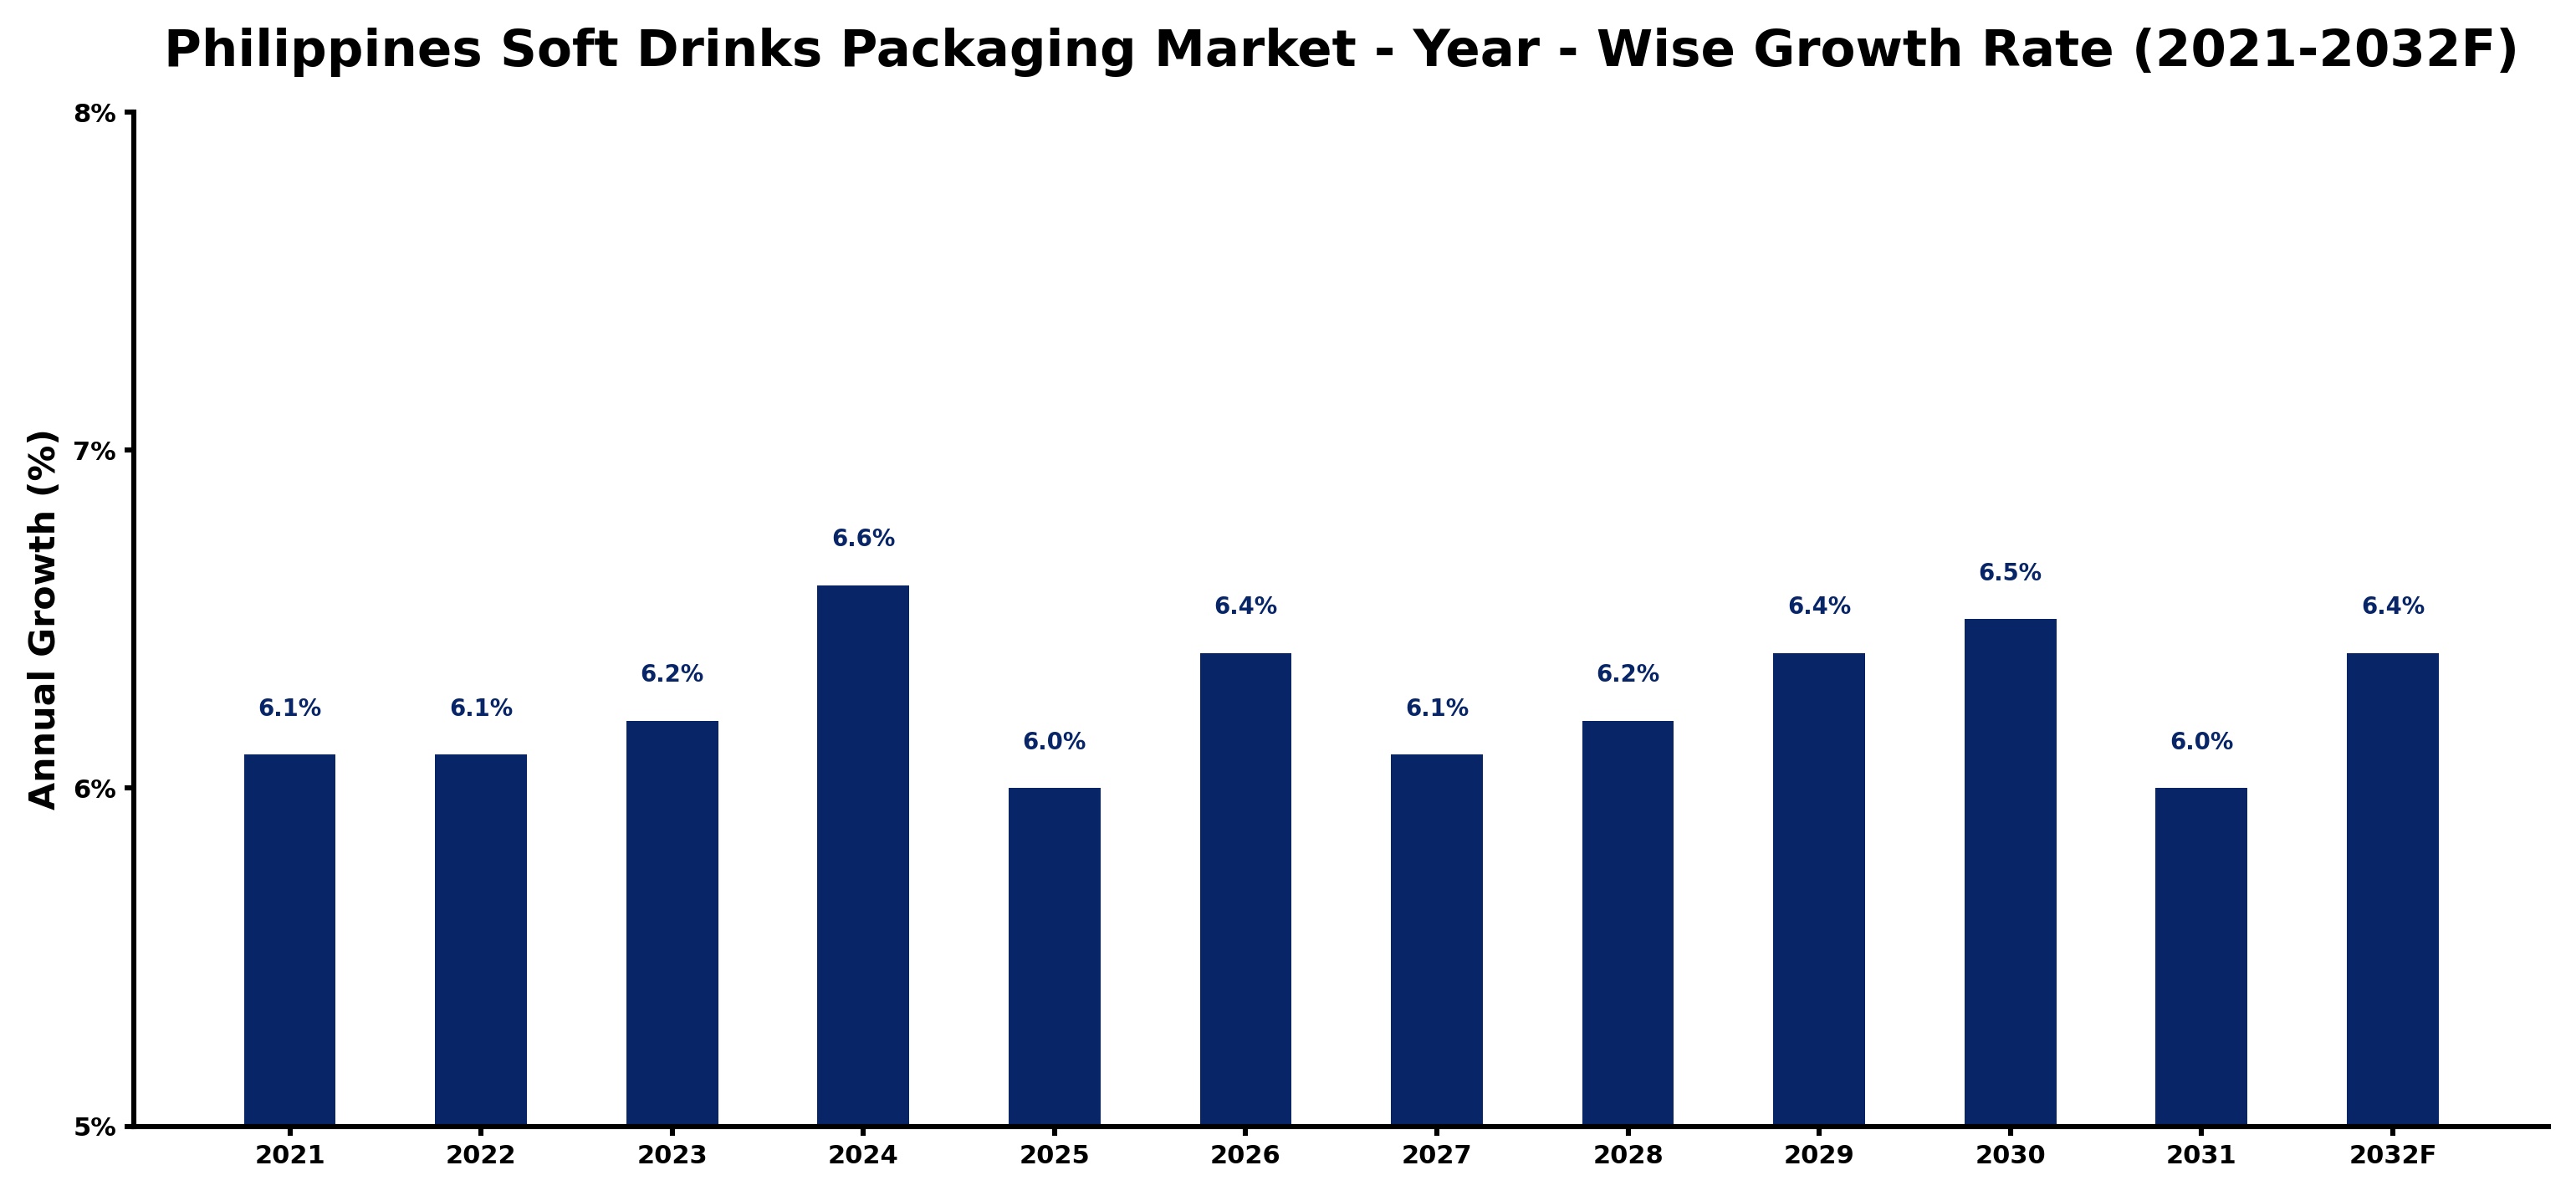
The table below presents the year‑wise growth rates along with the key drivers influencing the market
| Year | Growth Rate | Major Drivers |
| 2021 | 6.1% | Increased consumer demand for convenience |
| 2022 | 6.1% | Health-conscious trends influenced packaging |
| 2023 | 6.2% | Sustainable packaging initiatives gained traction |
| 2024 | 6.6% | E-commerce growth expanded market reach |
| 2025 | 6.0% | Product innovation attracted new consumers |
| 2026 | 6.4% | Brand loyalty strengthened among consumers |
| 2027 | 6.1% | Rising disposable income fueled consumption |
| 2028 | 6.2% | Local sourcing enhanced brand appeal |
| 2029 | 6.4% | Collaborations with local brands increased |
| 2030 | 6.5% | Technological advancements improved efficiency |
| 2031 | 6.0% | Marketing campaigns drove brand awareness |
| 2032 | 6.4% | Customization options attracted diverse consumers |
Note - Market size estimations and growth projections presented in this report are based on 6Wresearch’s advanced forecasting approach, validated with industry datasets as of June 2026.
Philippines Soft Drinks Packaging Market Synopsis
The Philippines soft drinks packaging market has experienced robust momentum in recent years, driven primarily by shifting consumer preferences towards portable and visually appealing packaging solutions. The market's trajectory indicates that as competition intensifies, companies will increasingly focus on developing more sustainable options to meet changing demands.
Looking ahead, the market is expected to evolve with innovations in lightweight materials and eco-friendly packaging. These changes not only align with the push for sustainability but also cater to health-conscious consumers interested in smaller portion sizes, illustrating the adaptability of the sector to meet diverse consumer needs.
Philippines Soft Drinks Packaging Market Key Takeaways
- The market is projected to grow at a CAGR of 5.3% from 2026 to 2032, reflecting increasing consumer demand.
- Convenience packaging formats are becoming essential in response to urbanization and lifestyle changes.
- There is a notable shift towards sustainable packaging, addressing environmental concerns and consumer preferences.
- Technological advancements are enabling lighter, more durable packaging solutions that reduce logistics costs.
- Health-conscious consumers are driving the trend for smaller portion sizes in soft drinks packaging.
Evaluation of Restraints in Philippines Soft Drinks Packaging Market
Despite its growth potential, the Philippines soft drinks packaging market is not without challenges. A significant restraint is the increasing pressure from consumers for sustainable and eco-friendly packaging alternatives. The transition away from single-use plastics necessitates investment in innovative materials, which can be cost-prohibitive. Additionally, regulatory compliance and the management of supply chain disruptions present logistical challenges that industry players must navigate effectively. Balancing the demands for sustainability, cost-effectiveness, and product integrity remains a critical concern for stakeholders in the market.
Philippines Soft Drinks Packaging Market Trends
The market is currently witnessing several key trends that are shaping its landscape. One notable trend is the shift towards using biodegradable and recyclable materials in packaging, driven by consumer advocacy for environmental responsibility. Concurrently, the integration of technology in packaging design is leading to smarter solutions, such as QR codes on labels that engage consumers digitally. Furthermore, personalized packaging that caters to individual tastes and preferences is gaining traction, positioning brands to better connect with their target audience.
Philippines Soft Drinks Packaging Market Opportunities
Opportunities abound in the Philippines soft drinks packaging market as companies explore avenues to innovate and diversify their offerings. The rising trend of health and wellness creates potential for packaging that emphasizes portion control and functional beverages. Additionally, tapping into e-commerce logistics for home delivery presents a unique opportunity for businesses to design packaging that enhances product safety during transport. Lastly, partnerships with environmental organizations for sustainable initiatives may bolster brand reputation and consumer trust, driving growth.
Government Initiatives in the Philippines Soft Drinks Packaging Market
The Philippine government is increasingly focused on implementing policies that promote sustainability within the packaging sector. Initiatives aimed at reducing plastic waste and encouraging the use of recyclable materials are being introduced. Public spending on waste management programs and incentives for companies adopting eco-friendly practices reflect a commitment to addressing environmental challenges. As these policies evolve, they will likely influence packaging choices and drive innovation in the industry.
Future Insights of the Philippines Soft Drinks Packaging Market
From 2026 to 2032, the Philippines soft drinks packaging market is poised for substantial growth. Continued urbanization and an emphasis on convenience will sustain demand for various packaging formats. The rising health consciousness among consumers will also prompt a shift towards smaller, more functional packaging solutions. As environmental concerns intensify, companies that prioritize sustainability in their packaging processes will likely gain a competitive edge, ensuring their relevance in a rapidly evolving marketplace.
Philippines Soft Drinks Packaging Market Latest Developments (May 2025 - June 2026)
Recent developments in the Philippines soft drinks packaging market indicate a strong focus on innovation and sustainability. Companies are introducing new packaging formats that align with the growing trend of eco-friendly materials. Additionally, advancements in design technology are enhancing consumer engagement, paving the way for more interactive and appealing product packaging. Furthermore, industry collaborations aimed at reducing environmental footprints are gaining momentum, highlighting a collective effort towards responsible production.
Philippines Soft Drinks Packaging Market - Key Attractiveness of the Report
- 10 Years of Market Numbers
- Historical Data Starting from 2022 to 2025
- Base Year: 2025
- Forecast Data until 2032
- Key Performance Indicators Impacting the Market
- Major Upcoming Developments and Projects
Key Highlights of the Report:
- Philippines Soft Drinks Packaging Market Outlook
- Market Size of Philippines Soft Drinks Packaging Market, 2025
- Forecast of Philippines Soft Drinks Packaging Market, 2032
- Historical Data and Forecast of Philippines Soft Drinks Packaging Revenues & Volume for the Period 2022-2032F
- Philippines Soft Drinks Packaging Market Trend Evolution
- Philippines Soft Drinks Packaging Market Drivers and Challenges
- Philippines Soft Drinks Packaging Price Trends
- Philippines Soft Drinks Packaging Porter's Five Forces
- Philippines Soft Drinks Packaging Industry Life Cycle
- Historical Data and Forecast of Philippines Soft Drinks Packaging Market Revenues & Volume By Material for the Period 2022-2032F
- Historical Data and Forecast of Philippines Soft Drinks Packaging Market Revenues & Volume By Paper for the Period 2022-2032F
- Historical Data and Forecast of Philippines Soft Drinks Packaging Market Revenues & Volume By Plastic for the Period 2022-2032F
- Historical Data and Forecast of Philippines Soft Drinks Packaging Market Revenues & Volume By Metal for the Period 2022-2032F
- Historical Data and Forecast of Philippines Soft Drinks Packaging Market Revenues & Volume By Glass for the Period 2022-2032F
- Historical Data and Forecast of Philippines Soft Drinks Packaging Market Revenues & Volume By for the Period 2022-2032F
- Historical Data and Forecast of Philippines Soft Drinks Packaging Market Revenues & Volume By for the Period 2022-2032F
- Historical Data and Forecast of Philippines Soft Drinks Packaging Market Revenues & Volume By Product Type for the Period 2022-2032F
- Historical Data and Forecast of Philippines Soft Drinks Packaging Market Revenues & Volume By Cans for the Period 2022-2032F
- Historical Data and Forecast of Philippines Soft Drinks Packaging Market Revenues & Volume By Boxes for the Period 2022-2032F
- Historical Data and Forecast of Philippines Soft Drinks Packaging Market Revenues & Volume By Bottles for the Period 2022-2032F
- Historical Data and Forecast of Philippines Soft Drinks Packaging Market Revenues & Volume By Cartons for the Period 2022-2032F
- Historical Data and Forecast of Philippines Soft Drinks Packaging Market Revenues & Volume By for the Period 2022-2032F
- Historical Data and Forecast of Philippines Soft Drinks Packaging Market Revenues & Volume By for the Period 2022-2032F
- Historical Data and Forecast of Philippines Soft Drinks Packaging Market Revenues & Volume By Capacity for the Period 2022-2032F
- Historical Data and Forecast of Philippines Soft Drinks Packaging Market Revenues & Volume By Up to 100 ml for the Period 2022-2032F
- Historical Data and Forecast of Philippines Soft Drinks Packaging Market Revenues & Volume By 100 to 250 ml for the Period 2022-2032F
- Historical Data and Forecast of Philippines Soft Drinks Packaging Market Revenues & Volume By 250 to 500 ml for the Period 2022-2032F
- Historical Data and Forecast of Philippines Soft Drinks Packaging Market Revenues & Volume By 500 to 1000 ml for the Period 2022-2032F
- Historical Data and Forecast of Philippines Soft Drinks Packaging Market Revenues & Volume By 1000 to 2000 ml for the Period 2022-2032F
- Historical Data and Forecast of Philippines Soft Drinks Packaging Market Revenues & Volume By Above 2000 ml for the Period 2022-2032F
- Historical Data and Forecast of Philippines Soft Drinks Packaging Market Revenues & Volume By Application for the Period 2022-2032F
- Historical Data and Forecast of Philippines Soft Drinks Packaging Market Revenues & Volume By Carbonated soft drinks for the Period 2022-2032F
- Historical Data and Forecast of Philippines Soft Drinks Packaging Market Revenues & Volume By Functional Drinks for the Period 2022-2032F
- Historical Data and Forecast of Philippines Soft Drinks Packaging Market Revenues & Volume By Sport Drinks for the Period 2022-2032F
- Historical Data and Forecast of Philippines Soft Drinks Packaging Market Revenues & Volume By Energy Drinks for the Period 2022-2032F
- Historical Data and Forecast of Philippines Soft Drinks Packaging Market Revenues & Volume By Others for the Period 2022-2032F
- Historical Data and Forecast of Philippines Soft Drinks Packaging Market Revenues & Volume By Juices for the Period 2022-2032F
- Philippines Soft Drinks Packaging Import Export Trade Statistics
- Market Opportunity Assessment By Material
- Market Opportunity Assessment By Product Type
- Market Opportunity Assessment By Capacity
- Market Opportunity Assessment By Application
- Philippines Soft Drinks Packaging Top Companies Market Share
- Philippines Soft Drinks Packaging Competitive Benchmarking By Technical and Operational Parameters
- Philippines Soft Drinks Packaging Company Profiles
- Philippines Soft Drinks Packaging Key Strategic Recommendations
Philippines Soft Drinks Packaging Market - Frequently Asked Questions
The market is estimated at USD 916 Million in 2025 and is projected to reach USD 1317 Million by 2032, growing at a CAGR of 5.3% from 2026 to 2032.
The shift towards convenience and portability in consumer lifestyles is significantly influencing packaging trends. As urbanization rises, consumers are increasingly opting for single-serve bottles and cans.
Innovations include the use of lighter, more durable materials that minimize transportation costs and reduce environmental impact. There's also a strong trend towards interactive packaging that engages consumers digitally.
Yes, companies are actively exploring biodegradable and recyclable packaging options in response to consumer advocacy for environmental responsibility, which is becoming increasingly important.
The government is implementing policies that promote sustainable packaging practices, including waste reduction initiatives and incentives for eco-friendly materials, which influence market dynamics significantly.
6Wresearch actively monitors the Philippines Soft Drinks Packaging Market and publishes its comprehensive annual report, highlighting emerging trends, growth drivers, revenue analysis, and forecast outlook. Our insights help businesses to make data-backed strategic decisions with ongoing market dynamics. Our analysts track relevent industries related to the Philippines Soft Drinks Packaging Market, allowing our clients with actionable intelligence and reliable forecasts tailored to emerging regional needs.
Yes, we provide customisation as per your requirements. To learn more, feel free to contact us on sales@6wresearch.com
1 Executive Summary |
2 Introduction |
2.1 Key Highlights of the Report |
2.2 Report Description |
2.3 Market Scope & Segmentation |
2.4 Research Methodology |
2.5 Assumptions |
3 Philippines Soft Drinks Packaging Market Overview |
3.1 Philippines Country Macro Economic Indicators |
3.2 Philippines Soft Drinks Packaging Market Revenues & Volume, 2022 & 2032F |
3.3 Philippines Soft Drinks Packaging Market - Industry Life Cycle |
3.4 Philippines Soft Drinks Packaging Market - Porter's Five Forces |
3.5 Philippines Soft Drinks Packaging Market Revenues & Volume Share, By Material, 2022 & 2032F |
3.6 Philippines Soft Drinks Packaging Market Revenues & Volume Share, By Product Type, 2022 & 2032F |
3.7 Philippines Soft Drinks Packaging Market Revenues & Volume Share, By Capacity, 2022 & 2032F |
3.8 Philippines Soft Drinks Packaging Market Revenues & Volume Share, By Application, 2022 & 2032F |
4 Philippines Soft Drinks Packaging Market Dynamics |
4.1 Impact Analysis |
4.2 Market Drivers |
4.2.1 Increasing disposable income leading to higher consumption of soft drinks |
4.2.2 Growing popularity of convenience packaging options |
4.2.3 Rising demand for eco-friendly and sustainable packaging solutions |
4.3 Market Restraints |
4.3.1 Fluctuating raw material prices impacting packaging costs |
4.3.2 Stringent regulations on plastic usage affecting packaging choices |
4.3.3 Intense competition among packaging providers |
5 Philippines Soft Drinks Packaging Market Trends |
6 Philippines Soft Drinks Packaging Market, By Types |
6.1 Philippines Soft Drinks Packaging Market, By Material |
6.1.1 Overview and Analysis |
6.1.2 Philippines Soft Drinks Packaging Market Revenues & Volume, By Material, 2022-2032F |
6.1.3 Philippines Soft Drinks Packaging Market Revenues & Volume, By Paper, 2022-2032F |
6.1.4 Philippines Soft Drinks Packaging Market Revenues & Volume, By Plastic, 2022-2032F |
6.1.5 Philippines Soft Drinks Packaging Market Revenues & Volume, By Metal, 2022-2032F |
6.1.6 Philippines Soft Drinks Packaging Market Revenues & Volume, By Glass, 2022-2032F |
6.1.7 Philippines Soft Drinks Packaging Market Revenues & Volume, By , 2022-2032F |
6.1.8 Philippines Soft Drinks Packaging Market Revenues & Volume, By , 2022-2032F |
6.2 Philippines Soft Drinks Packaging Market, By Product Type |
6.2.1 Overview and Analysis |
6.2.2 Philippines Soft Drinks Packaging Market Revenues & Volume, By Cans, 2022-2032F |
6.2.3 Philippines Soft Drinks Packaging Market Revenues & Volume, By Boxes, 2022-2032F |
6.2.4 Philippines Soft Drinks Packaging Market Revenues & Volume, By Bottles, 2022-2032F |
6.2.5 Philippines Soft Drinks Packaging Market Revenues & Volume, By Cartons, 2022-2032F |
6.2.6 Philippines Soft Drinks Packaging Market Revenues & Volume, By , 2022-2032F |
6.2.7 Philippines Soft Drinks Packaging Market Revenues & Volume, By , 2022-2032F |
6.3 Philippines Soft Drinks Packaging Market, By Capacity |
6.3.1 Overview and Analysis |
6.3.2 Philippines Soft Drinks Packaging Market Revenues & Volume, By Up to 100 ml, 2022-2032F |
6.3.3 Philippines Soft Drinks Packaging Market Revenues & Volume, By 100 to 250 ml, 2022-2032F |
6.3.4 Philippines Soft Drinks Packaging Market Revenues & Volume, By 250 to 500 ml, 2022-2032F |
6.3.5 Philippines Soft Drinks Packaging Market Revenues & Volume, By 500 to 1000 ml, 2022-2032F |
6.3.6 Philippines Soft Drinks Packaging Market Revenues & Volume, By 1000 to 2000 ml, 2022-2032F |
6.3.7 Philippines Soft Drinks Packaging Market Revenues & Volume, By Above 2000 ml, 2022-2032F |
6.4 Philippines Soft Drinks Packaging Market, By Application |
6.4.1 Overview and Analysis |
6.4.2 Philippines Soft Drinks Packaging Market Revenues & Volume, By Carbonated soft drinks, 2022-2032F |
6.4.3 Philippines Soft Drinks Packaging Market Revenues & Volume, By Functional Drinks, 2022-2032F |
6.4.4 Philippines Soft Drinks Packaging Market Revenues & Volume, By Sport Drinks, 2022-2032F |
6.4.5 Philippines Soft Drinks Packaging Market Revenues & Volume, By Energy Drinks, 2022-2032F |
6.4.6 Philippines Soft Drinks Packaging Market Revenues & Volume, By Others, 2022-2032F |
6.4.7 Philippines Soft Drinks Packaging Market Revenues & Volume, By Juices, 2022-2032F |
7 Philippines Soft Drinks Packaging Market Import-Export Trade Statistics |
7.1 Philippines Soft Drinks Packaging Market Export to Major Countries |
7.2 Philippines Soft Drinks Packaging Market Imports from Major Countries |
8 Philippines Soft Drinks Packaging Market Key Performance Indicators |
8.1 Adoption rate of eco-friendly packaging solutions by soft drink manufacturers |
8.2 Percentage of soft drink brands offering convenience packaging options |
8.3 Investment in research and development for innovative packaging materials and designs |
9 Philippines Soft Drinks Packaging Market - Opportunity Assessment |
9.1 Philippines Soft Drinks Packaging Market Opportunity Assessment, By Material, 2022 & 2032F |
9.2 Philippines Soft Drinks Packaging Market Opportunity Assessment, By Product Type, 2022 & 2032F |
9.3 Philippines Soft Drinks Packaging Market Opportunity Assessment, By Capacity, 2022 & 2032F |
9.4 Philippines Soft Drinks Packaging Market Opportunity Assessment, By Application, 2022 & 2032F |
10 Philippines Soft Drinks Packaging Market - Competitive Landscape |
10.1 Philippines Soft Drinks Packaging Market Revenue Share, By Companies, 2025 |
10.2 Philippines Soft Drinks Packaging Market Competitive Benchmarking, By Operating and Technical Parameters |
11 Company Profiles |
12 Recommendations |
13 Disclaimer |
Global Go To Market Strategy - 2030
Export potential enables firms to identify high-growth global markets with greater confidence by combining advanced trade intelligence with a structured quantitative methodology. The framework analyzes emerging demand trends and country-level import patterns while integrating macroeconomic and trade datasets such as GDP and population forecasts, bilateral import–export flows, tariff structures, elasticity differentials between developed and developing economies, geographic distance, and import demand projections. Using weighted trade values from 2020–2024 as the base period to project country-to-country export potential for 2030, these inputs are operationalized through calculated drivers such as gravity model parameters, tariff impact factors, and projected GDP per-capita growth. Through an analysis of hidden potentials, demand hotspots, and market conditions that are most favorable to success, this method enables firms to focus on target countries, maximize returns, and global expansion with data, backed by accuracy.
By factoring in the projected importer demand gap that is currently unmet and could be potential opportunity, it identifies the potential for the Exporter (Country) among 190 countries, against the general trade analysis, which identifies the biggest importer or exporter.
To discover high-growth global markets and optimize your business strategy:
Click Here
Pricing
- Single User License$ 1,995
- Department License$ 2,400
- Site License$ 3,120
- Global License$ 3,795

Leadership Perspectives from Industry Events
Search
Thought Leadership and Analyst Meet


Our Clients
6WResearch In News
- India Air Conditioner Market Set for Strong Rebound in 2026 After Weather-Led Correction and GST-Driven Recovery: 6Wresearch
- ADAS in India: How Automatic Emergency Braking, Blind Spot Detection & Driver Monitoring are Transforming Road Safety
- Doha a strategic location for EV manufacturing hub: IPA Qatar
- Demand for luxury TVs surging in the GCC, says Samsung
- Empowering Growth: The Thriving Journey of Bangladesh’s Cable Industry
- Demand for luxury TVs surging in the GCC, says Samsung
Latest Reports
- Nicaragua RPG Gaming Market (2026-2032)
- New Zealand RPG Gaming Market (2026-2032)
- Netherlands RPG Gaming Market (2026-2032)
- Nauru RPG Gaming Market (2026-2032)
- Namibia RPG Gaming Market (2026-2032)
- Mozambique RPG Gaming Market (2026-2032)
- Montenegro RPG Gaming Market (2026-2032)
- Mongolia RPG Gaming Market (2026-2032)
- Monaco RPG Gaming Market (2026-2032)
- Micronesia RPG Gaming Market (2026-2032)
Industry Events and Analyst Meet

EV India Expo 2026

HIMTEX 2026

India Refining Summit 2026

India EV Show 2026

EV tech India Expo 2026
Whitepaper
- Middle East & Africa Commercial Security Market Click here to view more.
- Middle East & Africa Fire Safety Systems & Equipment Market Click here to view more.
- GCC Drone Market Click here to view more.
- Middle East Lighting Fixture Market Click here to view more.
- GCC Physical & Perimeter Security Market Click here to view more.