Poland Barrier Resins Market (2026-2032) Outlook | Forecast, Revenue, Value, Analysis, Trends, Companies, Industry, Size, Growth & Share
Market Forecast By Type (PVDC, EVOH, PEN), By End Use Industry (Food & Beverage, Pharmaceutical & Medical, Cosmetics, Agriculture, Industrial) And Competitive Landscape
| Product Code: ETC4504996 | Publication Date: Jul 2023 | Updated Date: Mar 2026 | Product Type: Report | |
| Publisher: 6Wresearch | Author: Dhaval Chaurasia | No. of Pages: 85 | No. of Figures: 45 | No. of Tables: 25 |
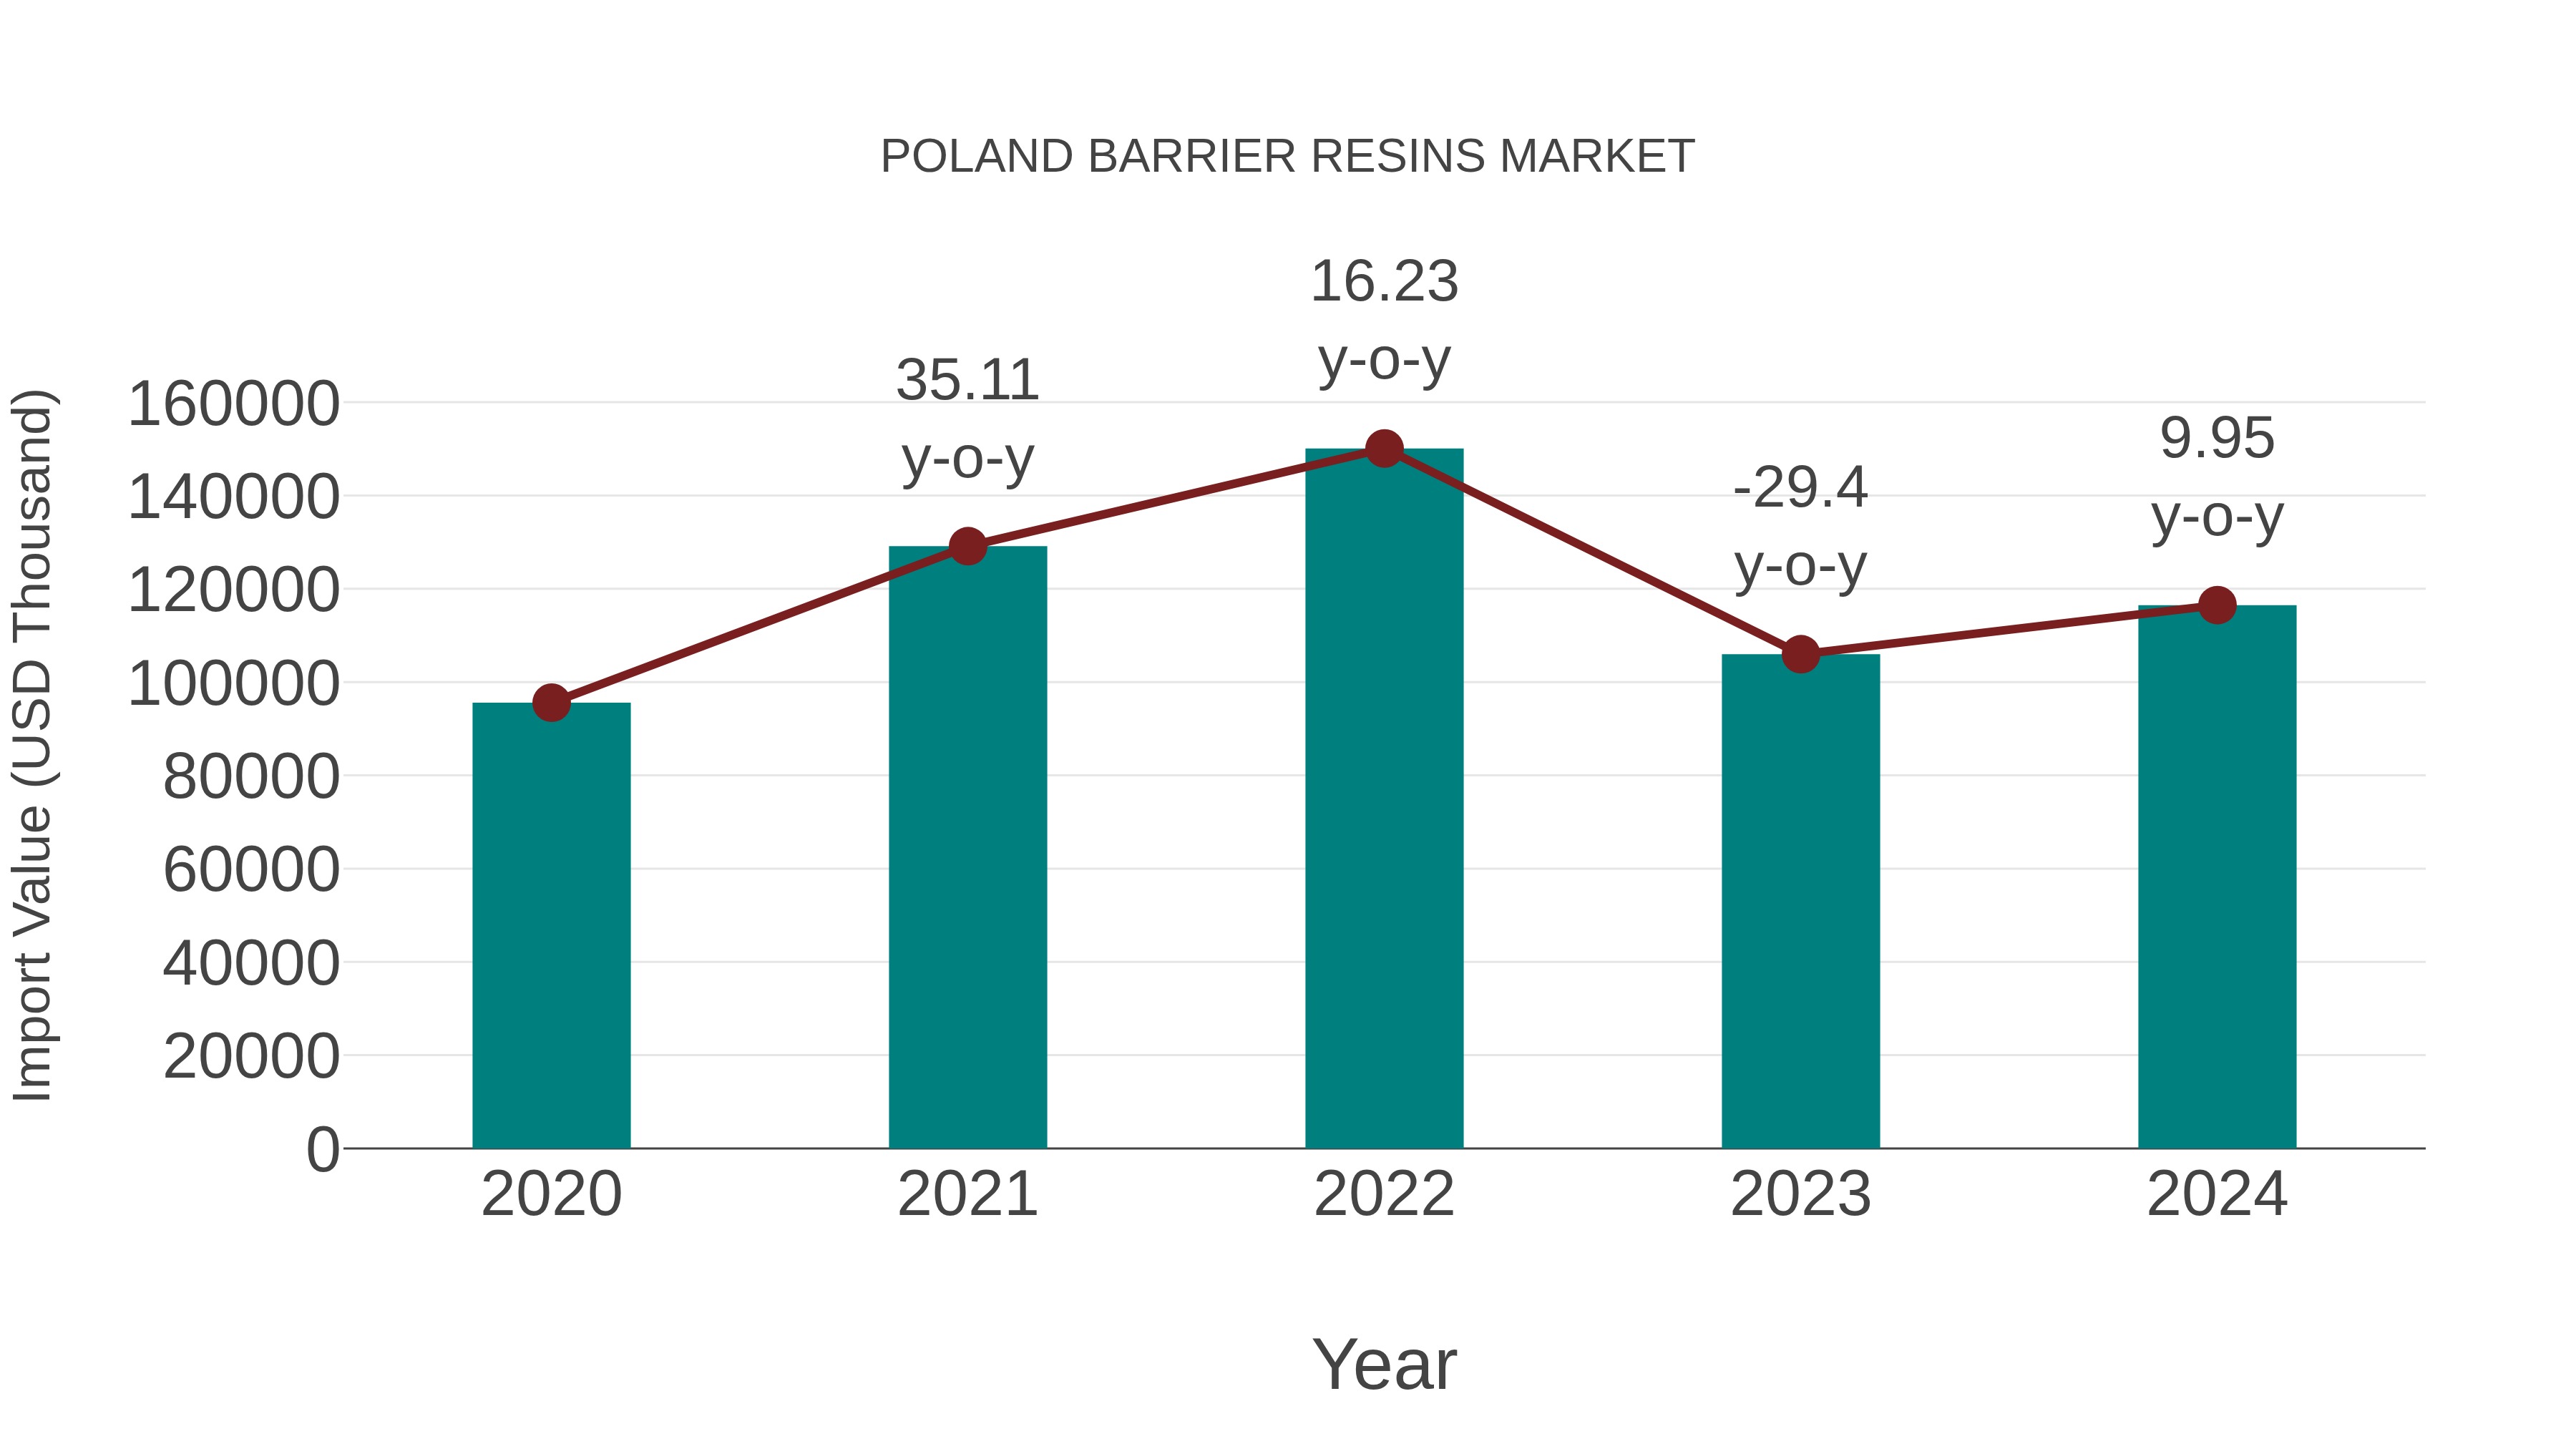
Poland Barrier Resins Market: Import Trend Analysis
In the Poland barrier resins market, the import trend exhibited a notable growth rate of 9.95% from 2023 to 2024, with a compound annual growth rate (CAGR) of 5.07% for the period 2020-2024. This uptrend in imports can be attributed to a consistent demand shift towards high-quality barrier resins, indicating stable market conditions and sustained industry demand during the period.
Poland Barrier Resins Market Overview
In the Poland Barrier Resins Market, demand is driven by the packaging industry, particularly for food and beverages. Barrier resins are valued for their ability to provide oxygen and moisture resistance, helping to preserve the freshness and extend the shelf life of packaged goods.
Drivers of the market
The barrier resins market in Poland is influenced by the demand for enhanced protection and preservation in packaging applications. Barrier resins are used to prevent the ingress of moisture, oxygen, and other contaminants, extending the shelf life of packaged products. The growth in the food and beverage industry, along with advancements in packaging technologies, drives the demand for barrier resins. The increasing focus on sustainable and high-performance packaging solutions supports market expansion. Technological innovations and the need for improved product protection contribute to market growth.
Challenges of the market
The barrier resins market in Poland is constrained by increasing raw material costs and environmental regulations that favor sustainable alternatives to plastic packaging. Companies in the market are under pressure to develop resins that offer high-performance barrier properties while also being recyclable or biodegradable. This drive for innovation increases research and development costs, which can be prohibitive for smaller players.
Government Policy of the market
Government policies in Poland affecting the barrier resins market focus on environmental protection and sustainability. Regulations on the use of resins in packaging and coatings emphasize the need for environmentally friendly materials that reduce waste and enhance recycling. Compliance with EU directives on packaging waste and chemical safety influences market trends. Additionally, government incentives for research and development in barrier resin technologies drive innovation and market growth.
Key Highlights of the Report:
- Poland Barrier Resins Market Outlook
- Market Size of Poland Barrier Resins Market, 2025
- Forecast of Poland Barrier Resins Market, 2032
- Historical Data and Forecast of Poland Barrier Resins Revenues & Volume for the Period 2022-2032F
- Poland Barrier Resins Market Trend Evolution
- Poland Barrier Resins Market Drivers and Challenges
- Poland Barrier Resins Price Trends
- Poland Barrier Resins Porter's Five Forces
- Poland Barrier Resins Industry Life Cycle
- Historical Data and Forecast of Poland Barrier Resins Market Revenues & Volume By Type for the Period 2022-2032F
- Historical Data and Forecast of Poland Barrier Resins Market Revenues & Volume By PVDC for the Period 2022-2032F
- Historical Data and Forecast of Poland Barrier Resins Market Revenues & Volume By EVOH for the Period 2022-2032F
- Historical Data and Forecast of Poland Barrier Resins Market Revenues & Volume By PEN for the Period 2022-2032F
- Historical Data and Forecast of Poland Barrier Resins Market Revenues & Volume By End Use Industry for the Period 2022-2032F
- Historical Data and Forecast of Poland Barrier Resins Market Revenues & Volume By Food & Beverage for the Period 2022-2032F
- Historical Data and Forecast of Poland Barrier Resins Market Revenues & Volume By Pharmaceutical & Medical for the Period 2022-2032F
- Historical Data and Forecast of Poland Barrier Resins Market Revenues & Volume By Cosmetics for the Period 2022-2032F
- Historical Data and Forecast of Poland Barrier Resins Market Revenues & Volume By Agriculture for the Period 2022-2032F
- Historical Data and Forecast of Poland Barrier Resins Market Revenues & Volume By Industrial for the Period 2022-2032F
- Poland Barrier Resins Import Export Trade Statistics
- Market Opportunity Assessment By Type
- Market Opportunity Assessment By End Use Industry
- Poland Barrier Resins Top Companies Market Share
- Poland Barrier Resins Competitive Benchmarking By Technical and Operational Parameters
- Poland Barrier Resins Company Profiles
- Poland Barrier Resins Key Strategic Recommendations
Poland Barrier Resins Market (2026-2032): FAQs
6Wresearch actively monitors the Poland Barrier Resins Market and publishes its comprehensive annual report, highlighting emerging trends, growth drivers, revenue analysis, and forecast outlook. Our insights help businesses to make data-backed strategic decisions with ongoing market dynamics. Our analysts track relevent industries related to the Poland Barrier Resins Market, allowing our clients with actionable intelligence and reliable forecasts tailored to emerging regional needs.
Yes, we provide customisation as per your requirements. To learn more, feel free to contact us on sales@6wresearch.com
1 Executive Summary |
2 Introduction |
2.1 Key Highlights of the Report |
2.2 Report Description |
2.3 Market Scope & Segmentation |
2.4 Research Methodology |
2.5 Assumptions |
3 Poland Barrier Resins Market Overview |
3.1 Poland Country Macro Economic Indicators |
3.2 Poland Barrier Resins Market Revenues & Volume, 2022 & 2032F |
3.3 Poland Barrier Resins Market - Industry Life Cycle |
3.4 Poland Barrier Resins Market - Porter's Five Forces |
3.5 Poland Barrier Resins Market Revenues & Volume Share, By Type, 2022 & 2032F |
3.6 Poland Barrier Resins Market Revenues & Volume Share, By End Use Industry, 2022 & 2032F |
4 Poland Barrier Resins Market Dynamics |
4.1 Impact Analysis |
4.2 Market Drivers |
4.2.1 Increasing demand for barrier resins in the food packaging industry due to rising concerns about food safety and quality. |
4.2.2 Growing adoption of barrier resins in the pharmaceutical sector for drug packaging to ensure product integrity and shelf life. |
4.2.3 Technological advancements leading to the development of high-performance barrier resins with improved barrier properties and sustainability features. |
4.3 Market Restraints |
4.3.1 Fluctuating raw material prices impacting the overall production cost of barrier resins. |
4.3.2 Stringent regulations and compliance standards related to the use of barrier resins in packaging applications. |
4.3.3 Intense competition in the market leading to pricing pressures and margin constraints for barrier resin manufacturers. |
5 Poland Barrier Resins Market Trends |
6 Poland Barrier Resins Market, By Types |
6.1 Poland Barrier Resins Market, By Type |
6.1.1 Overview and Analysis |
6.1.2 Poland Barrier Resins Market Revenues & Volume, By Type, 2022 - 2032F |
6.1.3 Poland Barrier Resins Market Revenues & Volume, By PVDC, 2022 - 2032F |
6.1.4 Poland Barrier Resins Market Revenues & Volume, By EVOH, 2022 - 2032F |
6.1.5 Poland Barrier Resins Market Revenues & Volume, By PEN, 2022 - 2032F |
6.2 Poland Barrier Resins Market, By End Use Industry |
6.2.1 Overview and Analysis |
6.2.2 Poland Barrier Resins Market Revenues & Volume, By Food & Beverage, 2022 - 2032F |
6.2.3 Poland Barrier Resins Market Revenues & Volume, By Pharmaceutical & Medical, 2022 - 2032F |
6.2.4 Poland Barrier Resins Market Revenues & Volume, By Cosmetics, 2022 - 2032F |
6.2.5 Poland Barrier Resins Market Revenues & Volume, By Agriculture, 2022 - 2032F |
6.2.6 Poland Barrier Resins Market Revenues & Volume, By Industrial, 2022 - 2032F |
7 Poland Barrier Resins Market Import-Export Trade Statistics |
7.1 Poland Barrier Resins Market Export to Major Countries |
7.2 Poland Barrier Resins Market Imports from Major Countries |
8 Poland Barrier Resins Market Key Performance Indicators |
8.1 Research and development investment in barrier resin technology to track innovation and product advancement. |
8.2 Environmental impact metrics such as carbon footprint reduction and recyclability rates of barrier resins. |
8.3 Customer satisfaction and loyalty scores to gauge market acceptance and demand for barrier resin products. |
9 Poland Barrier Resins Market - Opportunity Assessment |
9.1 Poland Barrier Resins Market Opportunity Assessment, By Type, 2022 & 2032F |
9.2 Poland Barrier Resins Market Opportunity Assessment, By End Use Industry, 2022 & 2032F |
10 Poland Barrier Resins Market - Competitive Landscape |
10.1 Poland Barrier Resins Market Revenue Share, By Companies, 2025 |
10.2 Poland Barrier Resins Market Competitive Benchmarking, By Operating and Technical Parameters |
11 Company Profiles |
12 Recommendations |
13 Disclaimer |
Global Go To Market Strategy - 2030
Export potential enables firms to identify high-growth global markets with greater confidence by combining advanced trade intelligence with a structured quantitative methodology. The framework analyzes emerging demand trends and country-level import patterns while integrating macroeconomic and trade datasets such as GDP and population forecasts, bilateral import–export flows, tariff structures, elasticity differentials between developed and developing economies, geographic distance, and import demand projections. Using weighted trade values from 2020–2024 as the base period to project country-to-country export potential for 2030, these inputs are operationalized through calculated drivers such as gravity model parameters, tariff impact factors, and projected GDP per-capita growth. Through an analysis of hidden potentials, demand hotspots, and market conditions that are most favorable to success, this method enables firms to focus on target countries, maximize returns, and global expansion with data, backed by accuracy.
By factoring in the projected importer demand gap that is currently unmet and could be potential opportunity, it identifies the potential for the Exporter (Country) among 190 countries, against the general trade analysis, which identifies the biggest importer or exporter.
To discover high-growth global markets and optimize your business strategy:
Click Here
Pricing
- Single User License$ 1,995
- Department License$ 2,400
- Site License$ 3,120
- Global License$ 3,795

Leadership Perspectives from Industry Events
Search
Thought Leadership and Analyst Meet


Our Clients
6WResearch In News
- India Export Attractiveness Tracker 2026
- India Air Conditioner Market Set for Strong Rebound in 2026 After Weather-Led Correction and GST-Driven Recovery: 6Wresearch
- ADAS in India: How Automatic Emergency Braking, Blind Spot Detection & Driver Monitoring are Transforming Road Safety
- Doha a strategic location for EV manufacturing hub: IPA Qatar
- Demand for luxury TVs surging in the GCC, says Samsung
- Empowering Growth: The Thriving Journey of Bangladesh’s Cable Industry
Latest Reports
- Nicaragua RPG Gaming Market (2026-2032)
- New Zealand RPG Gaming Market (2026-2032)
- Netherlands RPG Gaming Market (2026-2032)
- Nauru RPG Gaming Market (2026-2032)
- Namibia RPG Gaming Market (2026-2032)
- Mozambique RPG Gaming Market (2026-2032)
- Montenegro RPG Gaming Market (2026-2032)
- Mongolia RPG Gaming Market (2026-2032)
- Monaco RPG Gaming Market (2026-2032)
- Micronesia RPG Gaming Market (2026-2032)
Industry Events and Analyst Meet

EV India Expo 2026

HIMTEX 2026

India Refining Summit 2026

India EV Show 2026

EV tech India Expo 2026
Whitepaper
- Middle East & Africa Commercial Security Market Click here to view more.
- Middle East & Africa Fire Safety Systems & Equipment Market Click here to view more.
- GCC Drone Market Click here to view more.
- Middle East Lighting Fixture Market Click here to view more.
- GCC Physical & Perimeter Security Market Click here to view more.