Poland Cable Cars & Ropeways Market (2026-2032) Outlook | Revenue, Trends, Forecast, Value, Growth, Industry, Size, Companies, Share & Analysis
Market Forecast By Type (Tourism, Material handling, Public transportation, Mining industries), By Sales Channel (OEM (Original Equipment Manufacturer), Aftermarket) And Competitive Landscape
| Product Code: ETC285375 | Publication Date: Aug 2022 | Updated Date: Jul 2026 | Product Type: Market Research Report | |
| Publisher: 6Wresearch | Author: Sumit Sagar | No. of Pages: 75 | No. of Figures: 35 | No. of Tables: 20 |
Poland Cable Cars & Ropeways Market Size, Share & Growth Rate
The Poland Cable Cars & Ropeways Market was estimated at USD 471 Million in 2025 and is projected to reach USD 643 Million by 2032, growing at a CAGR of 4.5% from 2026 to 2032. This upward trend can be attributed to the surge in mountain tourism and recreational activities, as well as significant investments aimed at enhancing access to picturesque mountainous regions. The increasing integration of modern technology in cable car systems is also playing a pivotal role in attracting both domestic and international tourists.
Poland Cable Cars & Ropeways Market Year-wise Growth Rate and Key Drivers
This graph highlights how the Poland Cable Cars & Ropeways Market has steadily grown over the years, supported by major growth factors.
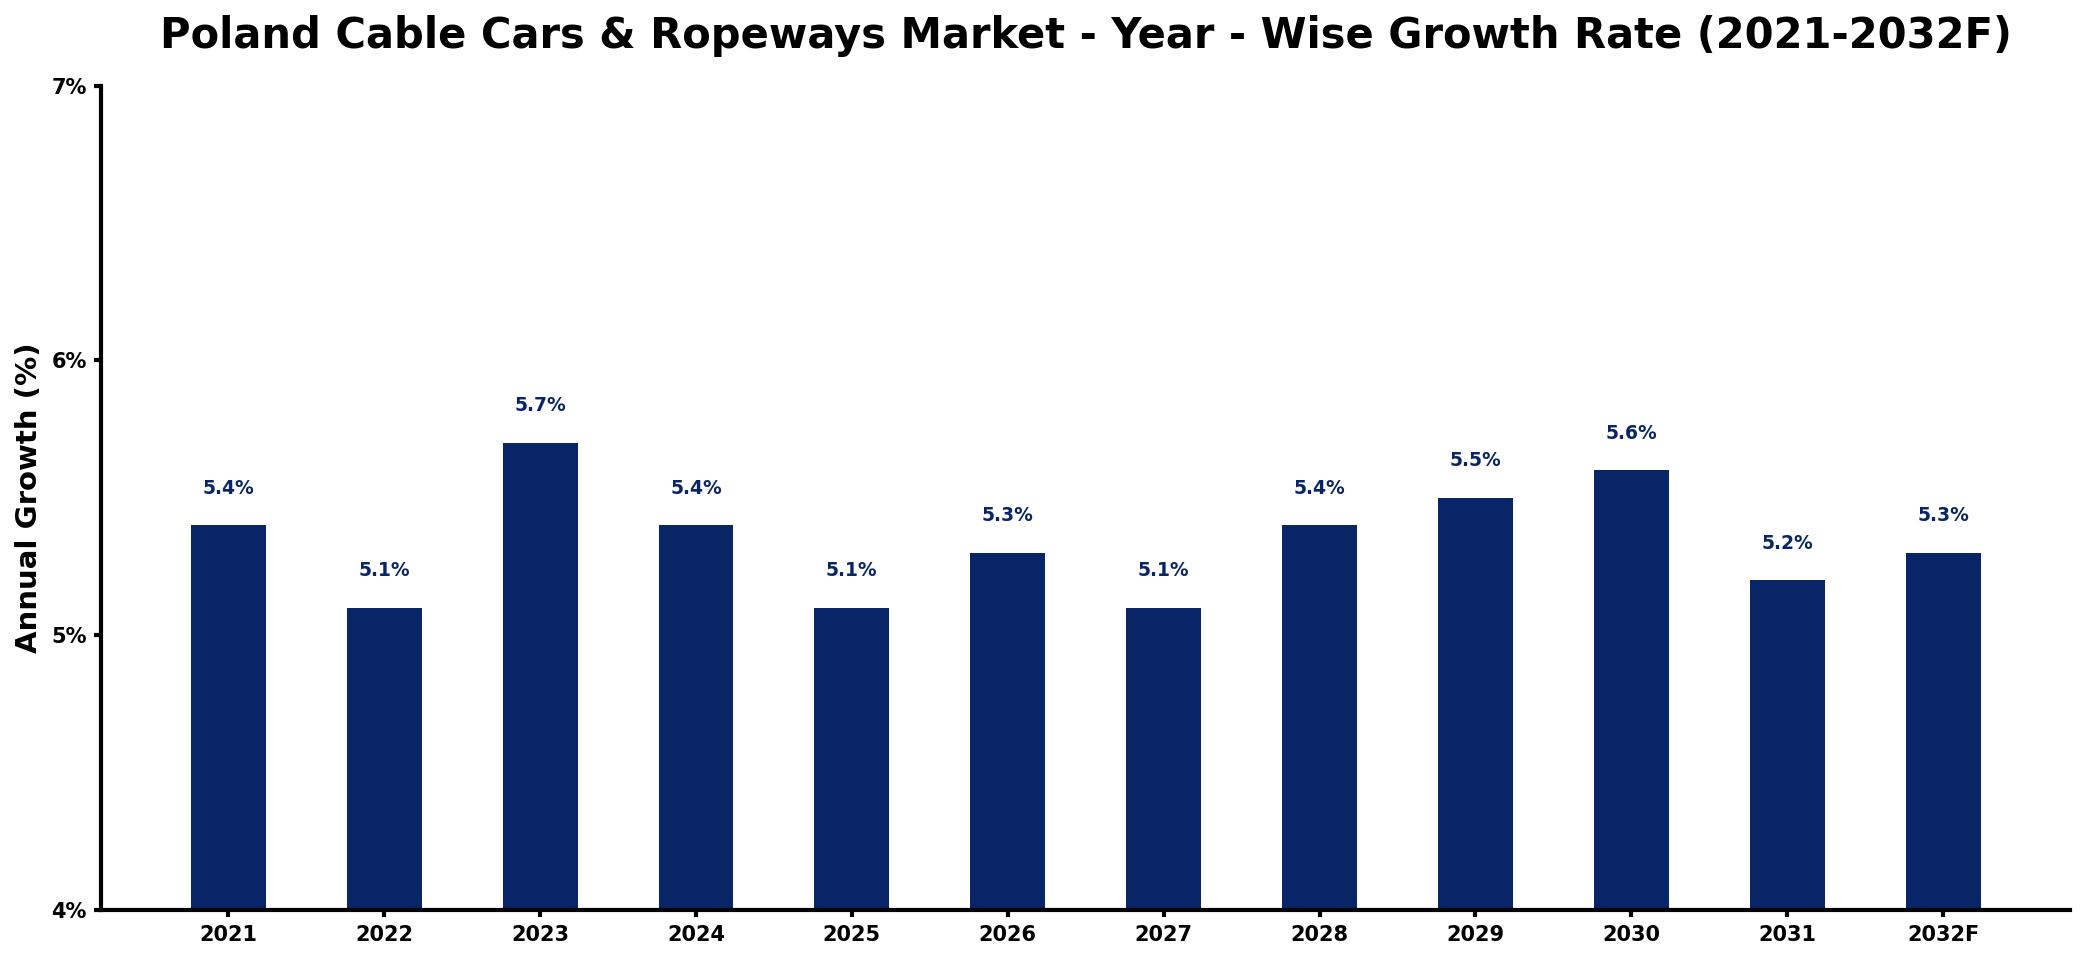
The table below presents the year‑wise growth rates along with the key drivers influencing the market
| Year | Growth Rate | Major Drivers |
| 2021 | 5.4% | Increased tourism during summer season |
| 2022 | 5.1% | Growing investments in infrastructure projects |
| 2023 | 5.7% | Rising demand for adventure activities |
| 2024 | 5.4% | Expansion of winter sports facilities |
| 2025 | 5.1% | Increased focus on eco-friendly transport |
| 2026 | 5.3% | Growing popularity of scenic views |
| 2027 | 5.1% | Enhanced accessibility to remote areas |
| 2028 | 5.4% | Investment in leisure and recreation |
| 2029 | 5.5% | Increased local and international tourism |
| 2030 | 5.6% | Growing demand for unique experiences |
| 2031 | 5.2% | growing downstream application demand |
| 2032 | 5.3% | rising end-use demand growth |
Note: Market size estimations and growth projections presented in this report are based on 6Wresearch's proprietary forecasting methodology, utilizing the latest available industry data, government publications, and primary research inputs.
Poland Cable Cars & Ropeways Market Synopsis
In Poland, the demand for cable cars and ropeways is driven primarily by the need for efficient transportation to scenic and remote areas, especially during peak tourist seasons. Regions such as the Tatra Mountains are becoming increasingly accessible, enhancing the attractiveness of outdoor recreational activities like skiing and hiking.
Additionally, urban areas are witnessing a growing preference for cable cars as an alternative mode of transport. This trend not only alleviates road congestion but also offers a unique urban sightseeing experience, highlighting the dual role of cable cars in both tourism and daily commuting.
- The market is projected to grow from USD 471 Million in 2025 to USD 643 Million by 2032.
- Technological advancements are enhancing safety and operational efficiency across cable car systems.
- There is a growing emphasis on eco-friendly practices, aligning with global sustainable tourism trends.
- Regulatory frameworks are evolving to support safety standards and environmental considerations.
- Investment opportunities abound in infrastructure development and digital technology integration.
Despite the optimistic growth trajectory, the Poland Cable Cars & Ropeways Market is confronted with notable constraints. Regulatory hurdles, particularly in securing construction permits in environmentally sensitive locations, can impede project timelines. The high upfront investment associated with cable car infrastructure and the limited availability of optimal installation sites further complicate market expansion. Seasonality in tourist traffic also leads to variability in revenue streams, making financial forecasting more challenging for operators.
Several key trends are shaping the Poland Cable Cars & Ropeways Market. The installation of modern, technologically sophisticated systems is on the rise, aimed at enhancing the overall visitor experience and ensuring safety compliance. Additionally, sustainable practices, including energy-efficient designs, are gaining traction as operators strive to reduce their environmental footprint. The integration of digital technologies, such as smart ticketing and real-time monitoring, is becoming commonplace, leading to improved operational efficiency and customer satisfaction.
Investors have a wealth of opportunities in the Poland Cable Cars & Ropeways Market. Expanding existing cable car networks and developing new infrastructure can substantially improve access to key tourist attractions. Furthermore, the emphasis on sustainable tourism opens avenues for investment in eco-friendly cable car designs and state-of-the-art digital ticketing solutions. Government initiatives to promote tourism and infrastructure enhancement present additional incentives for strategic investment in this burgeoning sector.
The Polish government has established several policies focused on safety, environmental protection, and infrastructure development within the cable cars and ropeways sector. Stringent safety regulations ensure that operators meet high standards for maintenance and passenger safety. Environmental impact assessments are mandated for new installations, promoting responsible development practices. Additionally, public funding initiatives aim to modernize and expand cable car networks, underscoring the government's commitment to enhancing tourism and transportation in mountainous areas.
Looking ahead to 2026-2032, the Poland Cable Cars & Ropeways Market is set for robust growth. Increasing tourism activities and a heightened interest in outdoor recreation will drive demand for expanded cable car routes and systems. Ongoing government efforts to improve infrastructure will likely catalyze further investments, while advancements in eco-friendly technologies will align with the global shift towards sustainability. Overall, a favorable regulatory environment combined with rising disposable incomes among the populace presents a promising outlook for the market.
In recent months, the Poland Cable Cars & Ropeways Market has witnessed a surge in initiatives aimed at enhancing user experience and operational efficiency. There is a notable increase in investments in digital solutions, focusing on smart ticketing systems and enhanced monitoring technologies. Additionally, several regions are exploring expansion plans for existing networks, aiming to cater to the rising influx of tourists in key areas. These developments reflect the industry's responsiveness to evolving consumer needs and market dynamics.
- 10 Years of Market Numbers
- Historical Data Starting from 2022 to 2025
- Base Year: 2025
- Forecast Data until 2032
- Key Performance Indicators Impacting the Market
- Major Upcoming Developments and Projects
Key Highlights of the Report:
- Poland Cable Cars & Ropeways Market Outlook
- Market Size of Poland Cable Cars & Ropeways Market, 2025
- Forecast of Poland Cable Cars & Ropeways Market, 2032
- Historical Data and Forecast of Poland Cable Cars & Ropeways Revenues & Volume for the Period 2022-2032F
- Poland Cable Cars & Ropeways Market Trend Evolution
- Poland Cable Cars & Ropeways Market Drivers and Challenges
- Poland Cable Cars & Ropeways Price Trends
- Poland Cable Cars & Ropeways Porter's Five Forces
- Poland Cable Cars & Ropeways Industry Life Cycle
- Historical Data and Forecast of Poland Cable Cars & Ropeways Market Revenues & Volume By Type for the Period 2022-2032F
- Historical Data and Forecast of Poland Cable Cars & Ropeways Market Revenues & Volume By Tourism for the Period 2022-2032F
- Historical Data and Forecast of Poland Cable Cars & Ropeways Market Revenues & Volume By Material handling for the Period 2022-2032F
- Historical Data and Forecast of Poland Cable Cars & Ropeways Market Revenues & Volume By Public transportation for the Period 2022-2032F
- Historical Data and Forecast of Poland Cable Cars & Ropeways Market Revenues & Volume By Mining industries for the Period 2022-2032F
- Historical Data and Forecast of Poland Cable Cars & Ropeways Market Revenues & Volume By Sales Channel for the Period 2022-2032F
- Historical Data and Forecast of Poland Cable Cars & Ropeways Market Revenues & Volume By OEM (Original Equipment Manufacturer) for the Period 2022-2032F
- Historical Data and Forecast of Poland Cable Cars & Ropeways Market Revenues & Volume By Aftermarket for the Period 2022-2032F
- Poland Cable Cars & Ropeways Import Export Trade Statistics
- Market Opportunity Assessment By Type
- Market Opportunity Assessment By Sales Channel
- Poland Cable Cars & Ropeways Top Companies Market Share
- Poland Cable Cars & Ropeways Competitive Benchmarking By Technical and Operational Parameters
- Poland Cable Cars & Ropeways Company Profiles
- Poland Cable Cars & Ropeways Key Strategic Recommendations
Frequently Asked Questions About the Market Study (FAQs):
The growth is largely fueled by increasing tourism in mountainous regions and the demand for efficient transportation solutions. The modern infrastructure and advanced technologies being deployed also enhance the appeal of these systems.
The Poland Cable Cars & Ropeways Market was estimated at USD 471 Million in 2025 and is projected to reach USD 643 Million by 2032, growing at a CAGR of 4.5% from 2026 to 2032.
Technology is revolutionizing the market with modern systems that improve safety and efficiency, as well as the adoption of smart ticketing solutions that streamline the passenger experience.
There is a growing emphasis on eco-friendly designs and operational practices aimed at reducing the environmental impact of cable car operations, aligning with global sustainability trends.
Government initiatives enhance market growth by providing regulatory support and funding for infrastructure developments, ensuring safety and promoting tourism in key regions.
6Wresearch actively monitors the Poland Cable Cars & Ropeways Market and publishes its comprehensive annual report, highlighting emerging trends, growth drivers, revenue analysis, and forecast outlook. Our insights help businesses to make data-backed strategic decisions with ongoing market dynamics. Our analysts track relevent industries related to the Poland Cable Cars & Ropeways Market, allowing our clients with actionable intelligence and reliable forecasts tailored to emerging regional needs.
Yes, we provide customisation as per your requirements. To learn more, feel free to contact us on sales@6wresearch.com
1 Executive Summary |
2 Introduction |
2.1 Key Highlights of the Report |
2.2 Report Description |
2.3 Market Scope & Segmentation |
2.4 Research Methodology |
2.5 Assumptions |
3 Poland Cable Cars & Ropeways Market Overview |
3.1 Poland Country Macro Economic Indicators |
3.2 Poland Cable Cars & Ropeways Market Revenues & Volume, 2022 & 2032F |
3.3 Poland Cable Cars & Ropeways Market - Industry Life Cycle |
3.4 Poland Cable Cars & Ropeways Market - Porter's Five Forces |
3.5 Poland Cable Cars & Ropeways Market Revenues & Volume Share, By Type, 2022 & 2032F |
3.6 Poland Cable Cars & Ropeways Market Revenues & Volume Share, By Sales Channel, 2022 & 2032F |
4 Poland Cable Cars & Ropeways Market Dynamics |
4.1 Impact Analysis |
4.2 Market Drivers |
4.2.1 Increasing tourism in Poland |
4.2.2 Growing demand for recreational activities and adventure tourism |
4.2.3 Government investments in infrastructure development |
4.3 Market Restraints |
4.3.1 Seasonal variations in tourist footfall |
4.3.2 Regulatory challenges and approvals for new projects |
4.3.3 Environmental concerns and sustainability issues |
5 Poland Cable Cars & Ropeways Market Trends |
6 Poland Cable Cars & Ropeways Market, By Types |
6.1 Poland Cable Cars & Ropeways Market, By Type |
6.1.1 Overview and Analysis |
6.1.2 Poland Cable Cars & Ropeways Market Revenues & Volume, By Type, 2022-2032F |
6.1.3 Poland Cable Cars & Ropeways Market Revenues & Volume, By Tourism, 2022-2032F |
6.1.4 Poland Cable Cars & Ropeways Market Revenues & Volume, By Material handling, 2022-2032F |
6.1.5 Poland Cable Cars & Ropeways Market Revenues & Volume, By Public transportation, 2022-2032F |
6.1.6 Poland Cable Cars & Ropeways Market Revenues & Volume, By Mining industries, 2022-2032F |
6.2 Poland Cable Cars & Ropeways Market, By Sales Channel |
6.2.1 Overview and Analysis |
6.2.2 Poland Cable Cars & Ropeways Market Revenues & Volume, By OEM (Original Equipment Manufacturer), 2022-2032F |
6.2.3 Poland Cable Cars & Ropeways Market Revenues & Volume, By Aftermarket, 2022-2032F |
7 Poland Cable Cars & Ropeways Market Import-Export Trade Statistics |
7.1 Poland Cable Cars & Ropeways Market Export to Major Countries |
7.2 Poland Cable Cars & Ropeways Market Imports from Major Countries |
8 Poland Cable Cars & Ropeways Market Key Performance Indicators |
8.1 Average daily ridership |
8.2 Percentage of revenue from ticket sales during peak seasons |
8.3 Average waiting time for passengers at cable car stations |
8.4 Percentage of revenue from partnerships with tourism operators |
8.5 Number of new projects approved by regulatory authorities |
9 Poland Cable Cars & Ropeways Market - Opportunity Assessment |
9.1 Poland Cable Cars & Ropeways Market Opportunity Assessment, By Type, 2022 & 2032F |
9.2 Poland Cable Cars & Ropeways Market Opportunity Assessment, By Sales Channel, 2022 & 2032F |
10 Poland Cable Cars & Ropeways Market - Competitive Landscape |
10.1 Poland Cable Cars & Ropeways Market Revenue Share, By Companies, 2025 |
10.2 Poland Cable Cars & Ropeways Market Competitive Benchmarking, By Operating and Technical Parameters |
11 Company Profiles |
12 Recommendations |
13 Disclaimer |
Global Go To Market Strategy - 2030
Export potential enables firms to identify high-growth global markets with greater confidence by combining advanced trade intelligence with a structured quantitative methodology. The framework analyzes emerging demand trends and country-level import patterns while integrating macroeconomic and trade datasets such as GDP and population forecasts, bilateral import–export flows, tariff structures, elasticity differentials between developed and developing economies, geographic distance, and import demand projections. Using weighted trade values from 2020–2024 as the base period to project country-to-country export potential for 2030, these inputs are operationalized through calculated drivers such as gravity model parameters, tariff impact factors, and projected GDP per-capita growth. Through an analysis of hidden potentials, demand hotspots, and market conditions that are most favorable to success, this method enables firms to focus on target countries, maximize returns, and global expansion with data, backed by accuracy.
By factoring in the projected importer demand gap that is currently unmet and could be potential opportunity, it identifies the potential for the Exporter (Country) among 190 countries, against the general trade analysis, which identifies the biggest importer or exporter.
To discover high-growth global markets and optimize your business strategy:
Click Here
Pricing
- Single User License$ 1,995
- Department License$ 2,400
- Site License$ 3,120
- Global License$ 3,795

Leadership Perspectives from Industry Events
Search
Thought Leadership and Analyst Meet


Our Clients
6WResearch In News
- India Air Conditioner Market Set for Strong Rebound in 2026 After Weather-Led Correction and GST-Driven Recovery: 6Wresearch
- ADAS in India: How Automatic Emergency Braking, Blind Spot Detection & Driver Monitoring are Transforming Road Safety
- Doha a strategic location for EV manufacturing hub: IPA Qatar
- Demand for luxury TVs surging in the GCC, says Samsung
- Empowering Growth: The Thriving Journey of Bangladesh’s Cable Industry
- Demand for luxury TVs surging in the GCC, says Samsung
Latest Reports
- Nicaragua RPG Gaming Market (2026-2032)
- New Zealand RPG Gaming Market (2026-2032)
- Netherlands RPG Gaming Market (2026-2032)
- Nauru RPG Gaming Market (2026-2032)
- Namibia RPG Gaming Market (2026-2032)
- Mozambique RPG Gaming Market (2026-2032)
- Montenegro RPG Gaming Market (2026-2032)
- Mongolia RPG Gaming Market (2026-2032)
- Monaco RPG Gaming Market (2026-2032)
- Micronesia RPG Gaming Market (2026-2032)
Industry Events and Analyst Meet

EV India Expo 2026

HIMTEX 2026

India Refining Summit 2026

India EV Show 2026

EV tech India Expo 2026
Whitepaper
- Middle East & Africa Commercial Security Market Click here to view more.
- Middle East & Africa Fire Safety Systems & Equipment Market Click here to view more.
- GCC Drone Market Click here to view more.
- Middle East Lighting Fixture Market Click here to view more.
- GCC Physical & Perimeter Security Market Click here to view more.