Poland Carbonated Beverages Market (2026-2032) | Growth, Size, Analysis, Industry, Outlook, Value, Companies, Trends, Share, Revenue, COVID-19 IMPACT & Forecast
Market Forecast By Product Types (Soft Drinks, Carbonated Water, Sports & Energy Drinks, Others), By Flavour (Cola, Fruit Based, Others), By Distribution Channel (Hypermarkets & Supermarkets, Convenience Stores, Food Service Outlets, Transport Terminals, Online Stores & D2C) And Competitive Landscape
| Product Code: ETC038876 | Publication Date: Jan 2021 | Updated Date: Mar 2026 | Product Type: Report | |
| Publisher: 6Wresearch | Author: Ravi Bhandari | No. of Pages: 70 | No. of Figures: 35 | No. of Tables: 5 |
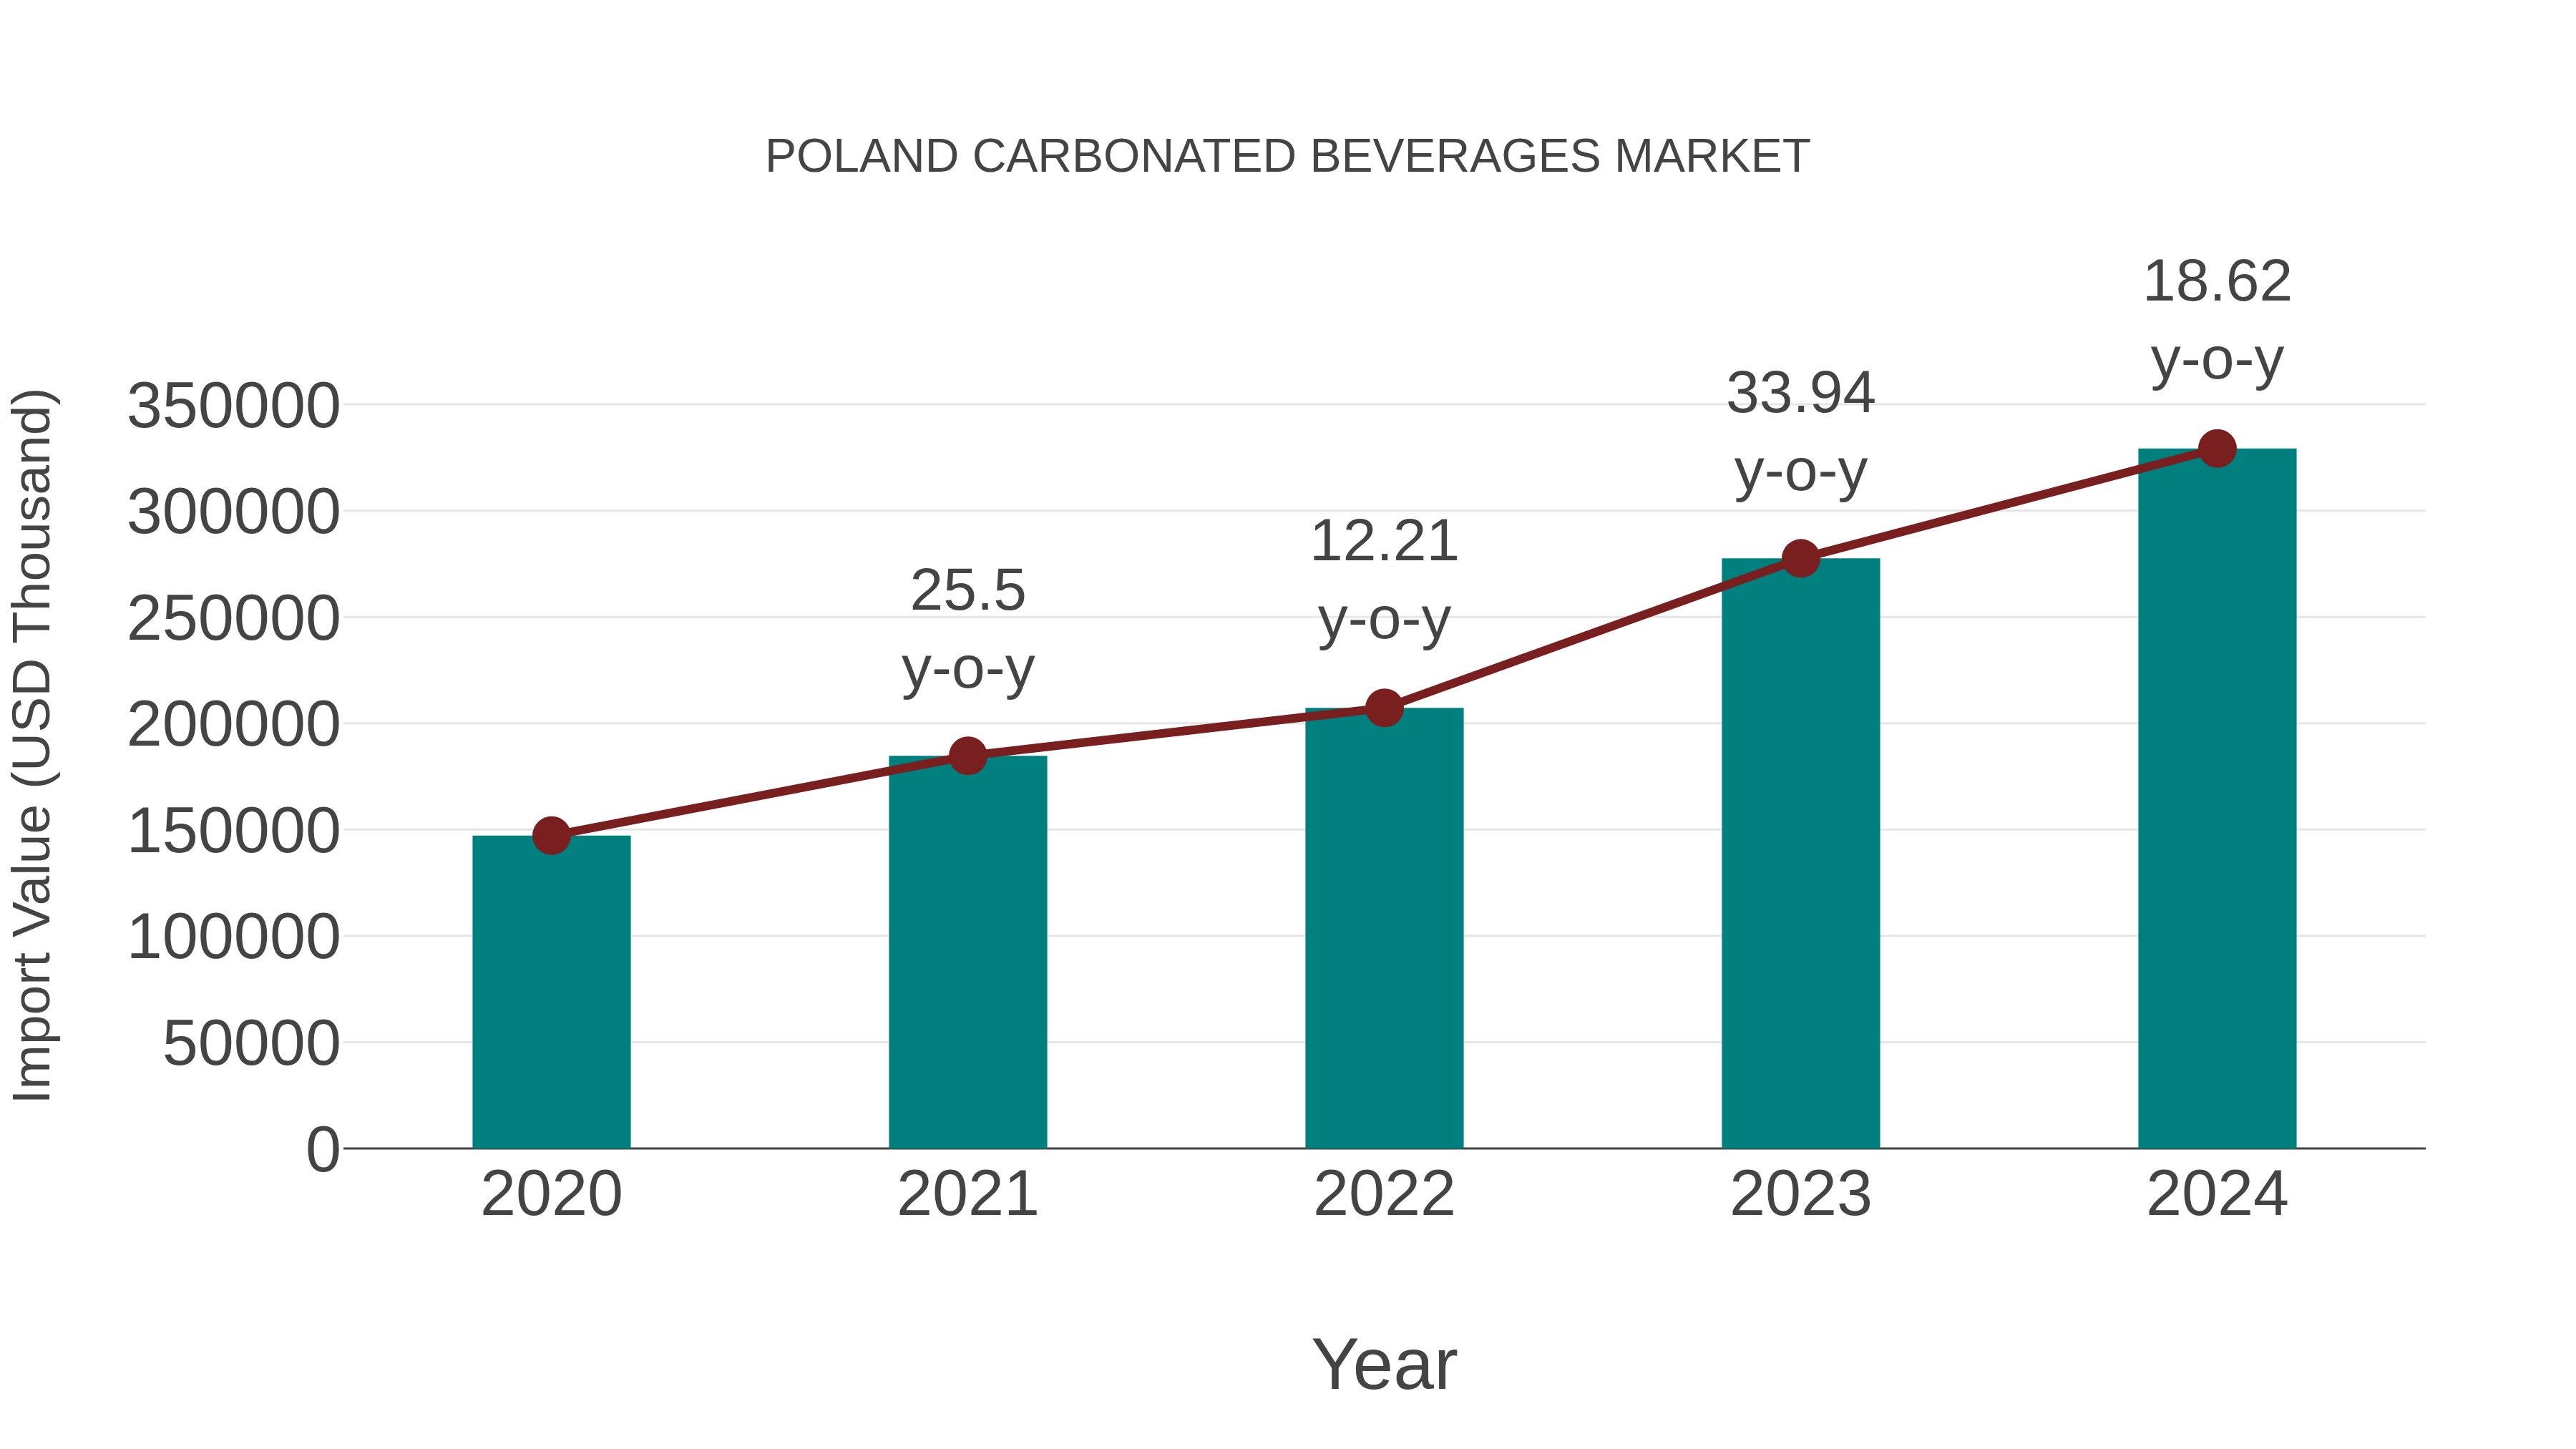
Poland Carbonated Beverages Market: Import Trend Analysis
In the Poland carbonated beverages market, the import trend showed a notable growth rate of 18.62% from 2023 to 2024, with a compound annual growth rate (CAGR) of 22.3% from 2020 to 2024. This surge in imports can be attributed to shifting consumer preferences towards a wider variety of beverages and increased demand for international brands in the market.
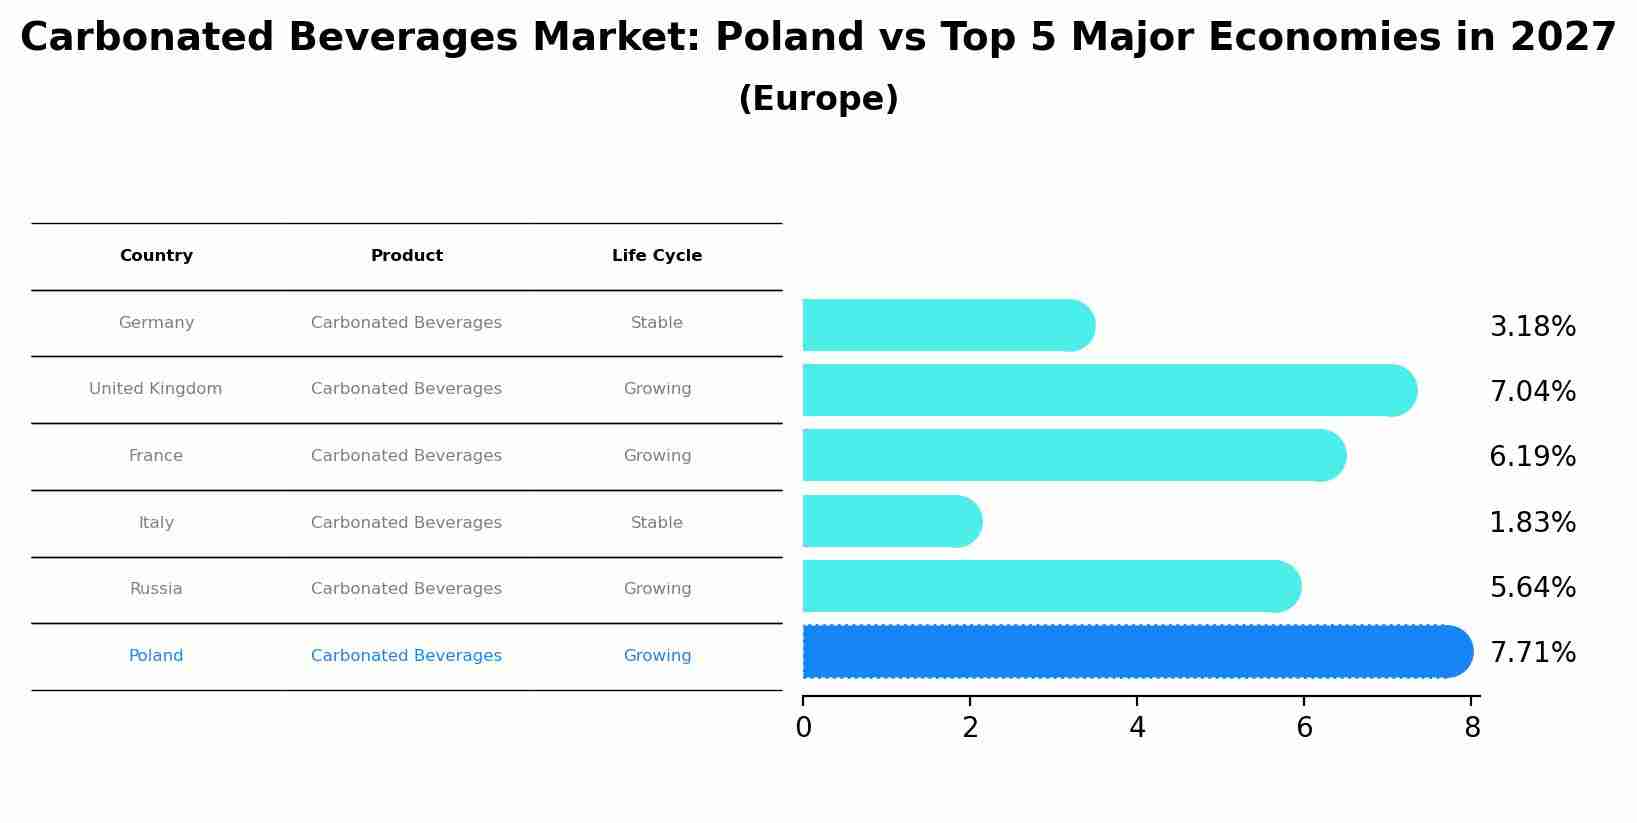
Carbonated Beverages Market: Poland vs Top 5 Major Economies in 2027 (Europe)
In the Europe region, the Carbonated Beverages market in Poland is projected to expand at a growing growth rate of 7.71% by 2027. The largest economy is Germany, followed by United Kingdom, France, Italy and Russia.
Poland Carbonated Beverages Market Overview
The Poland Carbonated Beverages Market is seeing steady growth due to the popularity of soft drinks, flavored carbonated water, and energy drinks. As consumer preferences evolve towards healthier options, manufacturers are also focusing on low-calorie and sugar-free variants.
Drivers of the market
The carbonated beverages market in Poland benefits from the widespread consumption of soft drinks, sparkling waters, and flavored sodas. The market is influenced by changing consumer preferences, including the demand for healthier and low-calorie options. The growth in the beverage industry, coupled with innovations in product formulations and packaging, drives market demand. Additionally, the rise in premium and artisanal carbonated beverages, along with marketing strategies targeting diverse consumer segments, supports market expansion.
Challenges of the market
Polands carbonated beverages market faces challenges from increasing health consciousness among consumers, leading to a decline in the consumption of sugary drinks. The market is also impacted by growing government regulations on sugar content and advertising, which add compliance costs for manufacturers. Additionally, competition from healthier beverage alternatives, such as flavored water and juices, limits market growth.
Government Policy of the market
The carbonated beverages market in Poland is shaped by regulations focused on food safety, labeling, and environmental sustainability. Government policies ensure that carbonated beverages comply with EU standards on product safety and consumer information. Regulations on packaging and waste management influence market practices. Government support for innovations in beverage formulation and sustainable packaging technologies impacts market dynamics.
Key Highlights of the Report:
- Poland Carbonated Beverages Market Outlook
- Market Size of Poland Carbonated Beverages Market, 2025
- Forecast of Poland Carbonated Beverages Market, 2032
- Historical Data and Forecast of Poland Carbonated Beverages Revenues & Volume for the Period 2022-2032F
- Poland Carbonated Beverages Market Trend Evolution
- Poland Carbonated Beverages Market Drivers and Challenges
- Poland Carbonated Beverages Price Trends
- Poland Carbonated Beverages Porter's Five Forces
- Poland Carbonated Beverages Industry Life Cycle
- Historical Data and Forecast of Poland Carbonated Beverages Market Revenues & Volume By Product Types for the Period 2022-2032F
- Historical Data and Forecast of Poland Carbonated Beverages Market Revenues & Volume By Soft Drinks for the Period 2022-2032F
- Historical Data and Forecast of Poland Carbonated Beverages Market Revenues & Volume By Carbonated Water for the Period 2022-2032F
- Historical Data and Forecast of Poland Carbonated Beverages Market Revenues & Volume By Sports & Energy Drinks for the Period 2022-2032F
- Historical Data and Forecast of Poland Carbonated Beverages Market Revenues & Volume By Others for the Period 2022-2032F
- Historical Data and Forecast of Poland Carbonated Beverages Market Revenues & Volume By Flavour for the Period 2022-2032F
- Historical Data and Forecast of Poland Carbonated Beverages Market Revenues & Volume By Cola for the Period 2022-2032F
- Historical Data and Forecast of Poland Carbonated Beverages Market Revenues & Volume By Fruit Based for the Period 2022-2032F
- Historical Data and Forecast of Poland Carbonated Beverages Market Revenues & Volume By Others for the Period 2022-2032F
- Historical Data and Forecast of Poland Carbonated Beverages Market Revenues & Volume By Distribution Channel for the Period 2022-2032F
- Historical Data and Forecast of Poland Carbonated Beverages Market Revenues & Volume By Hypermarkets & Supermarkets for the Period 2022-2032F
- Historical Data and Forecast of Poland Carbonated Beverages Market Revenues & Volume By Convenience Stores for the Period 2022-2032F
- Historical Data and Forecast of Poland Carbonated Beverages Market Revenues & Volume By Food Service Outlets for the Period 2022-2032F
- Historical Data and Forecast of Poland Carbonated Beverages Market Revenues & Volume By Transport Terminals for the Period 2022-2032F
- Historical Data and Forecast of Poland Carbonated Beverages Market Revenues & Volume By Online Stores & D2C for the Period 2022-2032F
- Poland Carbonated Beverages Import Export Trade Statistics
- Market Opportunity Assessment By Product Types
- Market Opportunity Assessment By Flavour
- Market Opportunity Assessment By Distribution Channel
- Poland Carbonated Beverages Top Companies Market Share
- Poland Carbonated Beverages Competitive Benchmarking By Technical and Operational Parameters
- Poland Carbonated Beverages Company Profiles
- Poland Carbonated Beverages Key Strategic Recommendations
Poland Carbonated Beverages Market (2026-2032): FAQs
6Wresearch actively monitors the Poland Carbonated Beverages Market and publishes its comprehensive annual report, highlighting emerging trends, growth drivers, revenue analysis, and forecast outlook. Our insights help businesses to make data-backed strategic decisions with ongoing market dynamics. Our analysts track relevent industries related to the Poland Carbonated Beverages Market, allowing our clients with actionable intelligence and reliable forecasts tailored to emerging regional needs.
Yes, we provide customisation as per your requirements. To learn more, feel free to contact us on sales@6wresearch.com
1 Executive Summary |
2 Introduction |
2.1 Key Highlights of the Report |
2.2 Report Description |
2.3 Market Scope & Segmentation |
2.4 Research Methodology |
2.5 Assumptions |
3 Poland Carbonated Beverages Market Overview |
3.1 Poland Country Macro Economic Indicators |
3.2 Poland Carbonated Beverages Market Revenues & Volume, 2022 & 2032F |
3.3 Poland Carbonated Beverages Market - Industry Life Cycle |
3.4 Poland Carbonated Beverages Market - Porter's Five Forces |
3.5 Poland Carbonated Beverages Market Revenues & Volume Share, By Product Types, 2022 & 2032F |
3.6 Poland Carbonated Beverages Market Revenues & Volume Share, By Flavour, 2022 & 2032F |
3.7 Poland Carbonated Beverages Market Revenues & Volume Share, By Distribution Channel, 2022 & 2032F |
4 Poland Carbonated Beverages Market Dynamics |
4.1 Impact Analysis |
4.2 Market Drivers |
4.3 Market Restraints |
5 Poland Carbonated Beverages Market Trends |
6 Poland Carbonated Beverages Market, By Types |
6.1 Poland Carbonated Beverages Market, By Product Types |
6.1.1 Overview and Analysis |
6.1.2 Poland Carbonated Beverages Market Revenues & Volume, By Product Types, 2022-2032F |
6.1.3 Poland Carbonated Beverages Market Revenues & Volume, By Soft Drinks, 2022-2032F |
6.1.4 Poland Carbonated Beverages Market Revenues & Volume, By Carbonated Water, 2022-2032F |
6.1.5 Poland Carbonated Beverages Market Revenues & Volume, By Sports & Energy Drinks, 2022-2032F |
6.1.6 Poland Carbonated Beverages Market Revenues & Volume, By Others, 2022-2032F |
6.2 Poland Carbonated Beverages Market, By Flavour |
6.2.1 Overview and Analysis |
6.2.2 Poland Carbonated Beverages Market Revenues & Volume, By Cola, 2022-2032F |
6.2.3 Poland Carbonated Beverages Market Revenues & Volume, By Fruit Based, 2022-2032F |
6.2.4 Poland Carbonated Beverages Market Revenues & Volume, By Others, 2022-2032F |
6.3 Poland Carbonated Beverages Market, By Distribution Channel |
6.3.1 Overview and Analysis |
6.3.2 Poland Carbonated Beverages Market Revenues & Volume, By Hypermarkets & Supermarkets, 2022-2032F |
6.3.3 Poland Carbonated Beverages Market Revenues & Volume, By Convenience Stores, 2022-2032F |
6.3.4 Poland Carbonated Beverages Market Revenues & Volume, By Food Service Outlets, 2022-2032F |
6.3.5 Poland Carbonated Beverages Market Revenues & Volume, By Transport Terminals, 2022-2032F |
6.3.6 Poland Carbonated Beverages Market Revenues & Volume, By Online Stores & D2C, 2022-2032F |
7 Poland Carbonated Beverages Market Import-Export Trade Statistics |
7.1 Poland Carbonated Beverages Market Export to Major Countries |
7.2 Poland Carbonated Beverages Market Imports from Major Countries |
8 Poland Carbonated Beverages Market Key Performance Indicators |
9 Poland Carbonated Beverages Market - Opportunity Assessment |
9.1 Poland Carbonated Beverages Market Opportunity Assessment, By Product Types, 2022 & 2032F |
9.2 Poland Carbonated Beverages Market Opportunity Assessment, By Flavour, 2022 & 2032F |
9.3 Poland Carbonated Beverages Market Opportunity Assessment, By Distribution Channel, 2022 & 2032F |
10 Poland Carbonated Beverages Market - Competitive Landscape |
10.1 Poland Carbonated Beverages Market Revenue Share, By Companies, 2025 |
10.2 Poland Carbonated Beverages Market Competitive Benchmarking, By Operating and Technical Parameters |
11 Company Profiles |
12 Recommendations |
13 Disclaimer |
Global Go To Market Strategy - 2030
Export potential enables firms to identify high-growth global markets with greater confidence by combining advanced trade intelligence with a structured quantitative methodology. The framework analyzes emerging demand trends and country-level import patterns while integrating macroeconomic and trade datasets such as GDP and population forecasts, bilateral import–export flows, tariff structures, elasticity differentials between developed and developing economies, geographic distance, and import demand projections. Using weighted trade values from 2020–2024 as the base period to project country-to-country export potential for 2030, these inputs are operationalized through calculated drivers such as gravity model parameters, tariff impact factors, and projected GDP per-capita growth. Through an analysis of hidden potentials, demand hotspots, and market conditions that are most favorable to success, this method enables firms to focus on target countries, maximize returns, and global expansion with data, backed by accuracy.
By factoring in the projected importer demand gap that is currently unmet and could be potential opportunity, it identifies the potential for the Exporter (Country) among 190 countries, against the general trade analysis, which identifies the biggest importer or exporter.
To discover high-growth global markets and optimize your business strategy:
Click Here
Pricing
- Single User License$ 1,995
- Department License$ 2,400
- Site License$ 3,120
- Global License$ 3,795

Leadership Perspectives from Industry Events
Search
Thought Leadership and Analyst Meet


Our Clients
6WResearch In News
- India Air Conditioner Market Set for Strong Rebound in 2026 After Weather-Led Correction and GST-Driven Recovery: 6Wresearch
- ADAS in India: How Automatic Emergency Braking, Blind Spot Detection & Driver Monitoring are Transforming Road Safety
- Doha a strategic location for EV manufacturing hub: IPA Qatar
- Demand for luxury TVs surging in the GCC, says Samsung
- Empowering Growth: The Thriving Journey of Bangladesh’s Cable Industry
- Demand for luxury TVs surging in the GCC, says Samsung
Latest Reports
- Nicaragua RPG Gaming Market (2026-2032)
- New Zealand RPG Gaming Market (2026-2032)
- Netherlands RPG Gaming Market (2026-2032)
- Nauru RPG Gaming Market (2026-2032)
- Namibia RPG Gaming Market (2026-2032)
- Mozambique RPG Gaming Market (2026-2032)
- Montenegro RPG Gaming Market (2026-2032)
- Mongolia RPG Gaming Market (2026-2032)
- Monaco RPG Gaming Market (2026-2032)
- Micronesia RPG Gaming Market (2026-2032)
Industry Events and Analyst Meet

HIMTEX 2026

India Refining Summit 2026

India EV Show 2026

EV tech India Expo 2026

Auto Tech Asia 2026
Whitepaper
- Middle East & Africa Commercial Security Market Click here to view more.
- Middle East & Africa Fire Safety Systems & Equipment Market Click here to view more.
- GCC Drone Market Click here to view more.
- Middle East Lighting Fixture Market Click here to view more.
- GCC Physical & Perimeter Security Market Click here to view more.