Portugal Lanolin Market (2026-2032) | Forecast, Growth, Size, Trends, Segmentation, Share, Outlook, Analysis, Value, Companies, Industry & Revenue
Market Forecast By Application (Personal Care & Cosmetics, BaCare Products, Pharmaceuticals, Industrial, Others), By Derivative (Lanolin alcohol, Cholesterin, Isopropyl Lanolate, Laneth, Lanogene, Lanosterols, Quaternium 33, Others) And Competitive Landscape
| Product Code: ETC5016847 | Publication Date: Nov 2023 | Updated Date: Apr 2026 | Product Type: Market Research Report | |
| Publisher: 6Wresearch | Author: Shubham Padhi | No. of Pages: 60 | No. of Figures: 30 | No. of Tables: 5 |
Portugal Lanolin Market Size (2020-2030)
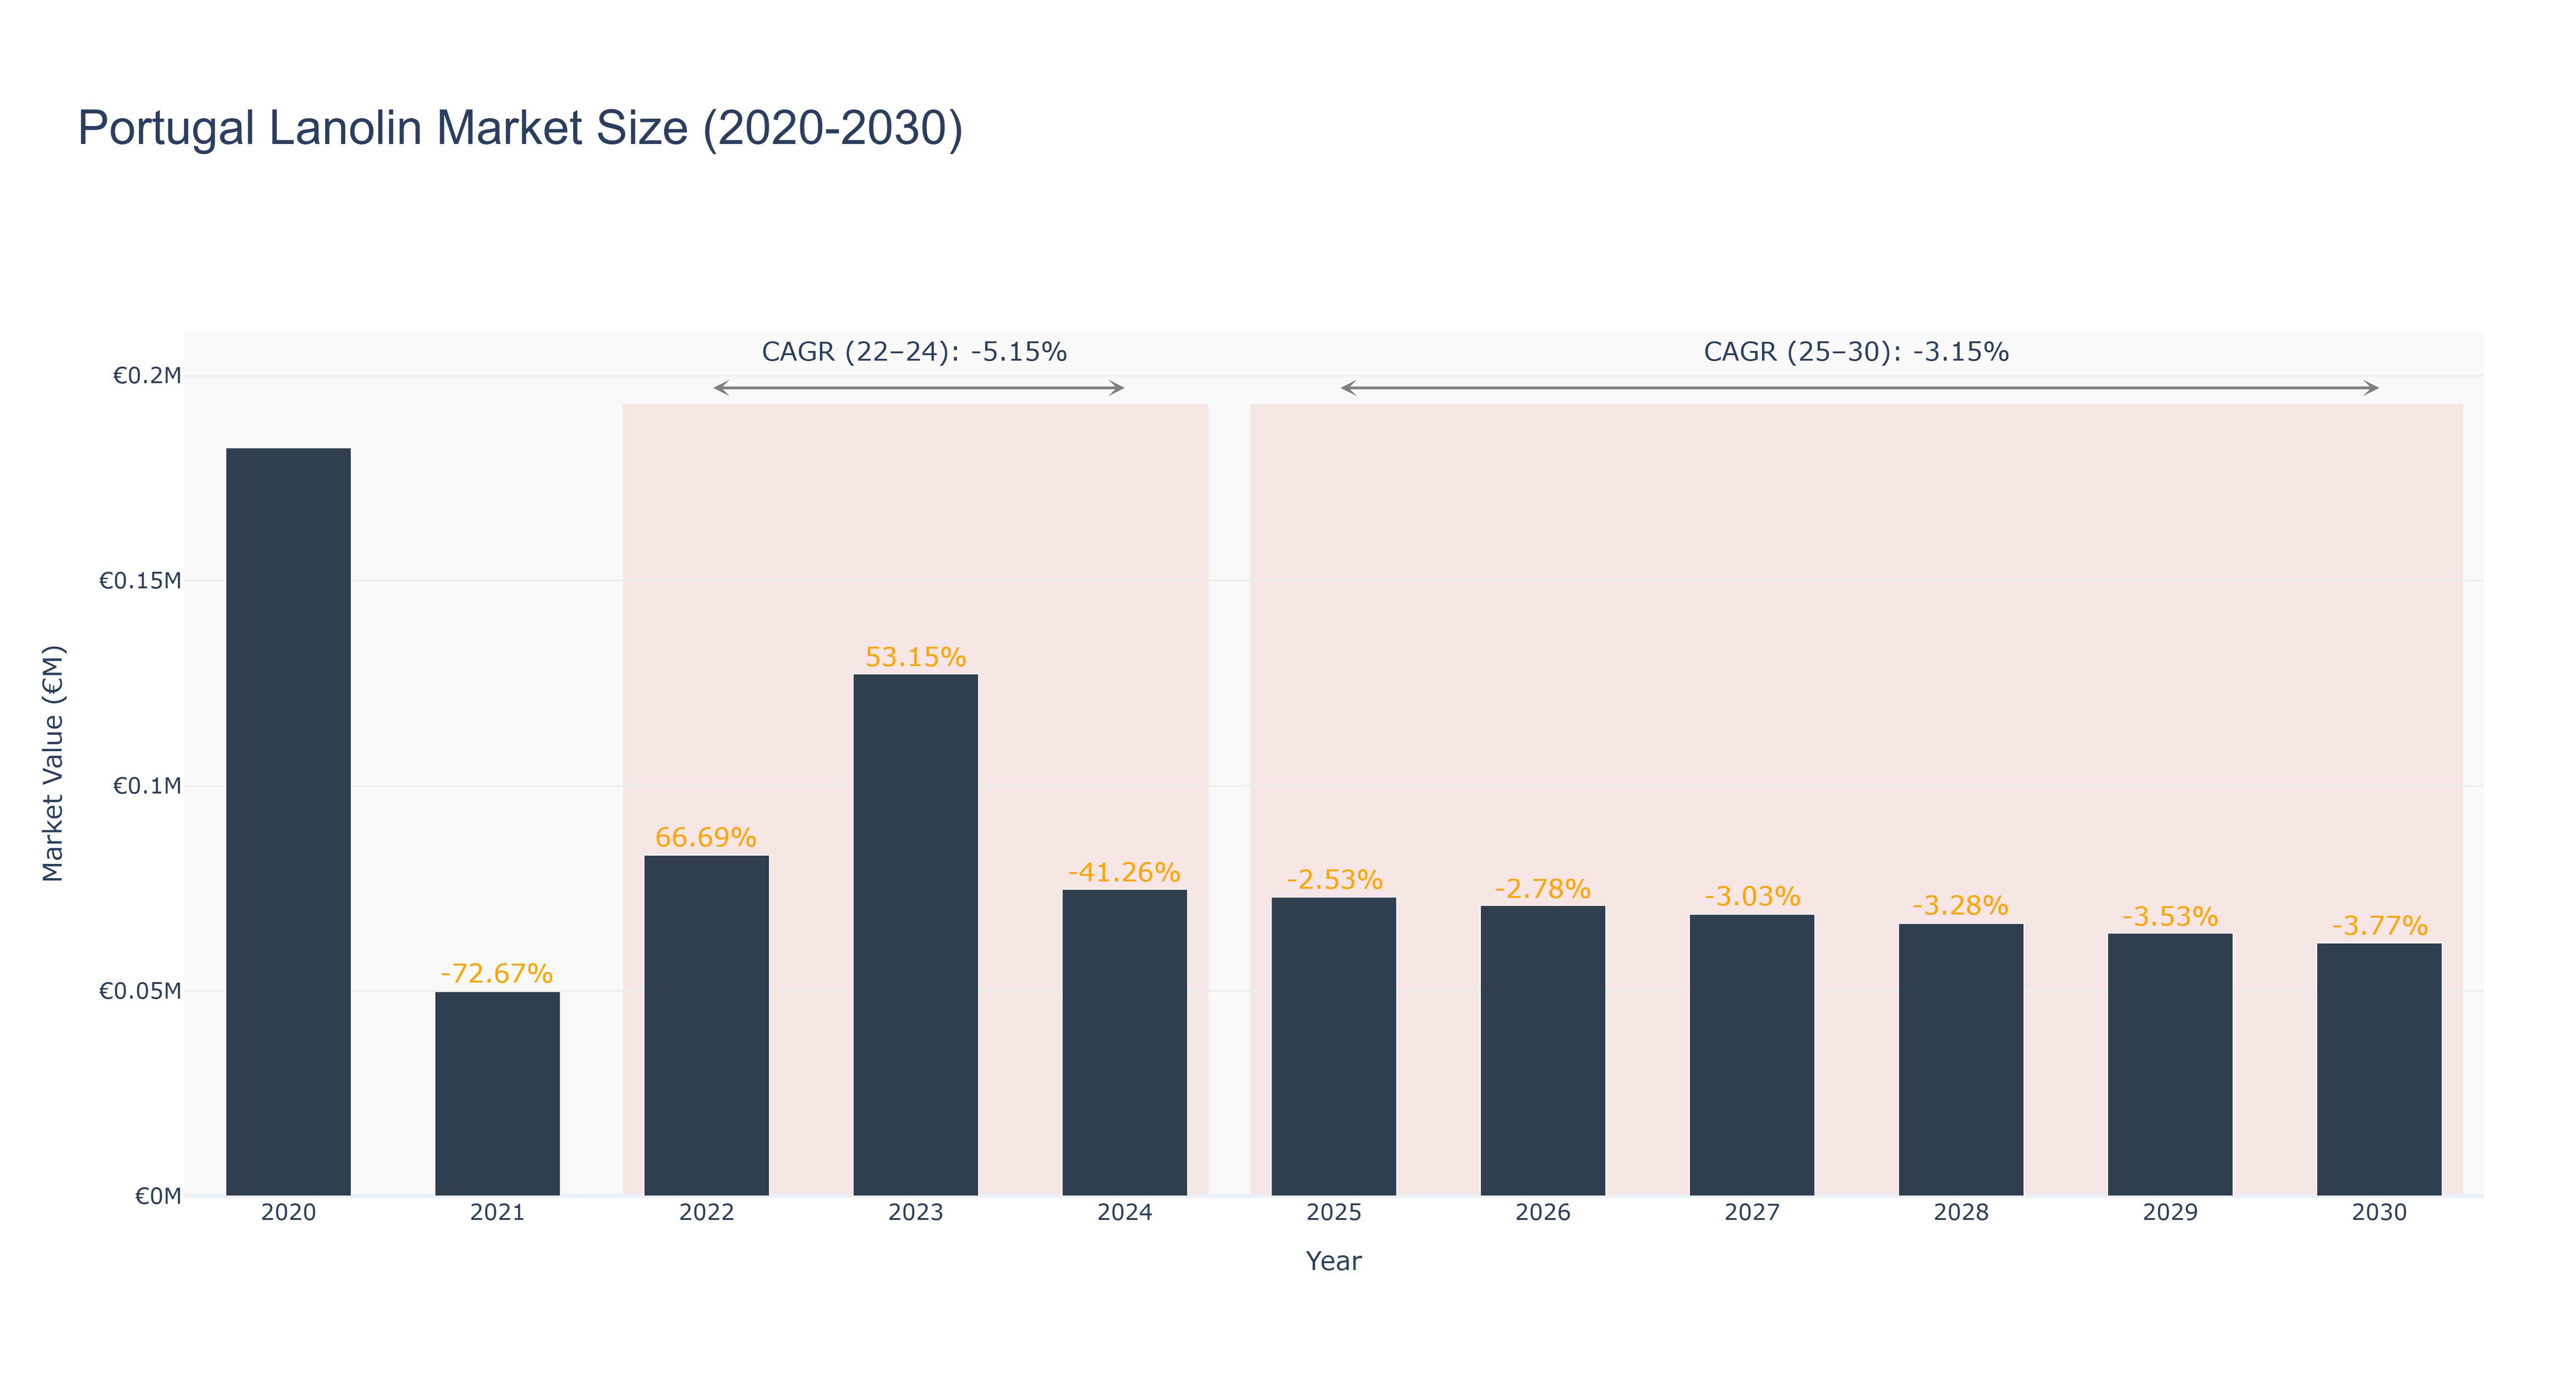
Portugal Lanolin Market has seen fluctuations in market size over the years. The peak market size of €0.18 million was recorded in 2020, followed by a significant decline to €0.05 million in 2021. The market showed some recovery in 2022, reaching €0.08 million, but then experienced a decline in 2024 to €0.07 million. Forecasted market sizes from 2025 to 2030 show a continued downward trend, with a CAGR of -3.15% expected from 2025 to 2030. The market's decline can be attributed to various factors such as changing consumer preferences, economic conditions, and competitive pressures. Looking ahead, Portugal is set to invest in sustainable lanolin production methods to meet the growing demand for eco-friendly skincare products, aiming to revitalize the market in the near future.
Portugal Lanolin Market: Production & Trade Performance (2019-2025)
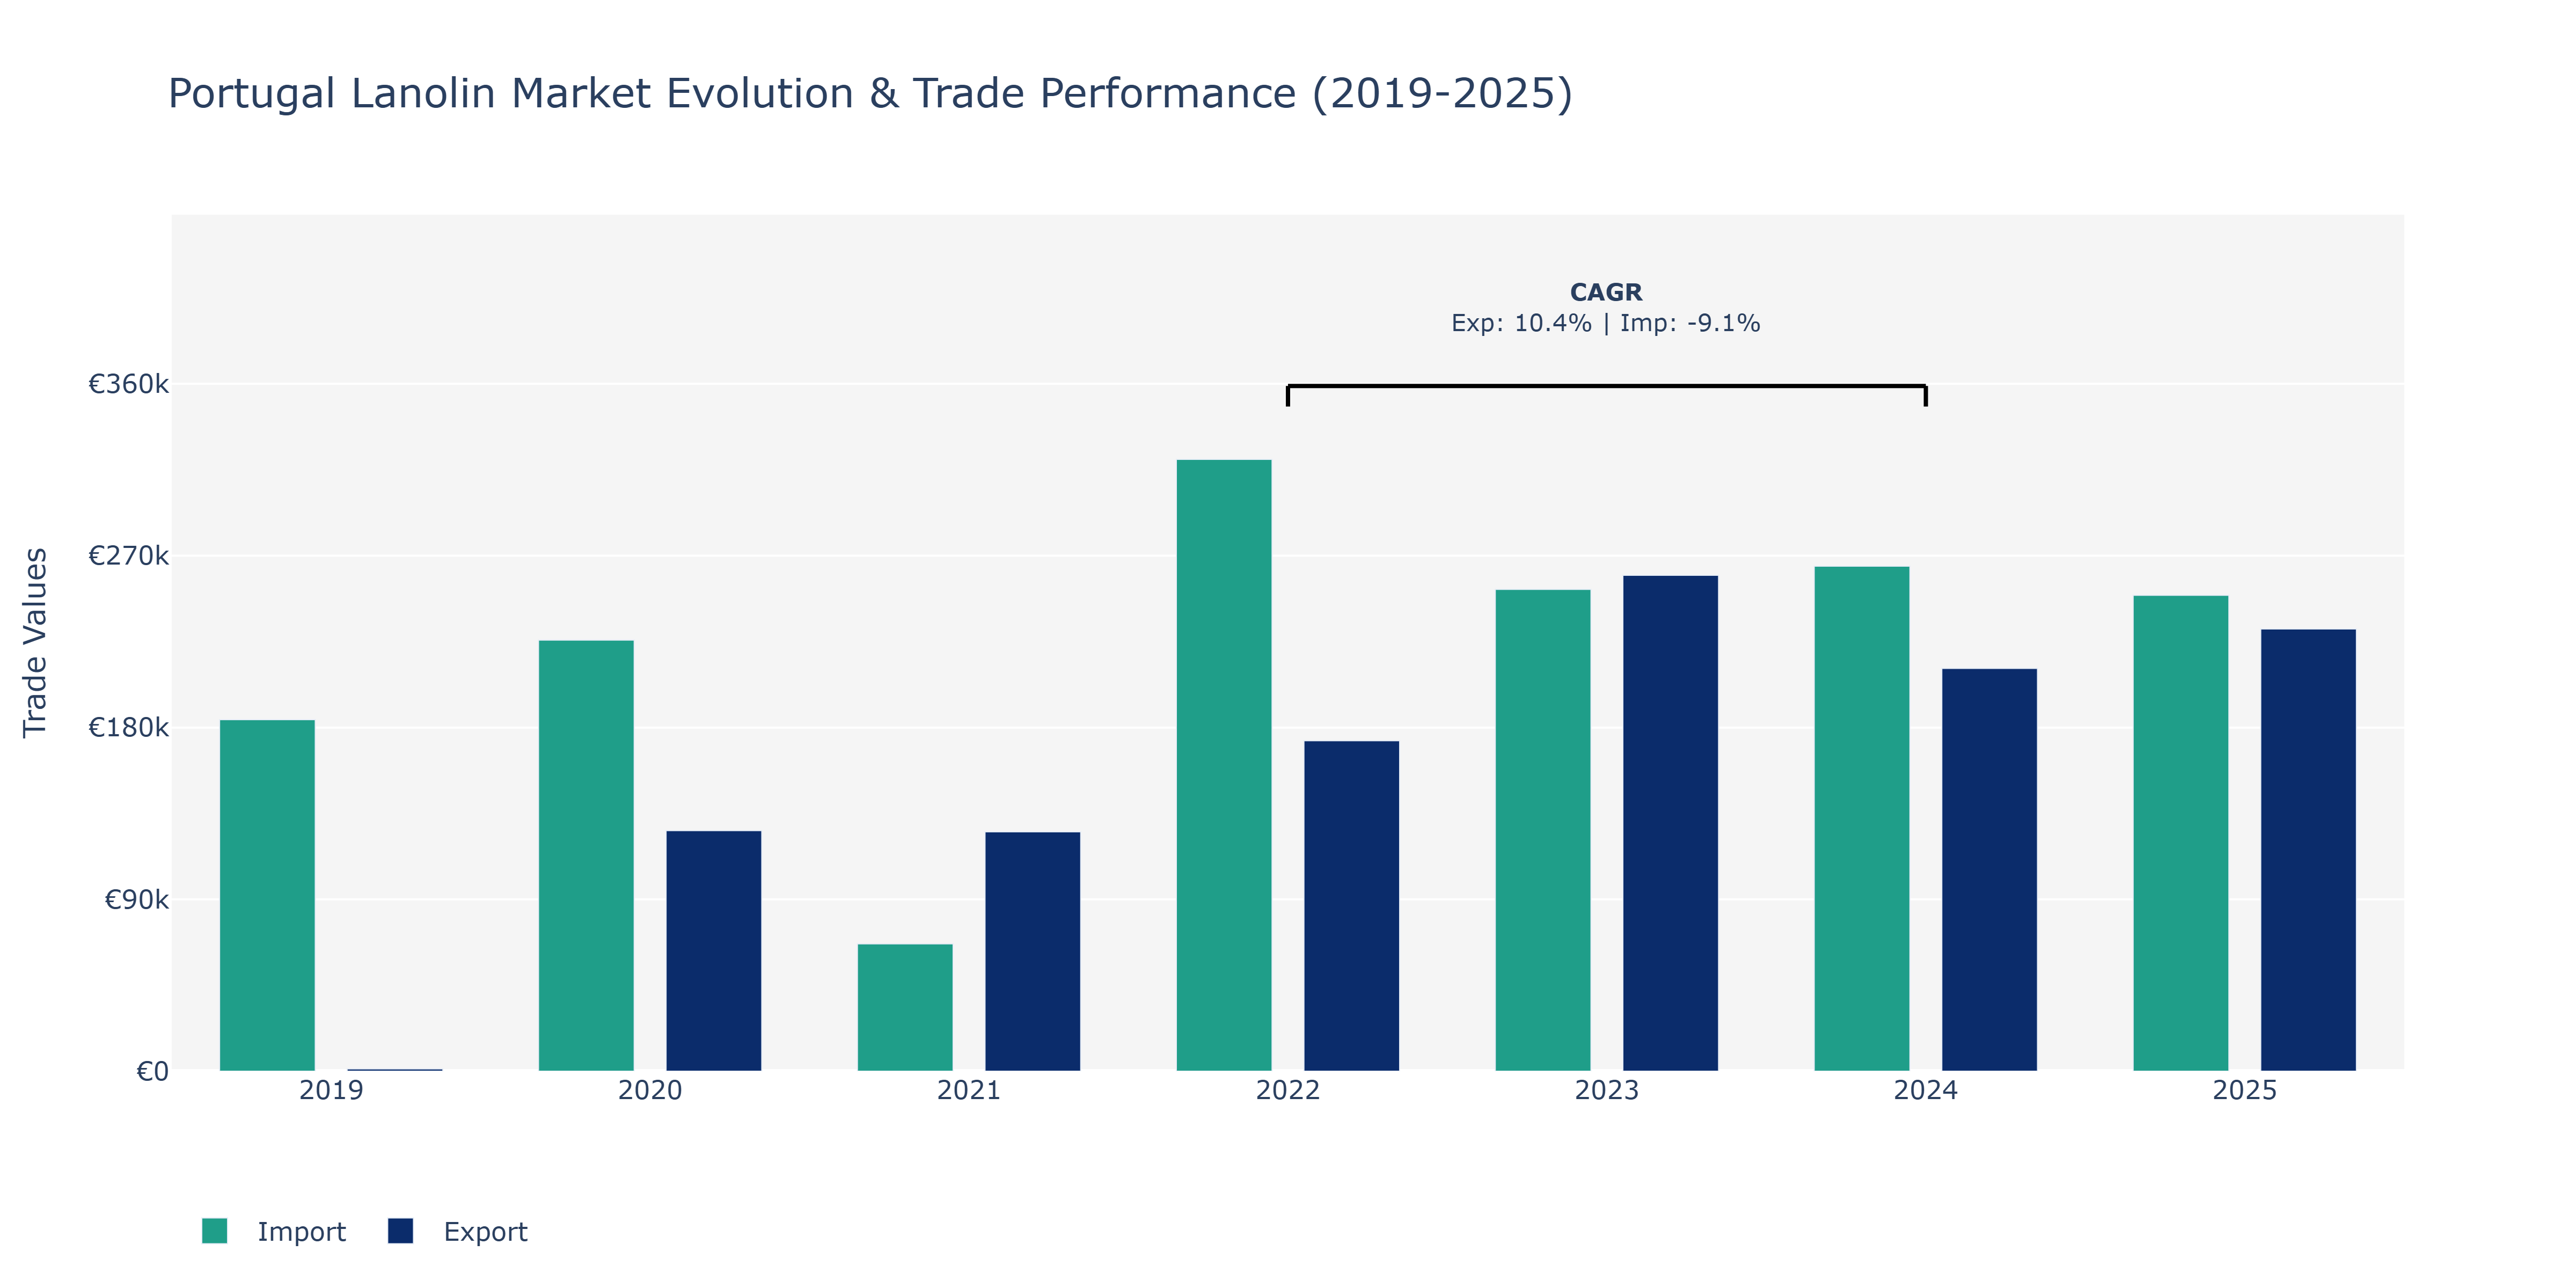
Between 2019 and 2025, Portugal's Lanolin Market witnessed varied trends in exports and imports. Exports showed a steady growth trajectory, increasing from €1.17 thousand in 2019 to around €231.64 thousand in 2025. The market experienced a peak in 2023 with exports reaching €259.78 thousand. On the other hand, imports fluctuated notably, starting at €184.12 thousand in 2019, peaking in 2020 at €225.82 thousand, and then dropping to €66.7 thousand in 2021. The imports rebounded in 2022 to €320.46 thousand before stabilizing around €249.29 thousand in subsequent years. The decline in imports in 2021 could be attributed to various factors such as changes in domestic demand, global market conditions, or trade policies impacting Lanolin imports. The surge in exports might be due to increased international demand, improved product quality, or successful market penetration strategies. To sustain growth, stakeholders could focus on diversifying export destinations and optimizing import processes to mitigate potential risks in the Lanolin market.
Key Highlights of the Report:
- Portugal Lanolin Market Outlook
- Market Size of Portugal Lanolin Market, 2025
- Forecast of Portugal Lanolin Market, 2032
- Historical Data and Forecast of Portugal Lanolin Revenues & Volume for the Period 2022 - 2032F
- Portugal Lanolin Market Trend Evolution
- Portugal Lanolin Market Drivers and Challenges
- Portugal Lanolin Price Trends
- Portugal Lanolin Porter`s Five Forces
- Portugal Lanolin Industry Life Cycle
- Historical Data and Forecast of Portugal Lanolin Market Revenues & Volume By Application for the Period 2022 - 2032F
- Historical Data and Forecast of Portugal Lanolin Market Revenues & Volume By Personal Care & Cosmetics for the Period 2022 - 2032F
- Historical Data and Forecast of Portugal Lanolin Market Revenues & Volume By BaCare Products for the Period 2022 - 2032F
- Historical Data and Forecast of Portugal Lanolin Market Revenues & Volume By Pharmaceuticals for the Period 2022 - 2032F
- Historical Data and Forecast of Portugal Lanolin Market Revenues & Volume By Industrial for the Period 2022 - 2032F
- Historical Data and Forecast of Portugal Lanolin Market Revenues & Volume By Others for the Period 2022 - 2032F
- Historical Data and Forecast of Portugal Lanolin Market Revenues & Volume By Derivative for the Period 2022 - 2032F
- Historical Data and Forecast of Portugal Lanolin Market Revenues & Volume By Lanolin alcohol for the Period 2022 - 2032F
- Historical Data and Forecast of Portugal Lanolin Market Revenues & Volume By Cholesterin for the Period 2022 - 2032F
- Historical Data and Forecast of Portugal Lanolin Market Revenues & Volume By Isopropyl Lanolate for the Period 2022 - 2032F
- Historical Data and Forecast of Portugal Lanolin Market Revenues & Volume By Laneth for the Period 2022 - 2032F
- Historical Data and Forecast of Portugal Lanolin Market Revenues & Volume By Lanogene for the Period 2022 - 2032F
- Historical Data and Forecast of Portugal Lanolin Market Revenues & Volume By Lanosterols for the Period 2022 - 2032F
- Historical Data and Forecast of Portugal Lanolin Market Revenues & Volume By Quaternium 33 for the Period 2022 - 2032F
- Historical Data and Forecast of Portugal Lanolin Market Revenues & Volume By Others for the Period 2022 - 2032F
- Portugal Lanolin Import Export Trade Statistics
- Market Opportunity Assessment By Application
- Market Opportunity Assessment By Derivative
- Portugal Lanolin Top Companies Market Share
- Portugal Lanolin Competitive Benchmarking By Technical and Operational Parameters
- Portugal Lanolin Company Profiles
- Portugal Lanolin Key Strategic Recommendations
Frequently Asked Questions About the Market Study (FAQs):
6Wresearch actively monitors the Portugal Lanolin Market and publishes its comprehensive annual report, highlighting emerging trends, growth drivers, revenue analysis, and forecast outlook. Our insights help businesses to make data-backed strategic decisions with ongoing market dynamics. Our analysts track relevent industries related to the Portugal Lanolin Market, allowing our clients with actionable intelligence and reliable forecasts tailored to emerging regional needs.
Yes, we provide customisation as per your requirements. To learn more, feel free to contact us on sales@6wresearch.com
1 Executive Summary |
2 Introduction |
2.1 Key Highlights of the Report |
2.2 Report Description |
2.3 Market Scope & Segmentation |
2.4 Research Methodology |
2.5 Assumptions |
3 Portugal Lanolin Market Overview |
3.1 Portugal Country Macro Economic Indicators |
3.2 Portugal Lanolin Market Revenues & Volume, 2022 & 2032F |
3.3 Portugal Lanolin Market - Industry Life Cycle |
3.4 Portugal Lanolin Market - Porter's Five Forces |
3.5 Portugal Lanolin Market Revenues & Volume Share, By Application, 2022 & 2032F |
3.6 Portugal Lanolin Market Revenues & Volume Share, By Derivative, 2022 & 2032F |
4 Portugal Lanolin Market Dynamics |
4.1 Impact Analysis |
4.2 Market Drivers |
4.2.1 Growing demand for natural and organic skincare products |
4.2.2 Increasing awareness about the benefits of lanolin in cosmetics and personal care products |
4.2.3 Rising disposable income leading to higher spending on premium beauty products |
4.3 Market Restraints |
4.3.1 Fluctuations in lanolin prices due to supply chain disruptions or changes in sheep farming practices |
4.3.2 Regulatory challenges related to lanolin extraction and processing |
4.3.3 Competition from alternative natural ingredients in the skincare industry |
5 Portugal Lanolin Market Trends |
6 Portugal Lanolin Market Segmentations |
6.1 Portugal Lanolin Market, By Application |
6.1.1 Overview and Analysis |
6.1.2 Portugal Lanolin Market Revenues & Volume, By Personal Care & Cosmetics, 2022 - 2032F |
6.1.3 Portugal Lanolin Market Revenues & Volume, By BaCare Products, 2022 - 2032F |
6.1.4 Portugal Lanolin Market Revenues & Volume, By Pharmaceuticals, 2022 - 2032F |
6.1.5 Portugal Lanolin Market Revenues & Volume, By Industrial, 2022 - 2032F |
6.1.6 Portugal Lanolin Market Revenues & Volume, By Others, 2022 - 2032F |
6.2 Portugal Lanolin Market, By Derivative |
6.2.1 Overview and Analysis |
6.2.2 Portugal Lanolin Market Revenues & Volume, By Lanolin alcohol, 2022 - 2032F |
6.2.3 Portugal Lanolin Market Revenues & Volume, By Cholesterin, 2022 - 2032F |
6.2.4 Portugal Lanolin Market Revenues & Volume, By Isopropyl Lanolate, 2022 - 2032F |
6.2.5 Portugal Lanolin Market Revenues & Volume, By Laneth, 2022 - 2032F |
6.2.6 Portugal Lanolin Market Revenues & Volume, By Lanogene, 2022 - 2032F |
6.2.7 Portugal Lanolin Market Revenues & Volume, By Lanosterols, 2022 - 2032F |
6.2.8 Portugal Lanolin Market Revenues & Volume, By Others, 2022 - 2032F |
6.2.9 Portugal Lanolin Market Revenues & Volume, By Others, 2022 - 2032F |
7 Portugal Lanolin Market Import-Export Trade Statistics |
7.1 Portugal Lanolin Market Export to Major Countries |
7.2 Portugal Lanolin Market Imports from Major Countries |
8 Portugal Lanolin Market Key Performance Indicators |
8.1 Percentage of lanolin-based products in the skincare market |
8.2 Number of research studies highlighting the benefits of lanolin in skincare |
8.3 Consumer satisfaction ratings for lanolin-containing beauty products |
9 Portugal Lanolin Market - Opportunity Assessment |
9.1 Portugal Lanolin Market Opportunity Assessment, By Application, 2022 & 2032F |
9.2 Portugal Lanolin Market Opportunity Assessment, By Derivative, 2022 & 2032F |
10 Portugal Lanolin Market - Competitive Landscape |
10.1 Portugal Lanolin Market Revenue Share, By Companies, 2025 |
10.2 Portugal Lanolin Market Competitive Benchmarking, By Operating and Technical Parameters |
11 Company Profiles |
12 Recommendations | 13 Disclaimer |
Global Go To Market Strategy - 2030
Export potential enables firms to identify high-growth global markets with greater confidence by combining advanced trade intelligence with a structured quantitative methodology. The framework analyzes emerging demand trends and country-level import patterns while integrating macroeconomic and trade datasets such as GDP and population forecasts, bilateral import–export flows, tariff structures, elasticity differentials between developed and developing economies, geographic distance, and import demand projections. Using weighted trade values from 2020–2024 as the base period to project country-to-country export potential for 2030, these inputs are operationalized through calculated drivers such as gravity model parameters, tariff impact factors, and projected GDP per-capita growth. Through an analysis of hidden potentials, demand hotspots, and market conditions that are most favorable to success, this method enables firms to focus on target countries, maximize returns, and global expansion with data, backed by accuracy.
By factoring in the projected importer demand gap that is currently unmet and could be potential opportunity, it identifies the potential for the Exporter (Country) among 190 countries, against the general trade analysis, which identifies the biggest importer or exporter.
To discover high-growth global markets and optimize your business strategy:
Click Here
Pricing
- Single User License$ 1,995
- Department License$ 2,400
- Site License$ 3,120
- Global License$ 3,795

Leadership Perspectives from Industry Events
Search
Thought Leadership and Analyst Meet


Our Clients
6WResearch In News
- Doha a strategic location for EV manufacturing hub: IPA Qatar
- Demand for luxury TVs surging in the GCC, says Samsung
- Empowering Growth: The Thriving Journey of Bangladesh’s Cable Industry
- Demand for luxury TVs surging in the GCC, says Samsung
- Video call with a traditional healer? Once unthinkable, it’s now common in South Africa
- Intelligent Buildings To Smooth GCC’s Path To Net Zero
Latest Reports
- New Zealand Aseptic Manufacturing Market (2026-2032)
- Netherlands Aseptic Manufacturing Market (2026-2032)
- Nauru Aseptic Manufacturing Market (2026-2032)
- Namibia Aseptic Manufacturing Market (2026-2032)
- Mozambique Aseptic Manufacturing Market (2026-2032)
- Montenegro Aseptic Manufacturing Market (2026-2032)
- Mongolia Aseptic Manufacturing Market (2026-2032)
- Monaco Aseptic Manufacturing Market (2026-2032)
- Micronesia Aseptic Manufacturing Market (2026-2032)
- Mauritius Aseptic Manufacturing Market (2026-2032)
Industry Events and Analyst Meet

HIMTEX 2026

India Refining Summit 2026

India EV Show 2026

EV tech India Expo 2026

Auto Tech Asia 2026
Whitepaper
- Middle East & Africa Commercial Security Market Click here to view more.
- Middle East & Africa Fire Safety Systems & Equipment Market Click here to view more.
- GCC Drone Market Click here to view more.
- Middle East Lighting Fixture Market Click here to view more.
- GCC Physical & Perimeter Security Market Click here to view more.