Portugal Thermal Transfer Ribbon Market (2026-2032) | Share, Trends, Outlook, Forecast, Industry, Size & Revenue, Competitive Landscape, Growth, Analysis, Companies, Segmentation, Value
Market Forecast By Type (Wax Base Thermal Transfer Ribbon, Wax/Resin Mixed Base Thermal Transfer Ribbon, Resin Base Thermal Transfer Ribbon), By Application (Packaging, Manufacturing, Retail, Others) And Competitive Landscape
| Product Code: ETC8896514 | Publication Date: Sep 2024 | Updated Date: Apr 2026 | Product Type: Market Research Report | |
| Publisher: 6Wresearch | Author: Shubham Padhi | No. of Pages: 75 | No. of Figures: 35 | No. of Tables: 20 |
Portugal Thermal Transfer Ribbon Market Size (2020-2030)
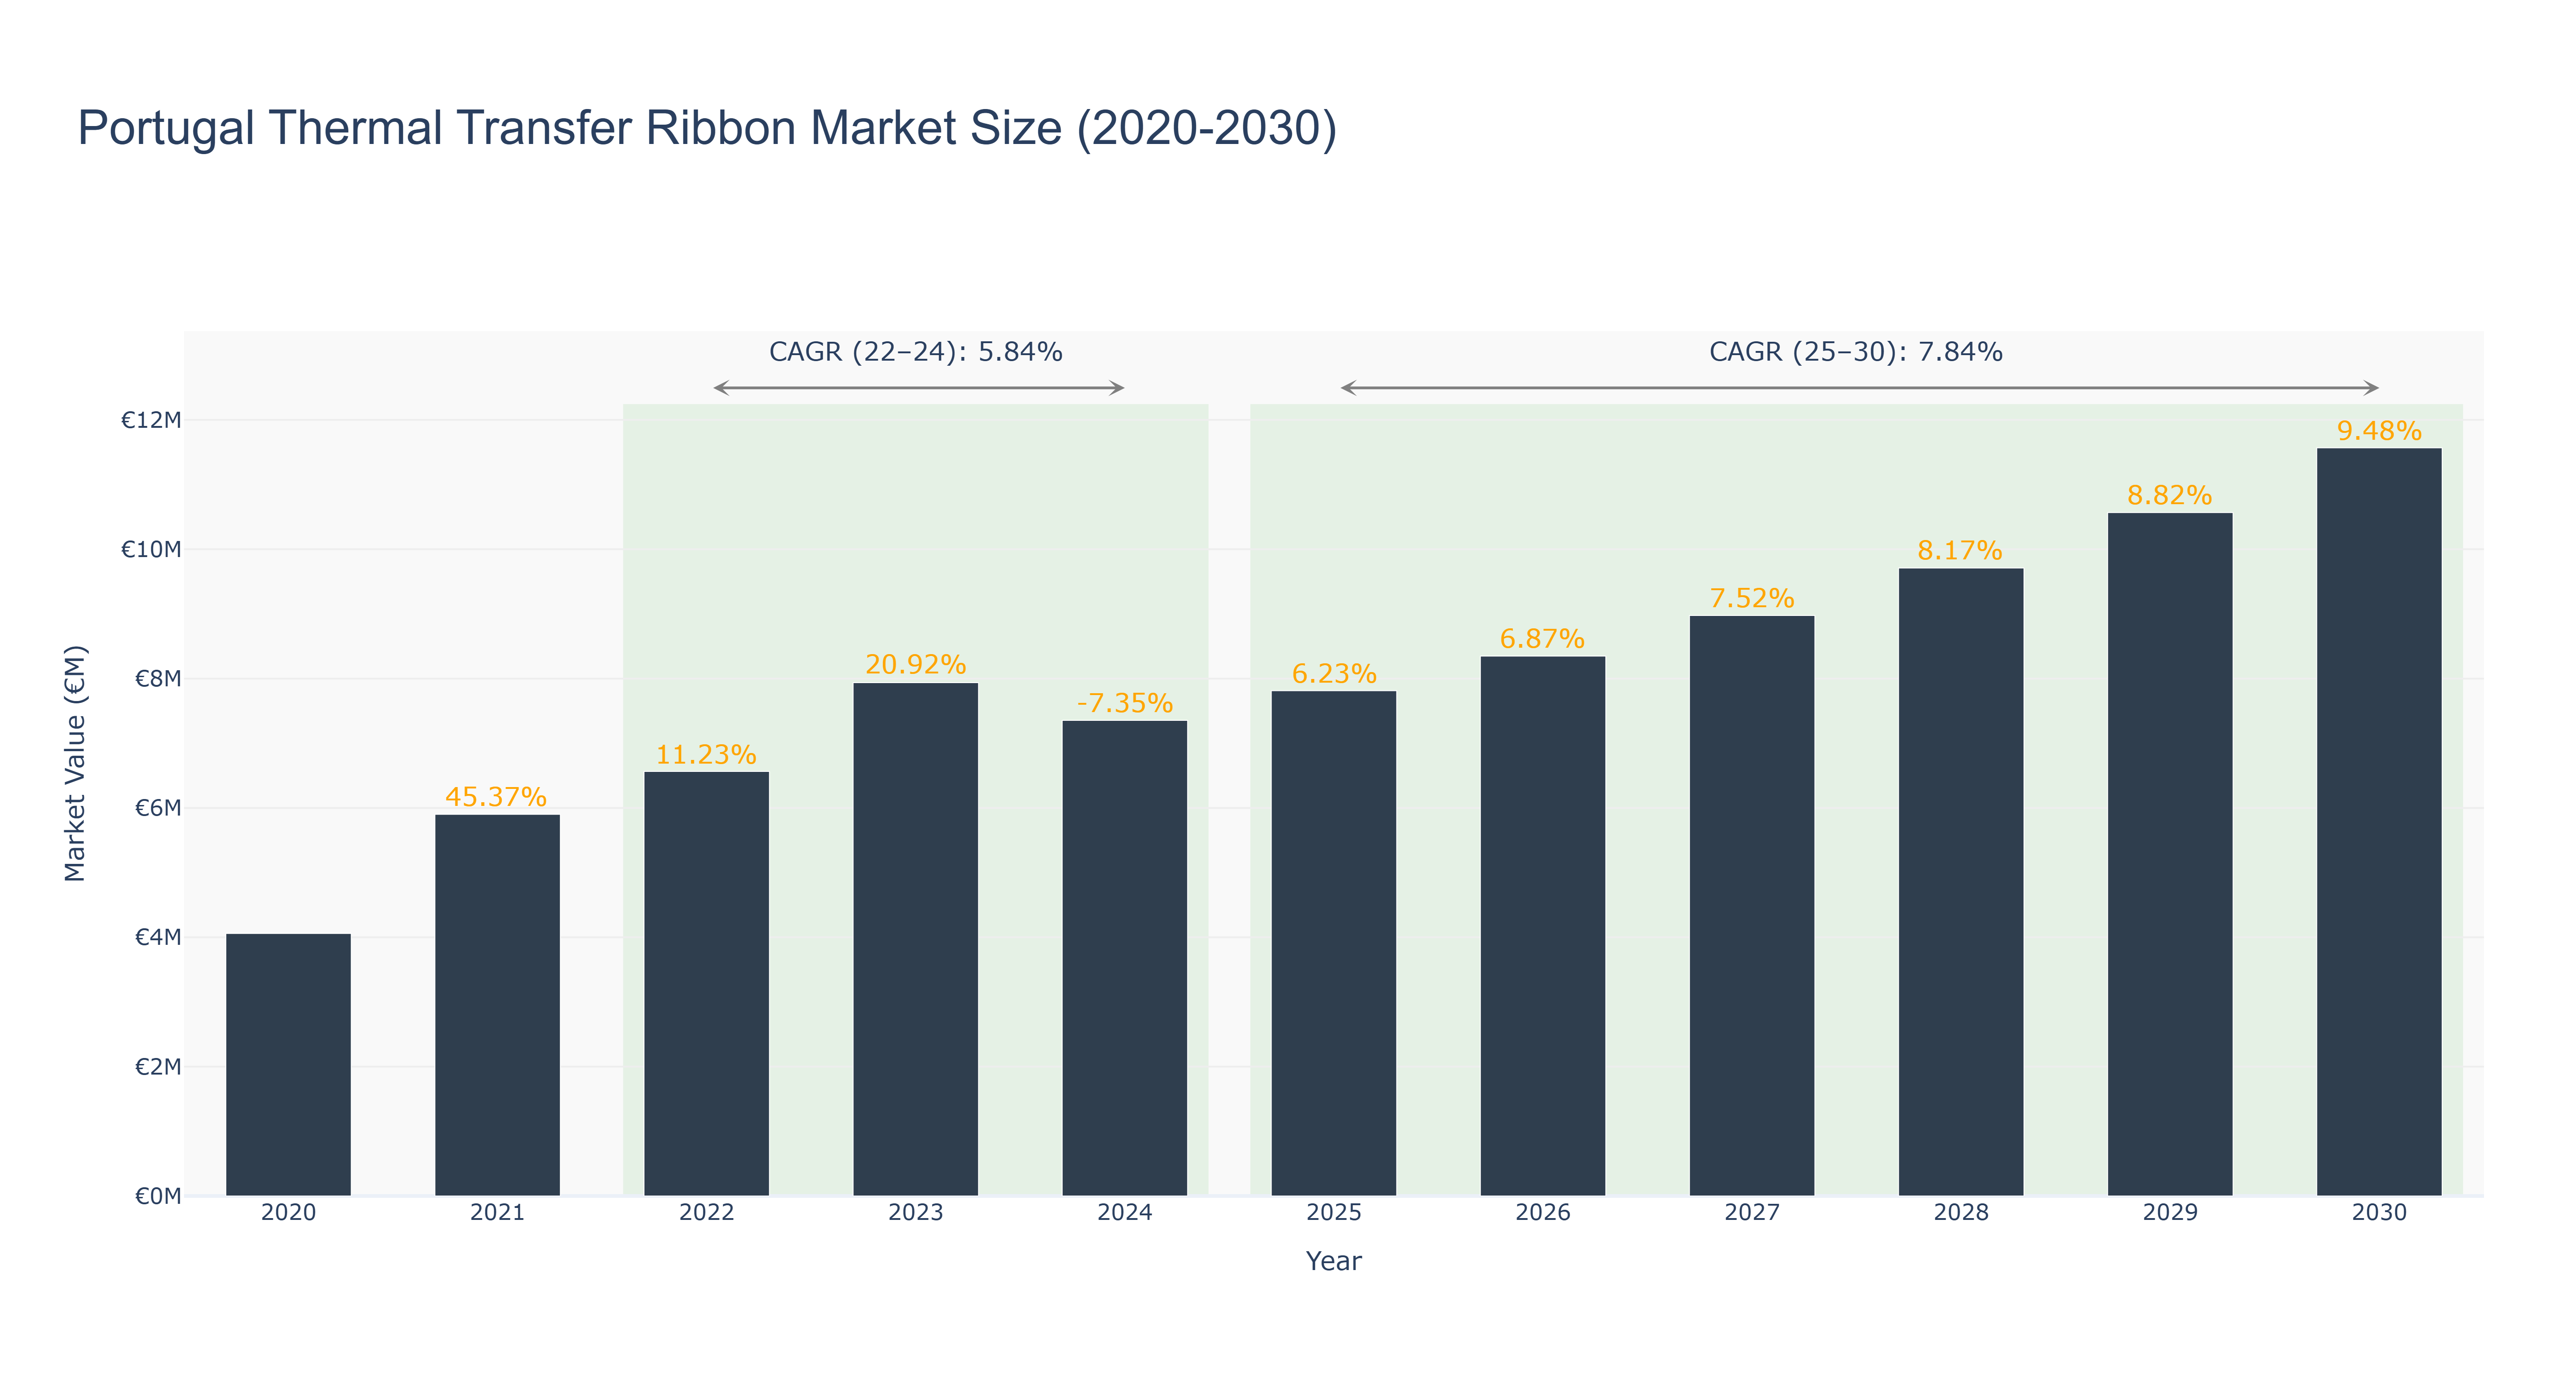
Portugal Thermal Transfer Ribbon Market has shown a steady growth trajectory, with a peak market size of €11.57 million in 2030. The market experienced a slight decline in 2024 with a size of €7.35 million, attributed to a negative growth rate. However, from 2025 to 2030, the market is forecasted to grow at a Compound Annual Growth Rate (CAGR) of 7.84%, indicating a positive upward trend. The CAGR for the period 2022-24 was 5.84%, reflecting a moderate growth phase. The industry drivers behind this growth include increasing demand for thermal transfer ribbons in various applications. Looking ahead, Portugal is set to invest in upgrading its manufacturing capabilities to meet the rising demand for thermal transfer ribbons, positioning the market for further expansion in the coming years.
Portugal Thermal Transfer Ribbon Market: Production & Trade Performance (2019-2025)
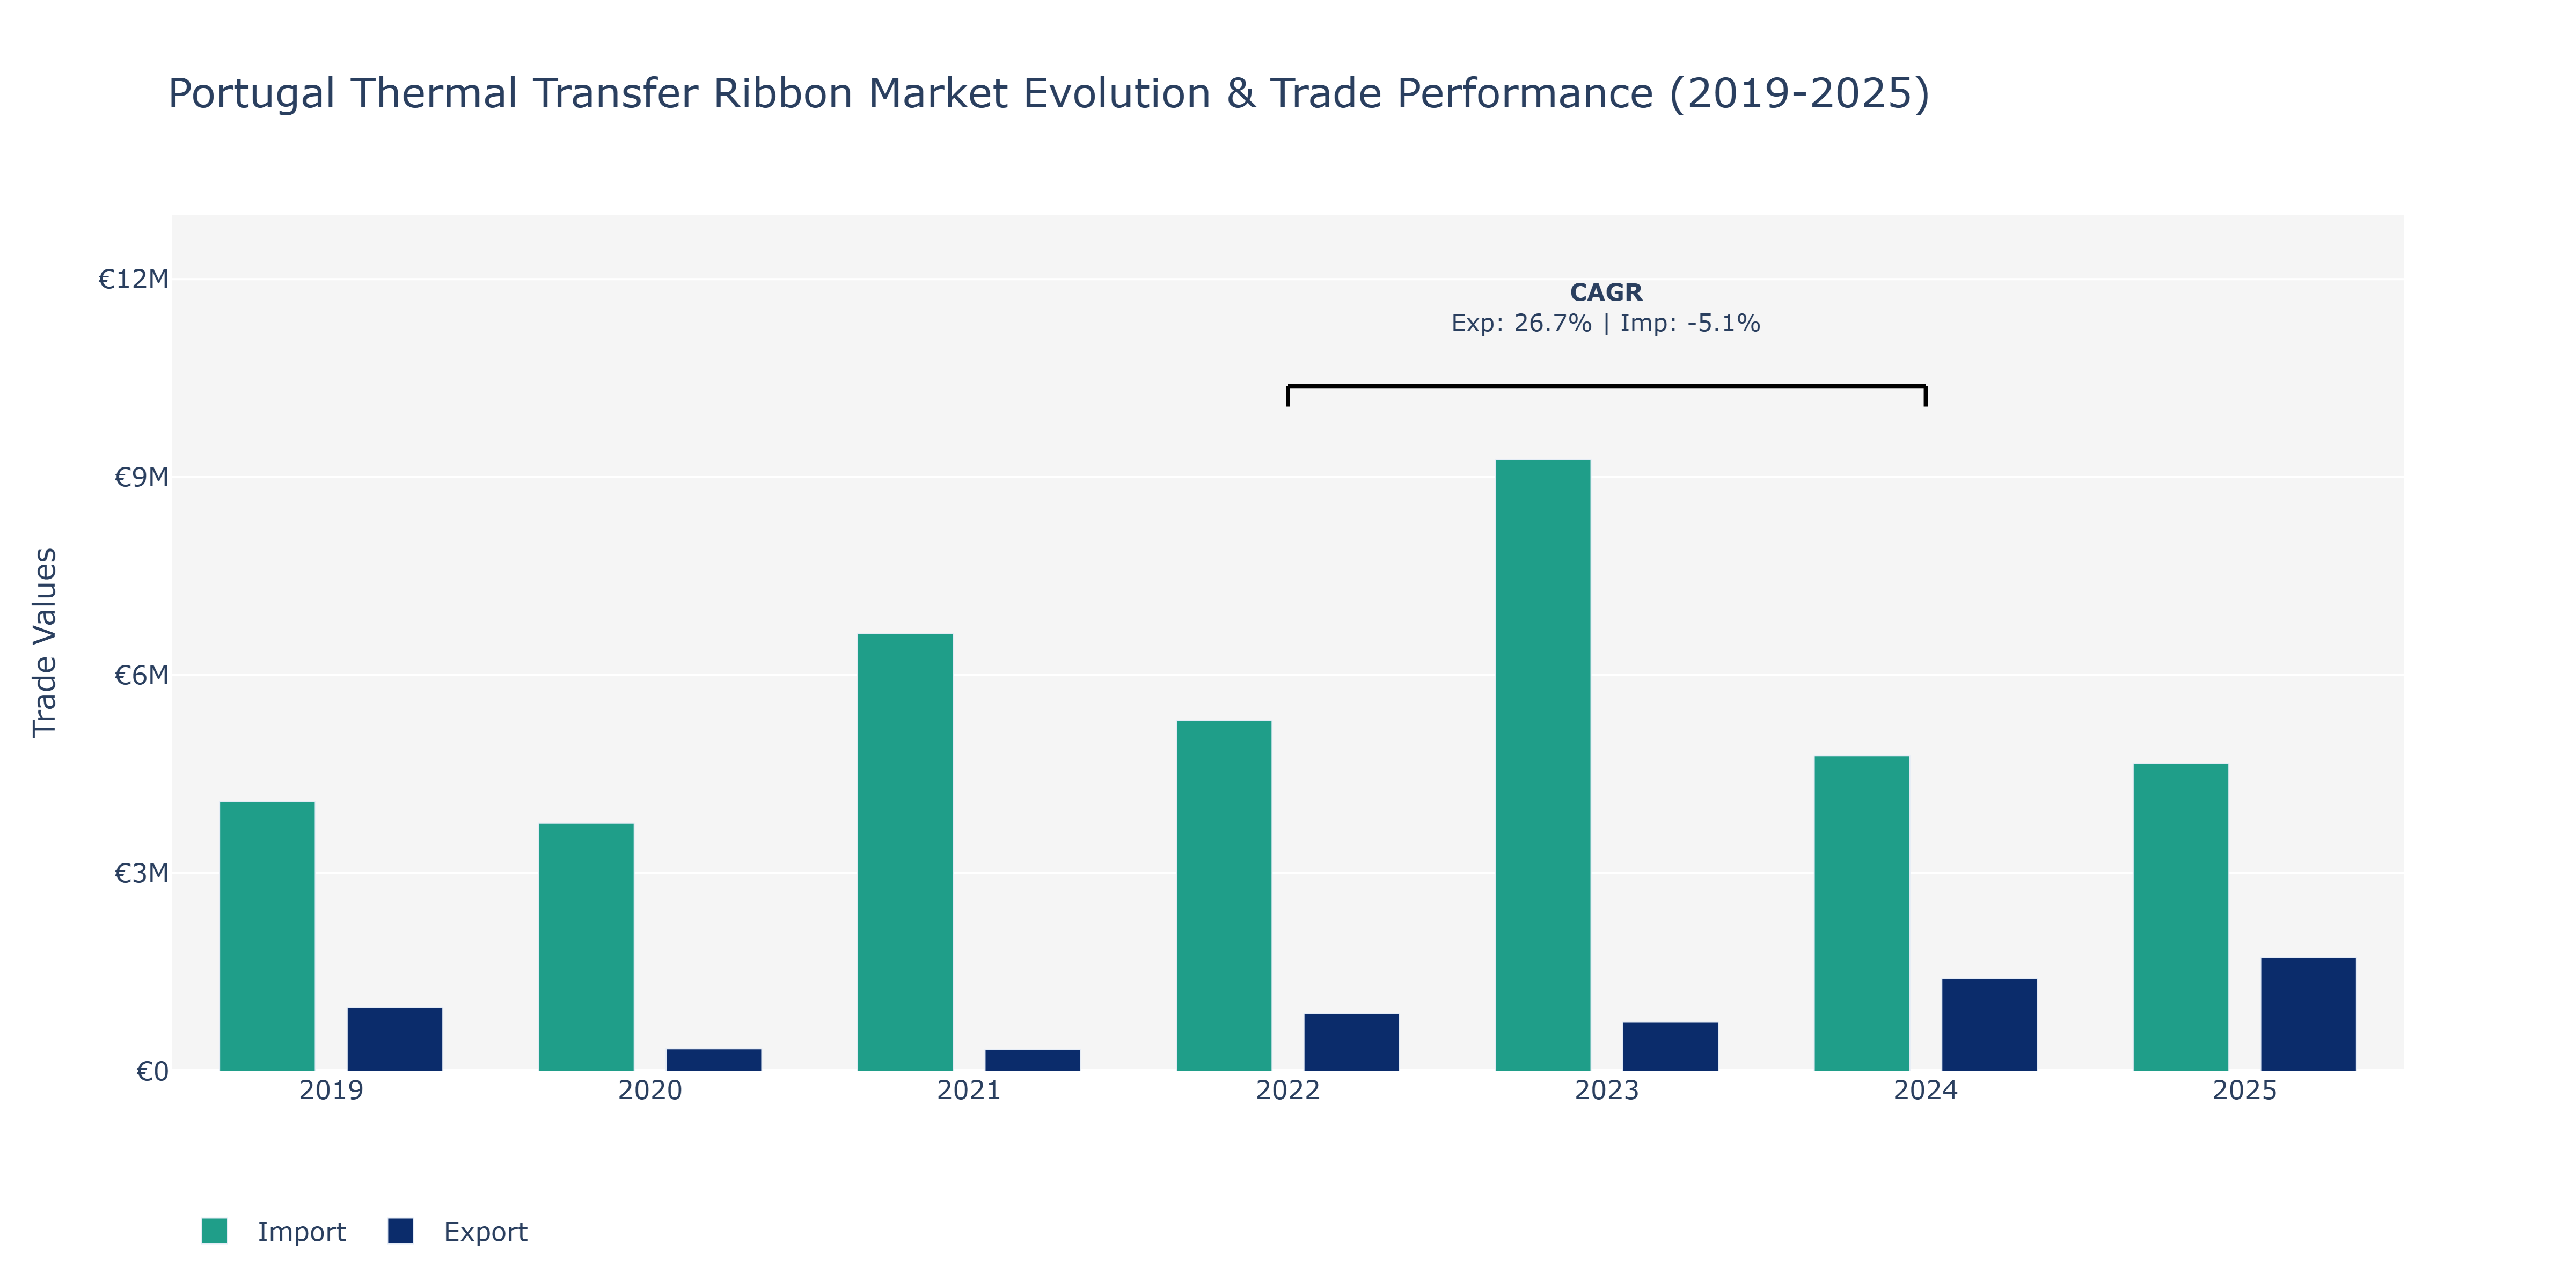
The Portugal Thermal Transfer Ribbon Market witnessed a notable fluctuation in both Exports and Imports from 2019 to 2025. In 2019, Imports stood at €4.09 million, significantly surpassing Exports of €959.35 thousand. However, by 2020, Exports experienced a sharp decline to €339.39 thousand, while Imports decreased to €3.76 million. This reversal continued in 2021 with Exports at €327.75 thousand and Imports climbing to €6.63 million. The year 2022 marked a substantial increase in Exports to €875.49 thousand, whereas Imports decreased slightly to €5.31 million. The peak points were observed in 2025 with Exports reaching €1.72 million and Imports at €4.66 million. The market's fluctuations can be attributed to evolving demand patterns in Thermal transfer ribbon industry, potential changes in domestic production capacities, and shifts in global trade dynamics impacting import volumes. The rise in Exports in 2025 could be influenced by advancements in thermal transfer technology, driving higher demand from international markets, subsequently boosting the sector's competitiveness on a global scale.
Key Highlights of the Report:
- Portugal Thermal Transfer Ribbon Market Outlook
- Market Size of Portugal Thermal Transfer Ribbon Market, 2025
- Forecast of Portugal Thermal Transfer Ribbon Market, 2032
- Historical Data and Forecast of Portugal Thermal Transfer Ribbon Revenues & Volume for the Period 2022 - 2032
- Portugal Thermal Transfer Ribbon Market Trend Evolution
- Portugal Thermal Transfer Ribbon Market Drivers and Challenges
- Portugal Thermal Transfer Ribbon Price Trends
- Portugal Thermal Transfer Ribbon Porter's Five Forces
- Portugal Thermal Transfer Ribbon Industry Life Cycle
- Historical Data and Forecast of Portugal Thermal Transfer Ribbon Market Revenues & Volume By Type for the Period 2022 - 2032
- Historical Data and Forecast of Portugal Thermal Transfer Ribbon Market Revenues & Volume By Wax Base Thermal Transfer Ribbon for the Period 2022 - 2032
- Historical Data and Forecast of Portugal Thermal Transfer Ribbon Market Revenues & Volume By Wax/Resin Mixed Base Thermal Transfer Ribbon for the Period 2022 - 2032
- Historical Data and Forecast of Portugal Thermal Transfer Ribbon Market Revenues & Volume By Resin Base Thermal Transfer Ribbon for the Period 2022 - 2032
- Historical Data and Forecast of Portugal Thermal Transfer Ribbon Market Revenues & Volume By Application for the Period 2022 - 2032
- Historical Data and Forecast of Portugal Thermal Transfer Ribbon Market Revenues & Volume By Packaging for the Period 2022 - 2032
- Historical Data and Forecast of Portugal Thermal Transfer Ribbon Market Revenues & Volume By Manufacturing for the Period 2022 - 2032
- Historical Data and Forecast of Portugal Thermal Transfer Ribbon Market Revenues & Volume By Retail for the Period 2022 - 2032
- Historical Data and Forecast of Portugal Thermal Transfer Ribbon Market Revenues & Volume By Others for the Period 2022 - 2032
- Portugal Thermal Transfer Ribbon Import Export Trade Statistics
- Market Opportunity Assessment By Type
- Market Opportunity Assessment By Application
- Portugal Thermal Transfer Ribbon Top Companies Market Share
- Portugal Thermal Transfer Ribbon Competitive Benchmarking By Technical and Operational Parameters
- Portugal Thermal Transfer Ribbon Company Profiles
- Portugal Thermal Transfer Ribbon Key Strategic Recommendations
Frequently Asked Questions About the Market Study (FAQs):
6Wresearch actively monitors the Portugal Thermal Transfer Ribbon Market and publishes its comprehensive annual report, highlighting emerging trends, growth drivers, revenue analysis, and forecast outlook. Our insights help businesses to make data-backed strategic decisions with ongoing market dynamics. Our analysts track relevent industries related to the Portugal Thermal Transfer Ribbon Market, allowing our clients with actionable intelligence and reliable forecasts tailored to emerging regional needs.
Yes, we provide customisation as per your requirements. To learn more, feel free to contact us on sales@6wresearch.com
1 Executive Summary |
2 Introduction |
2.1 Key Highlights of the Report |
2.2 Report Description |
2.3 Market Scope & Segmentation |
2.4 Research Methodology |
2.5 Assumptions |
3 Portugal Thermal Transfer Ribbon Market Overview |
3.1 Portugal Country Macro Economic Indicators |
3.2 Portugal Thermal Transfer Ribbon Market Revenues & Volume, 2022 & 2032F |
3.3 Portugal Thermal Transfer Ribbon Market - Industry Life Cycle |
3.4 Portugal Thermal Transfer Ribbon Market - Porter's Five Forces |
3.5 Portugal Thermal Transfer Ribbon Market Revenues & Volume Share, By Type, 2022 & 2032F |
3.6 Portugal Thermal Transfer Ribbon Market Revenues & Volume Share, By Application, 2022 & 2032F |
4 Portugal Thermal Transfer Ribbon Market Dynamics |
4.1 Impact Analysis |
4.2 Market Drivers |
4.2.1 Growing demand for barcode labeling in the retail sector |
4.2.2 Increasing adoption of thermal transfer printing technology in manufacturing industries |
4.2.3 Rising need for efficient and durable labeling solutions in logistics and transportation sectors |
4.3 Market Restraints |
4.3.1 High initial investment costs associated with thermal transfer printing equipment |
4.3.2 Limited awareness and understanding of thermal transfer ribbon technology among end-users |
4.3.3 Competition from alternative printing technologies such as direct thermal printing |
5 Portugal Thermal Transfer Ribbon Market Trends |
6 Portugal Thermal Transfer Ribbon Market, By Types |
6.1 Portugal Thermal Transfer Ribbon Market, By Type |
6.1.1 Overview and Analysis |
6.1.2 Portugal Thermal Transfer Ribbon Market Revenues & Volume, By Type, 2022 - 2032F |
6.1.3 Portugal Thermal Transfer Ribbon Market Revenues & Volume, By Wax Base Thermal Transfer Ribbon, 2022 - 2032F |
6.1.4 Portugal Thermal Transfer Ribbon Market Revenues & Volume, By Wax/Resin Mixed Base Thermal Transfer Ribbon, 2022 - 2032F |
6.1.5 Portugal Thermal Transfer Ribbon Market Revenues & Volume, By Resin Base Thermal Transfer Ribbon, 2022 - 2032F |
6.2 Portugal Thermal Transfer Ribbon Market, By Application |
6.2.1 Overview and Analysis |
6.2.2 Portugal Thermal Transfer Ribbon Market Revenues & Volume, By Packaging, 2022 - 2032F |
6.2.3 Portugal Thermal Transfer Ribbon Market Revenues & Volume, By Manufacturing, 2022 - 2032F |
6.2.4 Portugal Thermal Transfer Ribbon Market Revenues & Volume, By Retail, 2022 - 2032F |
6.2.5 Portugal Thermal Transfer Ribbon Market Revenues & Volume, By Others, 2022 - 2032F |
7 Portugal Thermal Transfer Ribbon Market Import-Export Trade Statistics |
7.1 Portugal Thermal Transfer Ribbon Market Export to Major Countries |
7.2 Portugal Thermal Transfer Ribbon Market Imports from Major Countries |
8 Portugal Thermal Transfer Ribbon Market Key Performance Indicators |
8.1 Average utilization rate of thermal transfer ribbon production capacity |
8.2 Percentage of market share captured from direct thermal printing technology |
8.3 Rate of adoption of thermal transfer printing technology in emerging industries |
9 Portugal Thermal Transfer Ribbon Market - Opportunity Assessment |
9.1 Portugal Thermal Transfer Ribbon Market Opportunity Assessment, By Type, 2022 & 2032F |
9.2 Portugal Thermal Transfer Ribbon Market Opportunity Assessment, By Application, 2022 & 2032F |
10 Portugal Thermal Transfer Ribbon Market - Competitive Landscape |
10.1 Portugal Thermal Transfer Ribbon Market Revenue Share, By Companies, 2025 |
10.2 Portugal Thermal Transfer Ribbon Market Competitive Benchmarking, By Operating and Technical Parameters |
11 Company Profiles |
12 Recommendations |
13 Disclaimer |
Global Go To Market Strategy - 2030
Export potential enables firms to identify high-growth global markets with greater confidence by combining advanced trade intelligence with a structured quantitative methodology. The framework analyzes emerging demand trends and country-level import patterns while integrating macroeconomic and trade datasets such as GDP and population forecasts, bilateral import–export flows, tariff structures, elasticity differentials between developed and developing economies, geographic distance, and import demand projections. Using weighted trade values from 2020–2024 as the base period to project country-to-country export potential for 2030, these inputs are operationalized through calculated drivers such as gravity model parameters, tariff impact factors, and projected GDP per-capita growth. Through an analysis of hidden potentials, demand hotspots, and market conditions that are most favorable to success, this method enables firms to focus on target countries, maximize returns, and global expansion with data, backed by accuracy.
By factoring in the projected importer demand gap that is currently unmet and could be potential opportunity, it identifies the potential for the Exporter (Country) among 190 countries, against the general trade analysis, which identifies the biggest importer or exporter.
To discover high-growth global markets and optimize your business strategy:
Click Here
Pricing
- Single User License$ 1,995
- Department License$ 2,400
- Site License$ 3,120
- Global License$ 3,795

Leadership Perspectives from Industry Events
Search
Thought Leadership and Analyst Meet


Our Clients
6WResearch In News
- Doha a strategic location for EV manufacturing hub: IPA Qatar
- Demand for luxury TVs surging in the GCC, says Samsung
- Empowering Growth: The Thriving Journey of Bangladesh’s Cable Industry
- Demand for luxury TVs surging in the GCC, says Samsung
- Video call with a traditional healer? Once unthinkable, it’s now common in South Africa
- Intelligent Buildings To Smooth GCC’s Path To Net Zero
Latest Reports
- New Zealand Aseptic Manufacturing Market (2026-2032)
- Netherlands Aseptic Manufacturing Market (2026-2032)
- Nauru Aseptic Manufacturing Market (2026-2032)
- Namibia Aseptic Manufacturing Market (2026-2032)
- Mozambique Aseptic Manufacturing Market (2026-2032)
- Montenegro Aseptic Manufacturing Market (2026-2032)
- Mongolia Aseptic Manufacturing Market (2026-2032)
- Monaco Aseptic Manufacturing Market (2026-2032)
- Micronesia Aseptic Manufacturing Market (2026-2032)
- Mauritius Aseptic Manufacturing Market (2026-2032)
Industry Events and Analyst Meet

HIMTEX 2026

India Refining Summit 2026

India EV Show 2026

EV tech India Expo 2026

Auto Tech Asia 2026
Whitepaper
- Middle East & Africa Commercial Security Market Click here to view more.
- Middle East & Africa Fire Safety Systems & Equipment Market Click here to view more.
- GCC Drone Market Click here to view more.
- Middle East Lighting Fixture Market Click here to view more.
- GCC Physical & Perimeter Security Market Click here to view more.