Qatar Aroma compounds Market (2026-2032) | Forecast, Industry, Analysis, Trends, Size, Companies, Share, Outlook, Value, Revenue & Growth
Market Forecast By Source (Natural, Synthetic), By Product (Benzenoids, Terpenoids, Musk Chemicals, Other), By Application (Food & Beverage, Fine Fragrances, Cosmetics & Toiletries, Soaps & Detergents, Household, Others) And Competitive Landscape
| Product Code: ETC026581 | Publication Date: Jul 2023 | Updated Date: Jun 2026 | Product Type: Report | |
| Publisher: 6Wresearch | Author: Ravi Bhandari | No. of Pages: 70 | No. of Figures: 35 | No. of Tables: 5 |
Qatar Aroma compounds Market Summary
The qatar aroma compounds market was estimated at USD 476 Million in 2025 and is projected to reach USD 640 Million by 2032, growing at a CAGR of 5.3% from 2026 to 2032.
Qatar Aroma compounds Market Year-wise Growth Rate and Key Drivers
This graph highlights how the Qatar Aroma compounds Market has steadily grown over the past five years, supported by major growth factors.
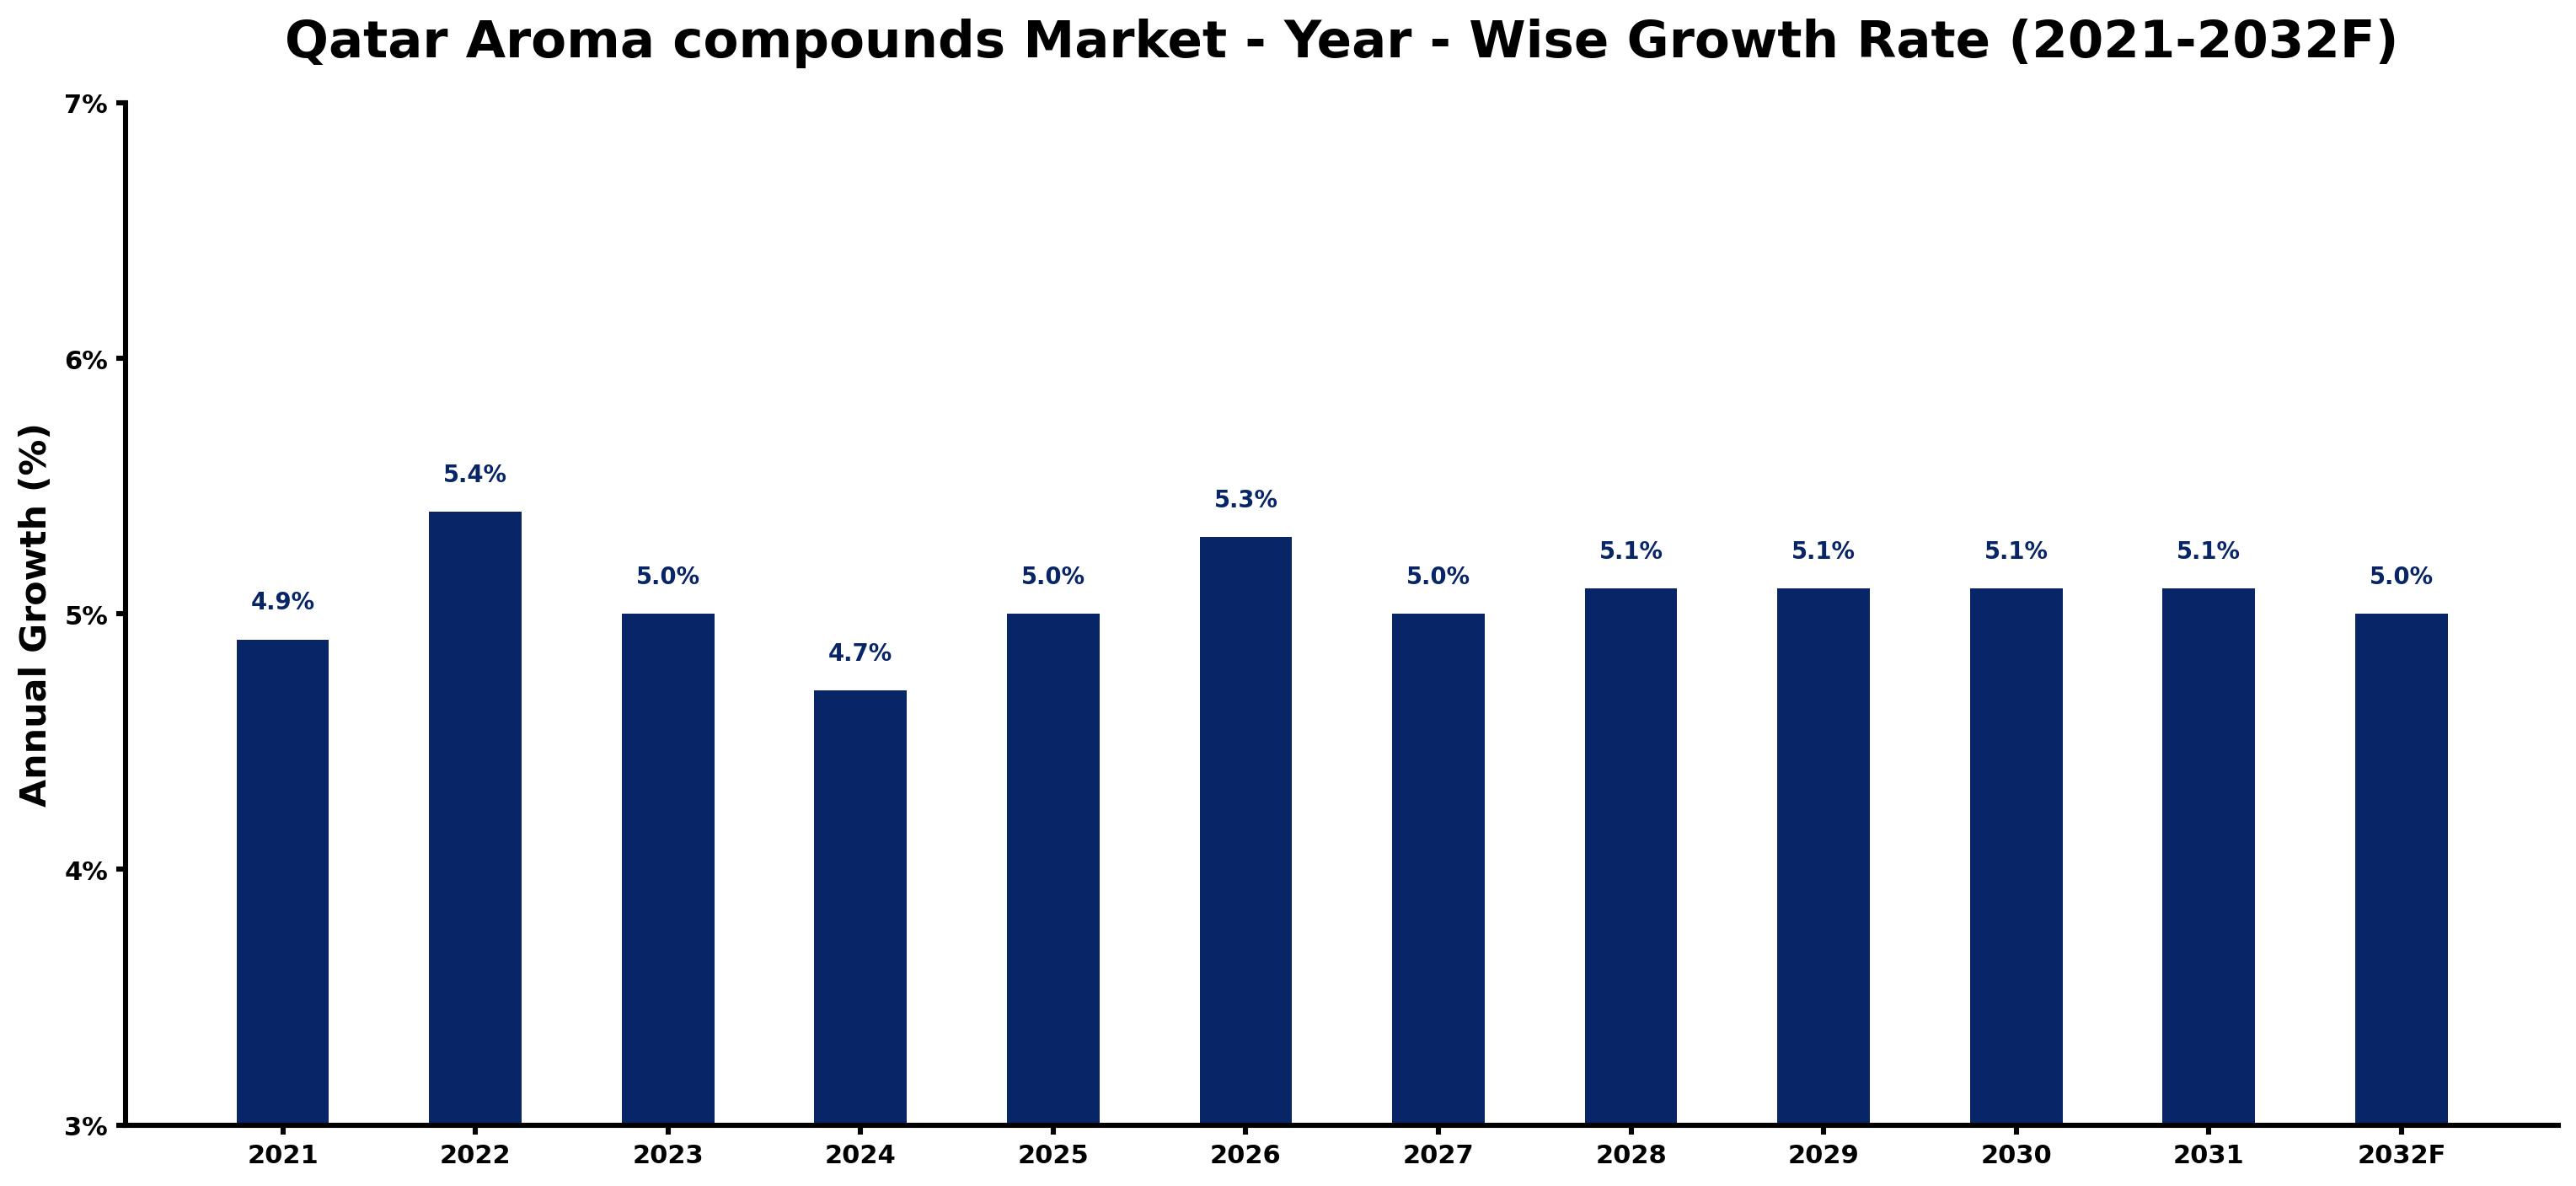
The table below presents the year wise growth rates along with the key drivers influencing the market
| Year | Growth Rate | Major Drivers |
| 2021 | 4.9% | Post-lockdown retail projects in Qatar signal a revival in aroma compound interest. |
| 2022 | 5.4% | Cultural significance of fragrances enhances market visibility among local consumers. |
| 2023 | 5.0% | Rising tourism boosts demand for unique scents in hotels and commercial spaces. |
| 2024 | 4.7% | Local production initiatives reduce reliance on imported aroma compounds significantly. |
| 2025 | 5.0% | Collaborations between fragrance houses and artisanal producers highlight innovation trends. |
| 2026 | 5.3% | Increased awareness of sustainable sourcing attracts environmentally conscious consumers. |
| 2027 | 5.0% | Local events celebrating heritage elevate traditional scents' popularity and market share. |
| 2028 | 5.1% | Emerging markets for personal and home fragrances diversify product offerings significantly. |
| 2029 | 5.1% | Digital marketing strategies enhance brand visibility across multiple consumer demographics. |
| 2030 | 5.1% | Multinational companies enter the market, intensifying competitive dynamics and innovation. |
| 2031 | 5.1% | Increased disposable incomes allow consumers to explore premium fragrance options extensively. |
| 2032 | 5.0% | Emerging wellness trends drive demand for aromatherapy-related products and services. |
Note - Market size estimations and growth projections presented in this report are based on 6Wresearch's advanced forecasting approach, validated with industry datasets as of June 2026.
Qatar Aroma compounds Market Synopsis
The Qatar Aroma compounds Market is projected to reach 5.3% and witness significant growth during the forecast period (2026-2032). Aroma compounds are essential volatile organic molecules that play a crucial role in imparting distinctive scents to a variety of products. Their application spans across multiple industries, including food, beverages, pharmaceuticals, and consumer goods, where they enhance flavor and provide aromatic appeal. The trend within Qatar shows a rising household adoption of aroma compounds in various formats, such as candles, incense sticks, and perfumes, driven by a growing demand for unique sensory experiences.
Qatar Aroma compounds Market Growth Drivers
The Qatar Aroma compounds Market is experiencing multiple growth drivers that support its expansion throughout the forecast period. Key factors include:
- The increase in disposable income levels among Qatari consumers is empowering them to spend more on premium aroma products, contributing to market growth.
- There is a marked rise in consumption from end-user sectors, particularly the food and beverage industry, where aroma compounds are increasingly utilized to enhance product appeal.
- The fragrance industry is witnessing an upward trend, with consumers gravitating towards products that provide distinctive olfactory experiences.
- Urbanization within Qatar is leading to higher purchasing power, facilitating consumers' access to a diverse range of aroma compounds.
- Technological advancements in production processes are enabling manufacturers to innovate and create more efficient aroma compounds suitable for various applications.
Qatar Aroma compounds Market Challenges and Restraints
Despite the favorable growth indicators, the Qatar Aroma compounds Market faces several challenges that could impede its progress. These include:
- Raw material procurement presents a significant challenge for manufacturers due to fluctuating prices and availability, impacting production stability.
- Regulatory compliance issues can create additional operational hurdles for companies, potentially hindering market entry and expansion efforts.
- Price sensitivity among consumers can limit market growth, as some may opt for cheaper alternatives instead of premium aroma products.
- The threat of substitution from synthetic aroma compounds may pose a risk to natural aroma markets, particularly in times of economic uncertainty.
- Global market disruptions, such as those experienced during the COVID-19 pandemic, can lead to unforeseen challenges in the supply chain, affecting overall market dynamics.
Qatar Aroma compounds Market Government Investment and Initiatives
Government initiatives in Qatar are pivotal in fostering the growth of the aroma compounds market. The government is actively promoting industrial diversification and innovation through various developmental plans, aimed at enhancing the overall economic landscape. These initiatives generally focus on:
- Encouraging investments in research and development to advance the production of aroma compounds, driving both efficiency and sustainability.
- Implementing favorable policies and incentives for local manufacturers to enhance their capabilities in producing high-quality aroma products.
- Supporting trade agreements that facilitate the export of Qatari aroma compounds, thereby broadening market access and increasing competitiveness.
- Establishing quality standards for aroma compounds to ensure consumer safety and trust, which is essential for market credibility.
- Promoting educational initiatives that increase awareness of aroma compound applications, particularly among young entrepreneurs and start-ups.
Qatar Aroma compounds Market Latest Developments (May 2025 - June 2026)
Recent developments in the Qatar Aroma compounds Market indicate a trend towards modernization and innovation. The period from May 2025 to June 2026 saw a number of industry shifts, including:
- An increased focus on sustainability, with manufacturers exploring eco-friendly sources for aroma compounds to meet consumer demand for greener products.
- The adoption of digital technologies in production processes, allowing for improved quality control and efficiency in manufacturing.
- Collaborations among local businesses aimed at leveraging shared resources and expertise to enhance product offerings in the aroma sector.
- A growing emphasis on marketing strategies that highlight the unique qualities of Qatari aroma products, positioning them as premium options in the international market.
- Ongoing research into the sensory effects of aroma compounds, contributing to a better understanding of consumer preferences and market dynamics.
Qatar Aroma compounds Market - Key Attractiveness of the Report
- 10 Years of Market Numbers
- Historical Data Starting from 2022 to 2025
- Base Year: 2025
- Forecast Data until 2032
- Key Performance Indicators Impacting the Market
- Major Upcoming Developments and Projects
The growth is primarily driven by rising disposable incomes, increased consumer demand in the food and beverage sector, and the fragrance industry.
Urbanization is increasing purchasing power and facilitating access to diverse aroma products, promoting market growth.
Challenges include raw material procurement, regulatory compliance, and consumer price sensitivity, which may limit market growth.
The government promotes industrial development through favorable policies, supporting research and development while enhancing market competitiveness.
Key Highlights of the Report:
- Qatar Aroma compounds Market Outlook
- Market Size of Qatar Aroma compounds Market, 2025
- Forecast of Qatar Aroma compounds Market, 2032
- Historical Data and Forecast of Qatar Aroma compounds Revenues & Volume for the Period 2022-2032F
- Qatar Aroma compounds Market Trend Evolution
- Qatar Aroma compounds Market Drivers and Challenges
- Qatar Aroma compounds Price Trends
- Qatar Aroma compounds Porter's Five Forces
- Qatar Aroma compounds Industry Life Cycle
- Historical Data and Forecast of Qatar Aroma compounds Market Revenues & Volume By Source for the Period 2022-2032F
- Historical Data and Forecast of Qatar Aroma compounds Market Revenues & Volume By Natural for the Period 2022-2032F
- Historical Data and Forecast of Qatar Aroma compounds Market Revenues & Volume By Synthetic for the Period 2022-2032F
- Historical Data and Forecast of Qatar Aroma compounds Market Revenues & Volume By Product for the Period 2022-2032F
- Historical Data and Forecast of Qatar Aroma compounds Market Revenues & Volume By Benzenoids for the Period 2022-2032F
- Historical Data and Forecast of Qatar Aroma compounds Market Revenues & Volume By Terpenoids for the Period 2022-2032F
- Historical Data and Forecast of Qatar Aroma compounds Market Revenues & Volume By Musk Chemicals for the Period 2022-2032F
- Historical Data and Forecast of Qatar Aroma compounds Market Revenues & Volume By Other for the Period 2022-2032F
- Historical Data and Forecast of Qatar Aroma compounds Market Revenues & Volume By Application for the Period 2022-2032F
- Historical Data and Forecast of Qatar Aroma compounds Market Revenues & Volume By Food & Beverage for the Period 2022-2032F
- Historical Data and Forecast of Qatar Aroma compounds Market Revenues & Volume By Fine Fragrances for the Period 2022-2032F
- Historical Data and Forecast of Qatar Aroma compounds Market Revenues & Volume By Cosmetics & Toiletries for the Period 2022-2032F
- Historical Data and Forecast of Qatar Aroma compounds Market Revenues & Volume By Soaps & Detergents for the Period 2022-2032F
- Historical Data and Forecast of Qatar Aroma compounds Market Revenues & Volume By Household for the Period 2022-2032F
- Historical Data and Forecast of Qatar Aroma compounds Market Revenues & Volume By Others for the Period 2022-2032F
- Qatar Aroma compounds Import Export Trade Statistics
- Market Opportunity Assessment By Source
- Market Opportunity Assessment By Product
- Market Opportunity Assessment By Application
- Qatar Aroma compounds Top Companies Market Share
- Qatar Aroma compounds Competitive Benchmarking By Technical and Operational Parameters
- Qatar Aroma compounds Company Profiles
- Qatar Aroma compounds Key Strategic Recommendations
Frequently Asked Questions About the Market Study (FAQs):
The growth is primarily driven by rising disposable incomes, increased consumer demand in the food and beverage sector, and the fragrance industry.
Urbanization is increasing purchasing power and facilitating access to diverse aroma products, promoting market growth.
Challenges include raw material procurement, regulatory compliance, and consumer price sensitivity, which may limit market growth.
The government promotes industrial development through favorable policies, supporting research and development while enhancing market competitiveness.
6Wresearch actively monitors the Qatar Aroma compounds Market and publishes its comprehensive annual report, highlighting emerging trends, growth drivers, revenue analysis, and forecast outlook. Our insights help businesses to make data-backed strategic decisions with ongoing market dynamics. Our analysts track relevent industries related to the Qatar Aroma compounds Market, allowing our clients with actionable intelligence and reliable forecasts tailored to emerging regional needs.
Yes, we provide customisation as per your requirements. To learn more, feel free to contact us on sales@6wresearch.com
1 Executive Summary |
2 Introduction |
2.1 Key Highlights of the Report |
2.2 Report Description |
2.3 Market Scope & Segmentation |
2.4 Research Methodology |
2.5 Assumptions |
3 Qatar Aroma compounds Market Overview |
3.1 Qatar Country Macro Economic Indicators |
3.2 Qatar Aroma compounds Market Revenues & Volume, 2022 & 2032F |
3.3 Qatar Aroma compounds Market - Industry Life Cycle |
3.4 Qatar Aroma compounds Market - Porter's Five Forces |
3.5 Qatar Aroma compounds Market Revenues & Volume Share, By Source, 2022 & 2032F |
3.6 Qatar Aroma compounds Market Revenues & Volume Share, By Product, 2022 & 2032F |
3.7 Qatar Aroma compounds Market Revenues & Volume Share, By Application, 2022 & 2032F |
4 Qatar Aroma compounds Market Dynamics |
4.1 Impact Analysis |
4.2 Market Drivers |
4.3 Market Restraints |
5 Qatar Aroma compounds Market Trends |
6 Qatar Aroma compounds Market, By Types |
6.1 Qatar Aroma compounds Market, By Source |
6.1.1 Overview and Analysis |
6.1.2 Qatar Aroma compounds Market Revenues & Volume, By Source, 2022-2032F |
6.1.3 Qatar Aroma compounds Market Revenues & Volume, By Natural, 2022-2032F |
6.1.4 Qatar Aroma compounds Market Revenues & Volume, By Synthetic, 2022-2032F |
6.2 Qatar Aroma compounds Market, By Product |
6.2.1 Overview and Analysis |
6.2.2 Qatar Aroma compounds Market Revenues & Volume, By Benzenoids, 2022-2032F |
6.2.3 Qatar Aroma compounds Market Revenues & Volume, By Terpenoids, 2022-2032F |
6.2.4 Qatar Aroma compounds Market Revenues & Volume, By Musk Chemicals, 2022-2032F |
6.2.5 Qatar Aroma compounds Market Revenues & Volume, By Other, 2022-2032F |
6.3 Qatar Aroma compounds Market, By Application |
6.3.1 Overview and Analysis |
6.3.2 Qatar Aroma compounds Market Revenues & Volume, By Food & Beverage, 2022-2032F |
6.3.3 Qatar Aroma compounds Market Revenues & Volume, By Fine Fragrances, 2022-2032F |
6.3.4 Qatar Aroma compounds Market Revenues & Volume, By Cosmetics & Toiletries, 2022-2032F |
6.3.5 Qatar Aroma compounds Market Revenues & Volume, By Soaps & Detergents, 2022-2032F |
6.3.6 Qatar Aroma compounds Market Revenues & Volume, By Household, 2022-2032F |
6.3.7 Qatar Aroma compounds Market Revenues & Volume, By Others, 2022-2032F |
7 Qatar Aroma compounds Market Import-Export Trade Statistics |
7.1 Qatar Aroma compounds Market Export to Major Countries |
7.2 Qatar Aroma compounds Market Imports from Major Countries |
8 Qatar Aroma compounds Market Key Performance Indicators |
9 Qatar Aroma compounds Market - Opportunity Assessment |
9.1 Qatar Aroma compounds Market Opportunity Assessment, By Source, 2022 & 2032F |
9.2 Qatar Aroma compounds Market Opportunity Assessment, By Product, 2022 & 2032F |
9.3 Qatar Aroma compounds Market Opportunity Assessment, By Application, 2022 & 2032F |
10 Qatar Aroma compounds Market - Competitive Landscape |
10.1 Qatar Aroma compounds Market Revenue Share, By Companies, 2025 |
10.2 Qatar Aroma compounds Market Competitive Benchmarking, By Operating and Technical Parameters |
11 Company Profiles |
12 Recommendations |
13 Disclaimer |
Global Go To Market Strategy - 2030
Export potential enables firms to identify high-growth global markets with greater confidence by combining advanced trade intelligence with a structured quantitative methodology. The framework analyzes emerging demand trends and country-level import patterns while integrating macroeconomic and trade datasets such as GDP and population forecasts, bilateral import–export flows, tariff structures, elasticity differentials between developed and developing economies, geographic distance, and import demand projections. Using weighted trade values from 2020–2024 as the base period to project country-to-country export potential for 2030, these inputs are operationalized through calculated drivers such as gravity model parameters, tariff impact factors, and projected GDP per-capita growth. Through an analysis of hidden potentials, demand hotspots, and market conditions that are most favorable to success, this method enables firms to focus on target countries, maximize returns, and global expansion with data, backed by accuracy.
By factoring in the projected importer demand gap that is currently unmet and could be potential opportunity, it identifies the potential for the Exporter (Country) among 190 countries, against the general trade analysis, which identifies the biggest importer or exporter.
To discover high-growth global markets and optimize your business strategy:
Click Here
Pricing
- Single User License$ 1,995
- Department License$ 2,400
- Site License$ 3,120
- Global License$ 3,795

Leadership Perspectives from Industry Events
Search
Thought Leadership and Analyst Meet


Our Clients
6WResearch In News
- India Air Conditioner Market Set for Strong Rebound in 2026 After Weather-Led Correction and GST-Driven Recovery: 6Wresearch
- ADAS in India: How Automatic Emergency Braking, Blind Spot Detection & Driver Monitoring are Transforming Road Safety
- Doha a strategic location for EV manufacturing hub: IPA Qatar
- Demand for luxury TVs surging in the GCC, says Samsung
- Empowering Growth: The Thriving Journey of Bangladesh’s Cable Industry
- Demand for luxury TVs surging in the GCC, says Samsung
Latest Reports
- Nicaragua RPG Gaming Market (2026-2032)
- New Zealand RPG Gaming Market (2026-2032)
- Netherlands RPG Gaming Market (2026-2032)
- Nauru RPG Gaming Market (2026-2032)
- Namibia RPG Gaming Market (2026-2032)
- Mozambique RPG Gaming Market (2026-2032)
- Montenegro RPG Gaming Market (2026-2032)
- Mongolia RPG Gaming Market (2026-2032)
- Monaco RPG Gaming Market (2026-2032)
- Micronesia RPG Gaming Market (2026-2032)
Industry Events and Analyst Meet

EV India Expo 2026

HIMTEX 2026

India Refining Summit 2026

India EV Show 2026

EV tech India Expo 2026
Whitepaper
- Middle East & Africa Commercial Security Market Click here to view more.
- Middle East & Africa Fire Safety Systems & Equipment Market Click here to view more.
- GCC Drone Market Click here to view more.
- Middle East Lighting Fixture Market Click here to view more.
- GCC Physical & Perimeter Security Market Click here to view more.