Qatar Cable Cars & Ropeways Market (2026-2032) Outlook | Value, Revenue, Growth, Size, Forecast, Share, Analysis, Companies, Trends & Industry
Market Forecast By Type (Tourism, Material handling, Public transportation, Mining industries), By Sales Channel (OEM (Original Equipment Manufacturer), Aftermarket) And Competitive Landscape
| Product Code: ETC285401 | Publication Date: Aug 2022 | Updated Date: Jul 2026 | Product Type: Market Research Report | |
| Publisher: 6Wresearch | Author: Ravi Bhandari | No. of Pages: 75 | No. of Figures: 35 | No. of Tables: 20 |
Qatar Cable Cars & Ropeways Market Size, Share & Growth Rate
The Qatar Cable Cars & Ropeways Market was estimated at USD 417 Million in 2025 and is projected to reach USD 569 Million by 2032, growing at a CAGR of 4.5% from 2026 to 2032. This growth trajectory is fueled by the increasing integration of cable cars and ropeways into Qatar's urban landscape, particularly as the nation focuses on enhancing its tourism offerings. With the government's commitment to developing unique leisure attractions, there is an evident push for innovative transport solutions that can provide both functionality and exceptional visitor experiences.
Qatar Cable Cars & Ropeways Market Year-wise Growth Rate and Key Drivers
This graph highlights how the Qatar Cable Cars & Ropeways Market has steadily grown over the years, supported by major growth factors.
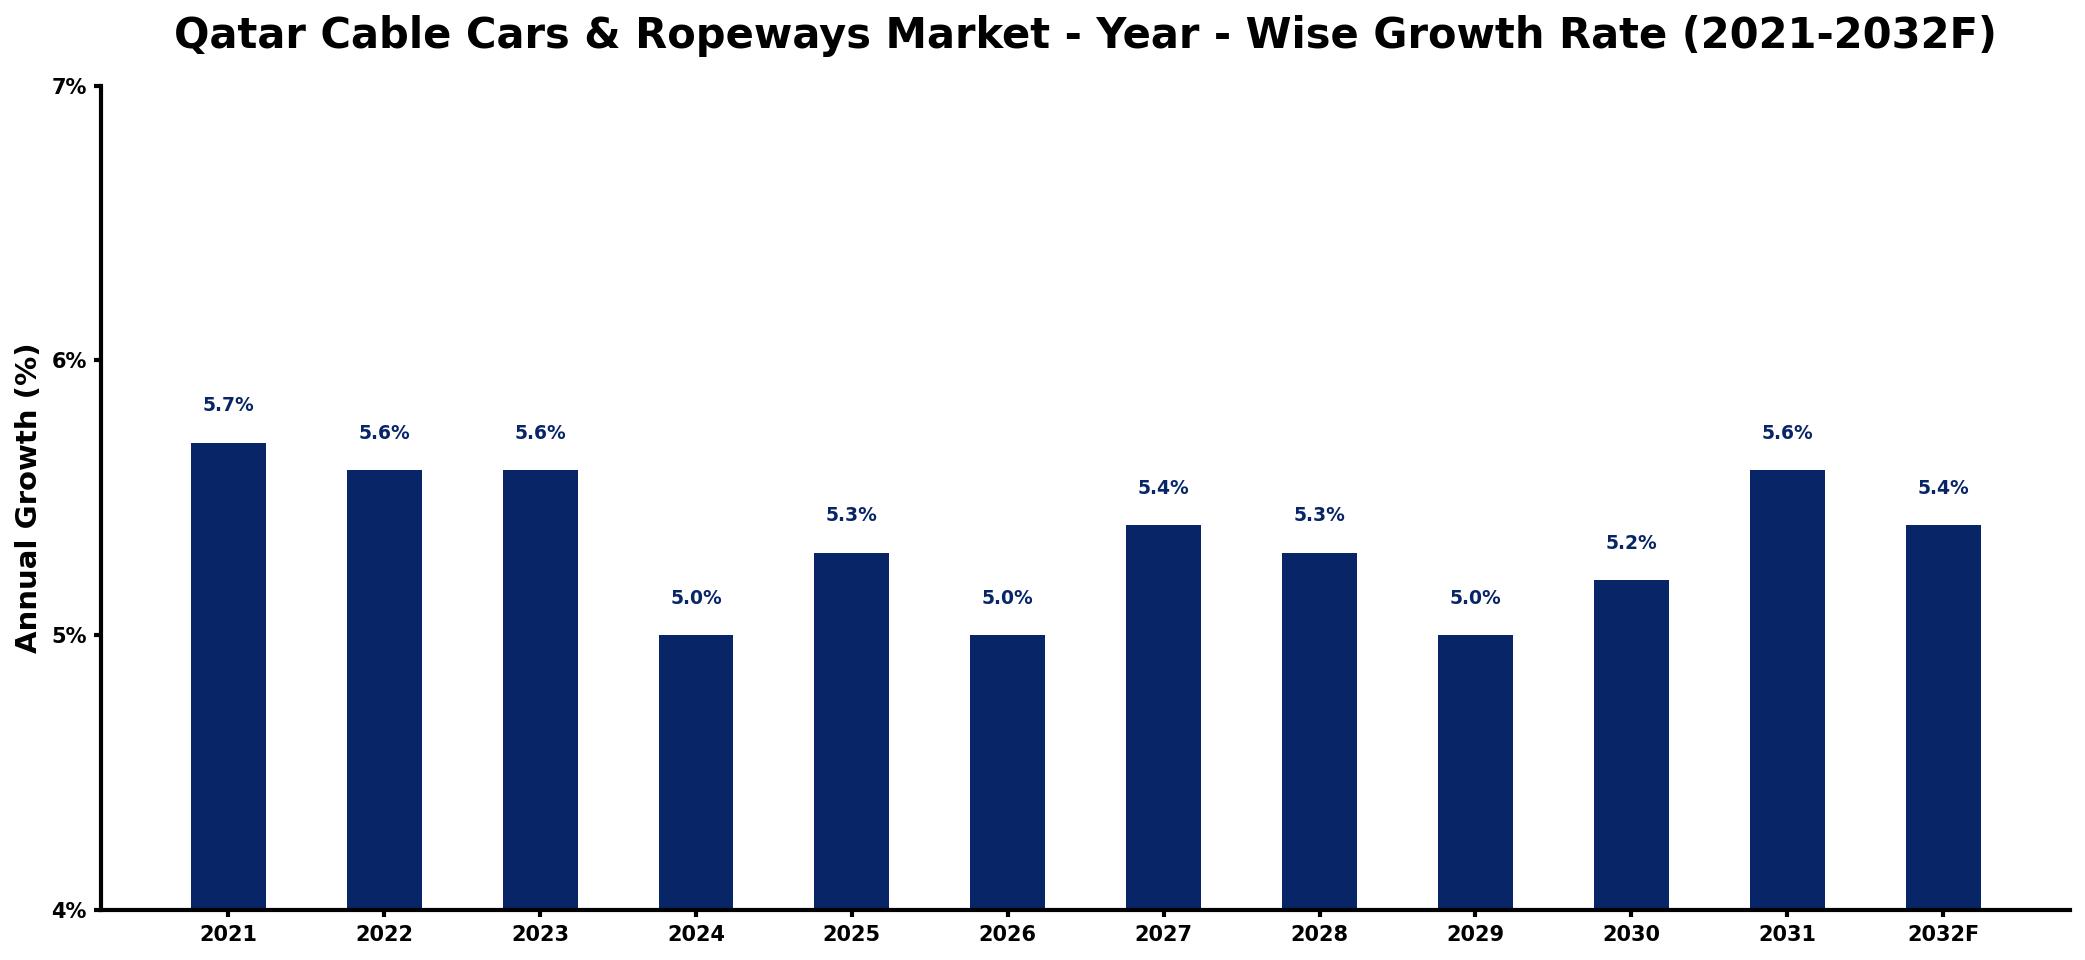
The table below presents the year‑wise growth rates along with the key drivers influencing the market
| Year | Growth Rate | Major Drivers |
| 2021 | 5.7% | Increased tourism and leisure activities |
| 2022 | 5.6% | Growing urban infrastructure investments |
| 2023 | 5.6% | Expansion of entertainment venues |
| 2024 | 5.0% | Rising interest in eco-friendly transport |
| 2025 | 5.3% | Boost in real estate developments |
| 2026 | 5.0% | Enhanced public transportation integration |
| 2027 | 5.4% | Development of scenic tourist attractions |
| 2028 | 5.3% | Focus on sustainable urban mobility |
| 2029 | 5.0% | Increase in cityscape beautification projects |
| 2030 | 5.2% | Growing demand for adventure tourism |
| 2031 | 5.6% | Rising international event hosting |
| 2032 | 5.4% | increased capital investment inflows |
Note: Market size estimations and growth projections presented in this report are based on 6Wresearch's proprietary forecasting methodology, utilizing the latest available industry data, government publications, and primary research inputs.
Qatar Cable Cars & Ropeways Market Synopsis
The cable cars and ropeways market in Qatar has been witnessing a notable transformation, becoming an integral component of the tourism infrastructure. These systems are not only functional but also serve as attractions in their own right, offering breathtaking aerial views of the countrys striking landscapes and vibrant urban environments.
As Qatar continues to position itself as a premier destination for global travelers, the demand for cable cars and ropeways is set to surge. Initiatives to establish eco-friendly transportation solutions, coupled with ongoing urban development projects, are expected to further bolster market growth and diversify the leisure landscape.
- The market is positioned for substantial growth, driven primarily by tourism and urban development initiatives.
- Integration of cable systems into public transport is enhancing accessibility and promoting eco-friendly travel.
- Innovative partnerships between international manufacturers and local businesses are shaping market dynamics.
- Qatars unique geographical features present both opportunities and challenges for cable car operations.
- Ongoing infrastructure projects are anticipated to increase demand and improve tourist experiences significantly.
While the Qatar Cable Cars and Ropeways Market exhibits promising growth potential, several restraints could impact its trajectory. Extreme climatic conditions, including intense heat and frequent sandstorms, pose operational challenges that necessitate rigorous maintenance and technology adaptation. Additionally, fluctuations in the tourism sector due to geopolitical tensions or global economic uncertainties can create volatility, affecting ridership levels. Moreover, the focus on passenger safety in a politically sensitive region requires ongoing investment in security measures and technology.
Currently, the market is witnessing several trends that reflect a growing demand for sustainability and innovation. The increasing preference for eco-friendly transport solutions aligns with global sustainability goals, making cable cars and ropeways an attractive alternative. Additionally, advancements in technology, such as enhanced safety systems and energy-efficient designs, are encouraging more stakeholders to invest in these systems. The emphasis on creating experiential tourism opportunities is further driving the integration of cable cars into leisure activities and urban experiences.
The Qatar Cable Cars and Ropeways Market presents several lucrative opportunities for growth and investment. The continued expansion of tourist attractions and urban infrastructure offers a fertile ground for new installations. Collaborations between international technology providers and local authorities can enhance service efficiency while elevating the overall tourist experience. Furthermore, innovative developments in cabin designs and customer service technologies could position cable systems as preferred modes of transport within urban settings.
The Qatari government has been proactive in promoting the development of cable cars and ropeways as part of its broader strategy to enhance tourism and urban mobility. Initiatives aimed at diversifying the tourism sector and investment in public infrastructure reflect a commitment to integrating these systems into the national transport framework. Government policies supporting sustainable tourism are also paving the way for eco-friendly transportation solutions, further stimulating interest in cable car and ropeway projects.
Looking ahead to 2026-2032, the Qatar Cable Cars & Ropeways Market is set to evolve significantly. With ongoing urban development projects and an unwavering focus on enhancing tourist experiences, the demand for cable transportation systems is likely to rise. Strategic collaborations and technological advancements will play a crucial role in overcoming operational challenges, thereby solidifying cable cars and ropeways as viable and attractive components of Qatar's transport infrastructure. The markets resilience in the face of challenges indicates a promising future.
Recent developments in the Qatar Cable Cars and Ropeways Market highlight a shift towards modern, sustainable transportation solutions. Several projects are underway that aim to integrate cable systems within key urban areas and tourist destinations, showcasing innovative designs and improved technology. Additionally, there is a notable increase in collaborative efforts among various stakeholders to ensure the successful implementation of these projects, reflecting a commitment to both quality and safety in the burgeoning market.
- 10 Years of Market Numbers
- Historical Data Starting from 2022 to 2025
- Base Year: 2025
- Forecast Data until 2032
- Key Performance Indicators Impacting the Market
- Major Upcoming Developments and Projects
Key Highlights of the Report:
- Qatar Cable Cars & Ropeways Market Outlook
- Market Size of Qatar Cable Cars & Ropeways Market, 2025
- Forecast of Qatar Cable Cars & Ropeways Market, 2032
- Historical Data and Forecast of Qatar Cable Cars & Ropeways Revenues & Volume for the Period 2022-2032F
- Qatar Cable Cars & Ropeways Market Trend Evolution
- Qatar Cable Cars & Ropeways Market Drivers and Challenges
- Qatar Cable Cars & Ropeways Price Trends
- Qatar Cable Cars & Ropeways Porter's Five Forces
- Qatar Cable Cars & Ropeways Industry Life Cycle
- Historical Data and Forecast of Qatar Cable Cars & Ropeways Market Revenues & Volume By Type for the Period 2022-2032F
- Historical Data and Forecast of Qatar Cable Cars & Ropeways Market Revenues & Volume By Tourism for the Period 2022-2032F
- Historical Data and Forecast of Qatar Cable Cars & Ropeways Market Revenues & Volume By Material handling for the Period 2022-2032F
- Historical Data and Forecast of Qatar Cable Cars & Ropeways Market Revenues & Volume By Public transportation for the Period 2022-2032F
- Historical Data and Forecast of Qatar Cable Cars & Ropeways Market Revenues & Volume By Mining industries for the Period 2022-2032F
- Historical Data and Forecast of Qatar Cable Cars & Ropeways Market Revenues & Volume By Sales Channel for the Period 2022-2032F
- Historical Data and Forecast of Qatar Cable Cars & Ropeways Market Revenues & Volume By OEM (Original Equipment Manufacturer) for the Period 2022-2032F
- Historical Data and Forecast of Qatar Cable Cars & Ropeways Market Revenues & Volume By Aftermarket for the Period 2022-2032F
- Qatar Cable Cars & Ropeways Import Export Trade Statistics
- Market Opportunity Assessment By Type
- Market Opportunity Assessment By Sales Channel
- Qatar Cable Cars & Ropeways Top Companies Market Share
- Qatar Cable Cars & Ropeways Competitive Benchmarking By Technical and Operational Parameters
- Qatar Cable Cars & Ropeways Company Profiles
- Qatar Cable Cars & Ropeways Key Strategic Recommendations
Frequently Asked Questions About the Market Study (FAQs):
The Qatar Cable Cars & Ropeways Market was estimated at USD 417 Million in 2025, with projections indicating it could reach USD 569 Million by 2032.
Urban development projects in Qatar are integrating cable cars as key components of transportation systems, emphasizing the need for efficient and scenic travel solutions that enhance accessibility.
The market must navigate extreme climatic conditions and geopolitical factors that can affect tourism and operational safety, requiring strategic planning and investment in technology.
The government promotes investments in infrastructure, sustainable tourism initiatives, and public-private partnerships to enhance the market's potential for growth and innovation.
Innovations in safety systems, energy efficiency, and user experience are influencing new installations, making cable cars more attractive as both transportation and leisure options.
6Wresearch actively monitors the Qatar Cable Cars & Ropeways Market and publishes its comprehensive annual report, highlighting emerging trends, growth drivers, revenue analysis, and forecast outlook. Our insights help businesses to make data-backed strategic decisions with ongoing market dynamics. Our analysts track relevent industries related to the Qatar Cable Cars & Ropeways Market, allowing our clients with actionable intelligence and reliable forecasts tailored to emerging regional needs.
Yes, we provide customisation as per your requirements. To learn more, feel free to contact us on sales@6wresearch.com
1 Executive Summary |
2 Introduction |
2.1 Key Highlights of the Report |
2.2 Report Description |
2.3 Market Scope & Segmentation |
2.4 Research Methodology |
2.5 Assumptions |
3 Qatar Cable Cars & Ropeways Market Overview |
3.1 Qatar Country Macro Economic Indicators |
3.2 Qatar Cable Cars & Ropeways Market Revenues & Volume, 2022 & 2032F |
3.3 Qatar Cable Cars & Ropeways Market - Industry Life Cycle |
3.4 Qatar Cable Cars & Ropeways Market - Porter's Five Forces |
3.5 Qatar Cable Cars & Ropeways Market Revenues & Volume Share, By Type, 2022 & 2032F |
3.6 Qatar Cable Cars & Ropeways Market Revenues & Volume Share, By Sales Channel, 2022 & 2032F |
4 Qatar Cable Cars & Ropeways Market Dynamics |
4.1 Impact Analysis |
4.2 Market Drivers |
4.2.1 Increasing tourism in Qatar, driving demand for unique attractions such as cable cars and ropeways. |
4.2.2 Government initiatives to boost infrastructure development and tourism in the country. |
4.2.3 Growing demand for eco-friendly transportation solutions in Qatar. |
4.3 Market Restraints |
4.3.1 High initial investment costs for establishing cable cars and ropeways. |
4.3.2 Limited availability of suitable terrains for installation. |
4.3.3 Regulatory hurdles and permitting challenges for construction and operation. |
5 Qatar Cable Cars & Ropeways Market Trends |
6 Qatar Cable Cars & Ropeways Market, By Types |
6.1 Qatar Cable Cars & Ropeways Market, By Type |
6.1.1 Overview and Analysis |
6.1.2 Qatar Cable Cars & Ropeways Market Revenues & Volume, By Type, 2022-2032F |
6.1.3 Qatar Cable Cars & Ropeways Market Revenues & Volume, By Tourism, 2022-2032F |
6.1.4 Qatar Cable Cars & Ropeways Market Revenues & Volume, By Material handling, 2022-2032F |
6.1.5 Qatar Cable Cars & Ropeways Market Revenues & Volume, By Public transportation, 2022-2032F |
6.1.6 Qatar Cable Cars & Ropeways Market Revenues & Volume, By Mining industries, 2022-2032F |
6.2 Qatar Cable Cars & Ropeways Market, By Sales Channel |
6.2.1 Overview and Analysis |
6.2.2 Qatar Cable Cars & Ropeways Market Revenues & Volume, By OEM (Original Equipment Manufacturer), 2022-2032F |
6.2.3 Qatar Cable Cars & Ropeways Market Revenues & Volume, By Aftermarket, 2022-2032F |
7 Qatar Cable Cars & Ropeways Market Import-Export Trade Statistics |
7.1 Qatar Cable Cars & Ropeways Market Export to Major Countries |
7.2 Qatar Cable Cars & Ropeways Market Imports from Major Countries |
8 Qatar Cable Cars & Ropeways Market Key Performance Indicators |
8.1 Average daily ridership per cable car or ropeway. |
8.2 Percentage of revenue from ticket sales compared to operating costs. |
8.3 Customer satisfaction ratings for the cable car or ropeway experience. |
8.4 Average wait times for customers to board the cable cars or ropeways. |
8.5 Percentage of repeat visitors using the cable cars or ropeways. |
9 Qatar Cable Cars & Ropeways Market - Opportunity Assessment |
9.1 Qatar Cable Cars & Ropeways Market Opportunity Assessment, By Type, 2022 & 2032F |
9.2 Qatar Cable Cars & Ropeways Market Opportunity Assessment, By Sales Channel, 2022 & 2032F |
10 Qatar Cable Cars & Ropeways Market - Competitive Landscape |
10.1 Qatar Cable Cars & Ropeways Market Revenue Share, By Companies, 2025 |
10.2 Qatar Cable Cars & Ropeways Market Competitive Benchmarking, By Operating and Technical Parameters |
11 Company Profiles |
12 Recommendations |
13 Disclaimer |
Global Go To Market Strategy - 2030
Export potential enables firms to identify high-growth global markets with greater confidence by combining advanced trade intelligence with a structured quantitative methodology. The framework analyzes emerging demand trends and country-level import patterns while integrating macroeconomic and trade datasets such as GDP and population forecasts, bilateral import–export flows, tariff structures, elasticity differentials between developed and developing economies, geographic distance, and import demand projections. Using weighted trade values from 2020–2024 as the base period to project country-to-country export potential for 2030, these inputs are operationalized through calculated drivers such as gravity model parameters, tariff impact factors, and projected GDP per-capita growth. Through an analysis of hidden potentials, demand hotspots, and market conditions that are most favorable to success, this method enables firms to focus on target countries, maximize returns, and global expansion with data, backed by accuracy.
By factoring in the projected importer demand gap that is currently unmet and could be potential opportunity, it identifies the potential for the Exporter (Country) among 190 countries, against the general trade analysis, which identifies the biggest importer or exporter.
To discover high-growth global markets and optimize your business strategy:
Click Here
Pricing
- Single User License$ 1,995
- Department License$ 2,400
- Site License$ 3,120
- Global License$ 3,795

Leadership Perspectives from Industry Events
Search
Thought Leadership and Analyst Meet


Our Clients
6WResearch In News
- India Air Conditioner Market Set for Strong Rebound in 2026 After Weather-Led Correction and GST-Driven Recovery: 6Wresearch
- ADAS in India: How Automatic Emergency Braking, Blind Spot Detection & Driver Monitoring are Transforming Road Safety
- Doha a strategic location for EV manufacturing hub: IPA Qatar
- Demand for luxury TVs surging in the GCC, says Samsung
- Empowering Growth: The Thriving Journey of Bangladesh’s Cable Industry
- Demand for luxury TVs surging in the GCC, says Samsung
Latest Reports
- Nicaragua RPG Gaming Market (2026-2032)
- New Zealand RPG Gaming Market (2026-2032)
- Netherlands RPG Gaming Market (2026-2032)
- Nauru RPG Gaming Market (2026-2032)
- Namibia RPG Gaming Market (2026-2032)
- Mozambique RPG Gaming Market (2026-2032)
- Montenegro RPG Gaming Market (2026-2032)
- Mongolia RPG Gaming Market (2026-2032)
- Monaco RPG Gaming Market (2026-2032)
- Micronesia RPG Gaming Market (2026-2032)
Industry Events and Analyst Meet

EV India Expo 2026

HIMTEX 2026

India Refining Summit 2026

India EV Show 2026

EV tech India Expo 2026
Whitepaper
- Middle East & Africa Commercial Security Market Click here to view more.
- Middle East & Africa Fire Safety Systems & Equipment Market Click here to view more.
- GCC Drone Market Click here to view more.
- Middle East Lighting Fixture Market Click here to view more.
- GCC Physical & Perimeter Security Market Click here to view more.