Qatar Clay Products And Refractories Market (2026-2032) Outlook | Revenue, Growth, Size, Trends, Industry, Value, Analysis, Share, Forecast & Companies
Market Forecast By Type (Pottery, Ceramics, Plumbing Fixtures, Clay Building Material, Refractories), By Process (Grinding , Cutting , Mixing , Shaping, Honing), By Material (Quartz, Chamatte, Sand, Sawdust, Slag, Pulverized , Coal), By End-User Vertical (Construction , Automobiles , Steel Making , Cosmetics, Food Industry, Others) And Competitive Landscape
| Product Code: ETC319121 | Publication Date: Aug 2022 | Updated Date: Jul 2026 | Product Type: Market Research Report | |
| Publisher: 6Wresearch | Author: Ravi Bhandari | No. of Pages: 75 | No. of Figures: 35 | No. of Tables: 20 |
Qatar Clay Products And Refractories Market Size, Share & Growth Rate
The Qatar Clay Products And Refractories Market was estimated at USD 459 Million in 2025 and is projected to reach USD 604 Million by 2032, growing at a CAGR of 4.0% from 2026 to 2032. This growth trajectory is primarily fueled by increasing demand from the construction, steel, and ceramics industries, which rely heavily on high-performance clay-based refractory materials. As Qatar continues its strategic economic diversification efforts, the need for specialized clay products tailored to meet industry-specific requirements is likely to drive further expansion in the market.
Qatar Clay Products And Refractories Market Year-wise Growth Rate and Key Drivers
This graph highlights how the Qatar Clay Products And Refractories Market has steadily grown over the years, supported by major growth factors.
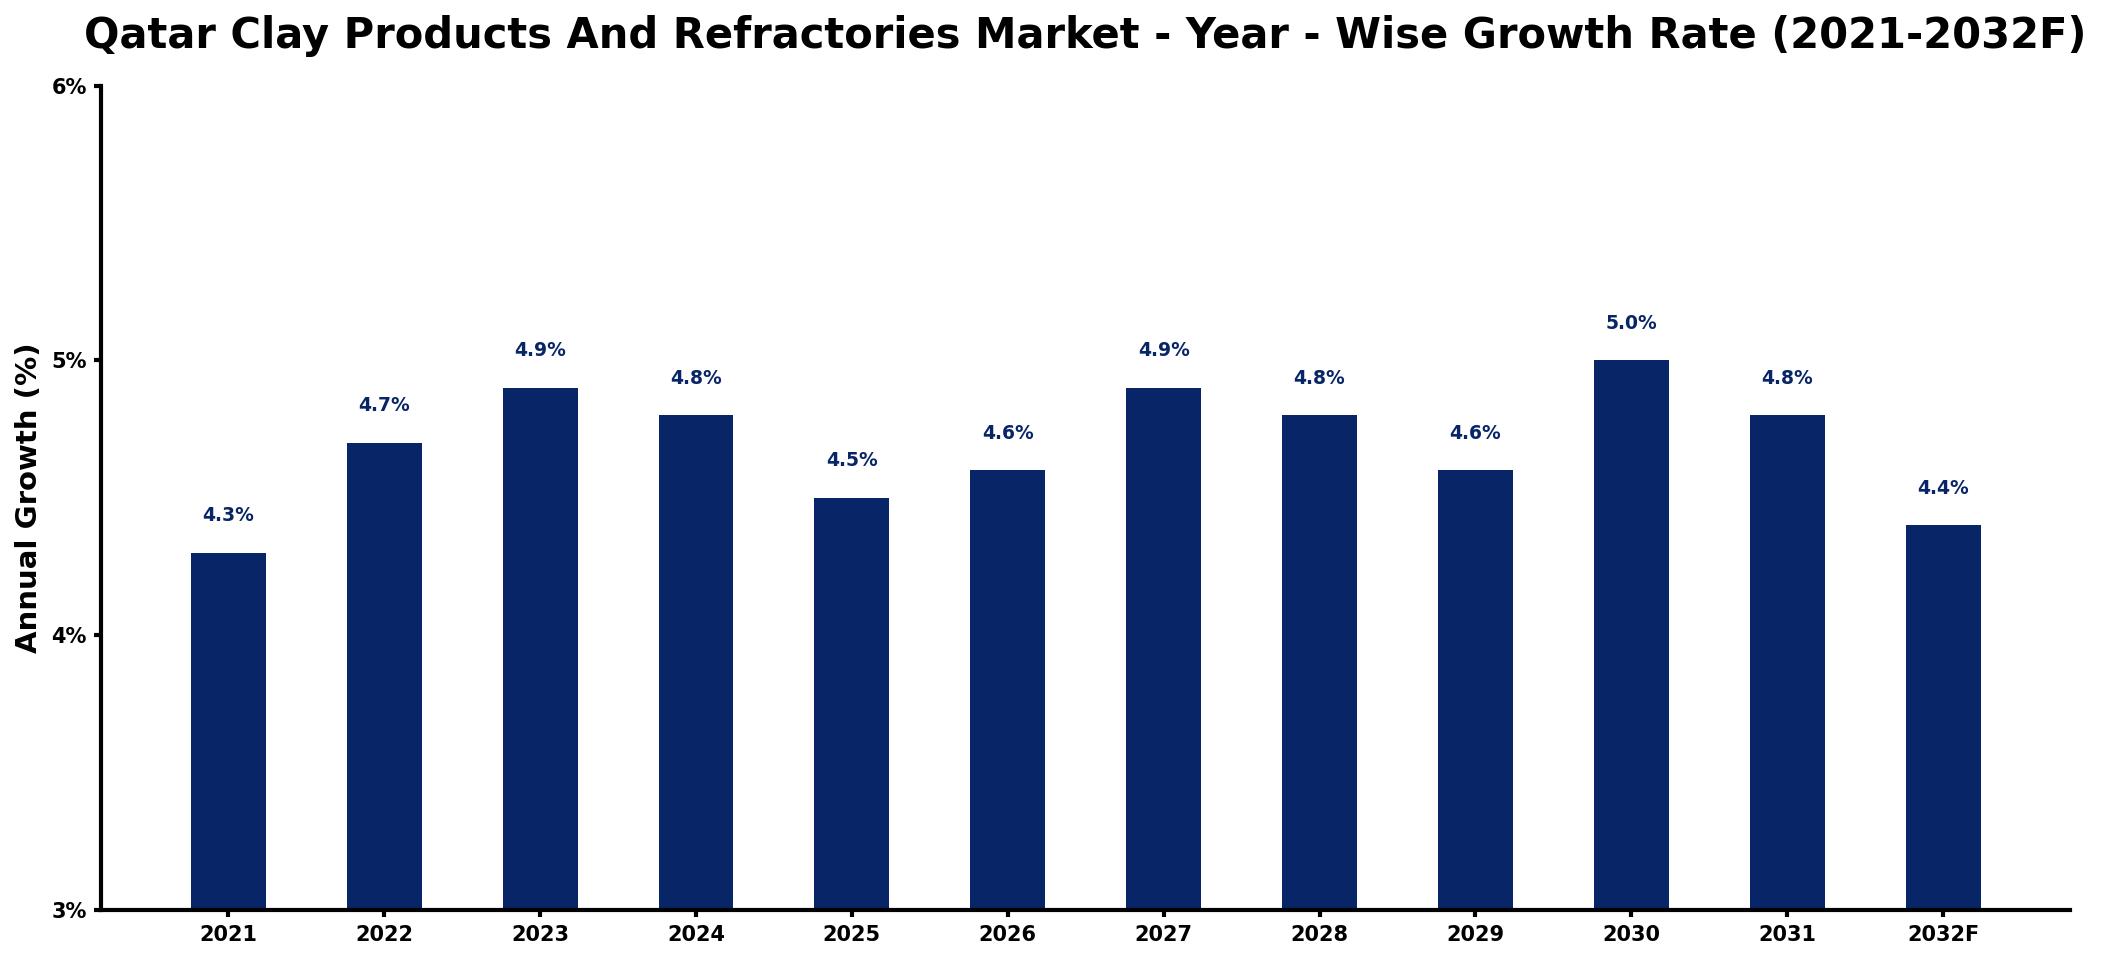
The table below presents the year‑wise growth rates along with the key drivers influencing the market
| Year | Growth Rate | Major Drivers |
| 2021 | 4.3% | Construction sector expansion drives demand |
| 2022 | 4.7% | Increased infrastructure projects funding |
| 2023 | 4.9% | Rising energy sector investments |
| 2024 | 4.8% | Growing manufacturing capabilities enhance supply |
| 2025 | 4.5% | Strengthened export markets for materials |
| 2026 | 4.6% | Technological advancements improve efficiency |
| 2027 | 4.9% | Urbanization trends boost construction activity |
| 2028 | 4.8% | Environmental regulations enhance product quality |
| 2029 | 4.6% | Emerging markets increase consumption rates |
| 2030 | 5.0% | Sustainability initiatives drive material innovations |
| 2031 | 4.8% | Government initiatives support industrial growth |
| 2032 | 4.4% | Diversification strategies expand market reach |
Note: Market size estimations and growth projections presented in this report are based on 6Wresearch's proprietary forecasting methodology, utilizing the latest available industry data, government publications, and primary research inputs.
Qatar Clay Products And Refractories Market Synopsis
The clay products and refractories market in Qatar has recently shown a promising momentum, bolstered by robust demand from various industrial sectors. However, as market dynamics evolve, a notable shift toward advanced manufacturing techniques and material specifications is on the horizon, indicating a transformative phase ahead.
With Qatar's ongoing industrialization initiatives, the market is positioned for steady growth, particularly as businesses seek innovative solutions to enhance product performance. This focus on quality and efficiency is expected to play a critical role in shaping the future landscape of the clay products and refractories sector in the region.
Qatar Clay Products And Refractories Market Key Takeaways
- The market is driven by demand from construction and manufacturing sectors, essential for high-temperature applications.
- Technological advancements are enhancing product quality and operational efficiency.
- The market is set to rebound strongly post-COVID-19, with growing infrastructure investments.
- Government initiatives are paving the way for increased industrial development and diversification.
- Regional investments in petrochemicals and metalworking further stimulate the market.
Evaluation of Restraints in Qatar Clay Products And Refractories Market
Despite its robust growth potential, the Qatar Clay Products and Refractories Market faces some notable restraints. The highly specialized nature of its products makes it vulnerable to fluctuations in the construction and industrial sectors, which can directly impact demand. Additionally, ensuring consistent product quality presents challenges, particularly given variations in raw materials and production techniques. These factors could impede the market's ability to maintain the upward momentum anticipated over the forecast period.
Qatar Clay Products And Refractories Market Trends
Current trends within the Qatar Clay Products and Refractories Market indicate a growing emphasis on sustainability and environmental stewardship. Companies are increasingly seeking eco-friendly materials and production processes, which resonate with global trends towards reduced carbon footprints. Innovations in manufacturing, such as the use of advanced composites and smart materials, are also gaining traction, enhancing the durability and efficiency of refractory applications.
Qatar Clay Products And Refractories Market Opportunities
As Qatar invests heavily in its industrial infrastructure, numerous growth opportunities are emerging within the clay products and refractories sector. Expansion into high-demand sectors such as renewable energy, particularly in solar and wind power applications, presents a unique avenue for growth. Furthermore, the exploration of new markets abroad could facilitate increased exports of clay products, particularly to regions with growing industrial bases.
Government Initiatives in the Qatar Clay Products And Refractories Market
The Qatari government is actively promoting industrial diversification through various initiatives aimed at bolstering domestic manufacturing capabilities. This includes public spending on infrastructure projects and incentives for companies focused on research and development in refractory technologies. These efforts not only stimulate local businesses but also attract foreign investment, further enhancing the growth potential of the clay products and refractories market.
Future Insights of the Qatar Clay Products And Refractories Market
Looking ahead to 2026-2032, the Qatar Clay Products and Refractories Market is set to evolve significantly, driven by ongoing technological advancements and increased industrial activity. Demand from the construction and petrochemical sectors will likely remain strong, as Qatar continues to modernize its infrastructure. Additionally, as companies adopt more sustainable practices, innovations in product formulations are expected to emerge, catering to a rapidly changing industrial landscape.
Qatar Clay Products And Refractories Market Latest Developments (2025 - 2026)
In recent months, the Qatar Clay Products and Refractories Market has witnessed a surge in interest related to research and development initiatives aimed at enhancing material performance. There has been a noticeable increase in partnerships between local manufacturers and international technology providers, focusing on innovative production methods. Additionally, several government-backed projects have started to roll out, emphasizing infrastructure development and sustainability, which are expected to further energize the market landscape.
Qatar Clay Products And Refractories Market - Key Attractiveness of the Report
- 10 Years of Market Numbers
- Historical Data Starting from 2022 to 2025
- Base Year: 2025
- Forecast Data until 2032
- Key Performance Indicators Impacting the Market
- Major Upcoming Developments and Projects
Key Highlights of the Report:
- Qatar Clay Products And Refractories Market Outlook
- Market Size of Qatar Clay Products And Refractories Market, 2025
- Forecast of Qatar Clay Products And Refractories Market, 2032
- Historical Data and Forecast of Qatar Clay Products And Refractories Revenues & Volume for the Period 2022-2032F
- Qatar Clay Products And Refractories Market Trend Evolution
- Qatar Clay Products And Refractories Market Drivers and Challenges
- Qatar Clay Products And Refractories Price Trends
- Qatar Clay Products And Refractories Porter's Five Forces
- Qatar Clay Products And Refractories Industry Life Cycle
- Historical Data and Forecast of Qatar Clay Products And Refractories Market Revenues & Volume By Type for the Period 2022-2032F
- Historical Data and Forecast of Qatar Clay Products And Refractories Market Revenues & Volume By Pottery for the Period 2022-2032F
- Historical Data and Forecast of Qatar Clay Products And Refractories Market Revenues & Volume By Ceramics for the Period 2022-2032F
- Historical Data and Forecast of Qatar Clay Products And Refractories Market Revenues & Volume By Plumbing Fixtures for the Period 2022-2032F
- Historical Data and Forecast of Qatar Clay Products And Refractories Market Revenues & Volume By Clay Building Material for the Period 2022-2032F
- Historical Data and Forecast of Qatar Clay Products And Refractories Market Revenues & Volume By Refractories for the Period 2022-2032F
- Historical Data and Forecast of Qatar Clay Products And Refractories Market Revenues & Volume By Process for the Period 2022-2032F
- Historical Data and Forecast of Qatar Clay Products And Refractories Market Revenues & Volume By Grinding for the Period 2022-2032F
- Historical Data and Forecast of Qatar Clay Products And Refractories Market Revenues & Volume By Cutting for the Period 2022-2032F
- Historical Data and Forecast of Qatar Clay Products And Refractories Market Revenues & Volume By Mixing for the Period 2022-2032F
- Historical Data and Forecast of Qatar Clay Products And Refractories Market Revenues & Volume By Shaping for the Period 2022-2032F
- Historical Data and Forecast of Qatar Clay Products And Refractories Market Revenues & Volume By Honing for the Period 2022-2032F
- Historical Data and Forecast of Qatar Clay Products And Refractories Market Revenues & Volume By Material for the Period 2022-2032F
- Historical Data and Forecast of Qatar Clay Products And Refractories Market Revenues & Volume By Quartz for the Period 2022-2032F
- Historical Data and Forecast of Qatar Clay Products And Refractories Market Revenues & Volume By Chamatte for the Period 2022-2032F
- Historical Data and Forecast of Qatar Clay Products And Refractories Market Revenues & Volume By Sand for the Period 2022-2032F
- Historical Data and Forecast of Qatar Clay Products And Refractories Market Revenues & Volume By Sawdust for the Period 2022-2032F
- Historical Data and Forecast of Qatar Clay Products And Refractories Market Revenues & Volume By Slag for the Period 2022-2032F
- Historical Data and Forecast of Qatar Clay Products And Refractories Market Revenues & Volume By Pulverized for the Period 2022-2032F
- Historical Data and Forecast of Qatar Clay Products And Refractories Market Revenues & Volume By Coal for the Period 2022-2032F
- Historical Data and Forecast of Qatar Clay Products And Refractories Market Revenues & Volume By End-User Vertical for the Period 2022-2032F
- Historical Data and Forecast of Qatar Clay Products And Refractories Market Revenues & Volume By Construction for the Period 2022-2032F
- Historical Data and Forecast of Qatar Clay Products And Refractories Market Revenues & Volume By Automobiles for the Period 2022-2032F
- Historical Data and Forecast of Qatar Clay Products And Refractories Market Revenues & Volume By Steel Making for the Period 2022-2032F
- Historical Data and Forecast of Qatar Clay Products And Refractories Market Revenues & Volume By Cosmetics for the Period 2022-2032F
- Historical Data and Forecast of Qatar Clay Products And Refractories Market Revenues & Volume By Food Industry for the Period 2022-2032F
- Historical Data and Forecast of Qatar Clay Products And Refractories Market Revenues & Volume By Others for the Period 2022-2032F
- Qatar Clay Products And Refractories Import Export Trade Statistics
- Market Opportunity Assessment By Type
- Market Opportunity Assessment By Process
- Market Opportunity Assessment By Material
- Market Opportunity Assessment By End-User Vertical
- Qatar Clay Products And Refractories Top Companies Market Share
- Qatar Clay Products And Refractories Competitive Benchmarking By Technical and Operational Parameters
- Qatar Clay Products And Refractories Company Profiles
- Qatar Clay Products And Refractories Key Strategic Recommendations
Frequently Asked Questions About the Market Study (FAQs):
The growth is largely driven by the increasing demand from industries such as construction, steel, and petrochemicals, all of which require high-quality refractory materials for their operations.
The pandemic initially caused disruptions in construction and industrial activities, leading to a temporary decline in demand. However, the market is expected to recover as these sectors gradually resume operations.
The market was estimated at USD 459 Million in 2025 and is projected to reach USD 604 Million by 2032, growing at a CAGR of 4.0% from 2026 to 2032.
Major consumers include the construction sector, metalworking industries, and the petrochemical sector, all of which require reliable and high-performance refractory materials for their operations.
There are numerous opportunities for innovation, particularly in the development of eco-friendly materials and advanced composites that enhance durability and performance in high-temperature applications.
6Wresearch actively monitors the Qatar Clay Products And Refractories Market and publishes its comprehensive annual report, highlighting emerging trends, growth drivers, revenue analysis, and forecast outlook. Our insights help businesses to make data-backed strategic decisions with ongoing market dynamics. Our analysts track relevent industries related to the Qatar Clay Products And Refractories Market, allowing our clients with actionable intelligence and reliable forecasts tailored to emerging regional needs.
Yes, we provide customisation as per your requirements. To learn more, feel free to contact us on sales@6wresearch.com
1 Executive Summary |
2 Introduction |
2.1 Key Highlights of the Report |
2.2 Report Description |
2.3 Market Scope & Segmentation |
2.4 Research Methodology |
2.5 Assumptions |
3 Qatar Clay Products And Refractories Market Overview |
3.1 Qatar Country Macro Economic Indicators |
3.2 Qatar Clay Products And Refractories Market Revenues & Volume, 2022 & 2032F |
3.3 Qatar Clay Products And Refractories Market - Industry Life Cycle |
3.4 Qatar Clay Products And Refractories Market - Porter's Five Forces |
3.5 Qatar Clay Products And Refractories Market Revenues & Volume Share, By Type, 2022 & 2032F |
3.6 Qatar Clay Products And Refractories Market Revenues & Volume Share, By Process , 2022 & 2032F |
3.7 Qatar Clay Products And Refractories Market Revenues & Volume Share, By Material , 2022 & 2032F |
3.8 Qatar Clay Products And Refractories Market Revenues & Volume Share, By End-User Vertical , 2022 & 2032F |
4 Qatar Clay Products And Refractories Market Dynamics |
4.1 Impact Analysis |
4.2 Market Drivers |
4.2.1 Growing construction activities in Qatar leading to increased demand for clay products and refractories |
4.2.2 Rise in infrastructure development projects in the country |
4.2.3 Increasing focus on sustainable and energy-efficient construction materials |
4.3 Market Restraints |
4.3.1 Fluctuating raw material prices impacting production costs |
4.3.2 Intense competition from alternative materials in the construction industry |
4.3.3 Regulatory challenges and environmental concerns affecting production processes |
5 Qatar Clay Products And Refractories Market Trends |
6 Qatar Clay Products And Refractories Market, By Types |
6.1 Qatar Clay Products And Refractories Market, By Type |
6.1.1 Overview and Analysis |
6.1.2 Qatar Clay Products And Refractories Market Revenues & Volume, By Type, 2022-2032F |
6.1.3 Qatar Clay Products And Refractories Market Revenues & Volume, By Pottery, 2022-2032F |
6.1.4 Qatar Clay Products And Refractories Market Revenues & Volume, By Ceramics, 2022-2032F |
6.1.5 Qatar Clay Products And Refractories Market Revenues & Volume, By Plumbing Fixtures, 2022-2032F |
6.1.6 Qatar Clay Products And Refractories Market Revenues & Volume, By Clay Building Material, 2022-2032F |
6.1.7 Qatar Clay Products And Refractories Market Revenues & Volume, By Refractories, 2022-2032F |
6.2 Qatar Clay Products And Refractories Market, By Process |
6.2.1 Overview and Analysis |
6.2.2 Qatar Clay Products And Refractories Market Revenues & Volume, By Grinding , 2022-2032F |
6.2.3 Qatar Clay Products And Refractories Market Revenues & Volume, By Cutting , 2022-2032F |
6.2.4 Qatar Clay Products And Refractories Market Revenues & Volume, By Mixing , 2022-2032F |
6.2.5 Qatar Clay Products And Refractories Market Revenues & Volume, By Shaping, 2022-2032F |
6.2.6 Qatar Clay Products And Refractories Market Revenues & Volume, By Honing, 2022-2032F |
6.3 Qatar Clay Products And Refractories Market, By Material |
6.3.1 Overview and Analysis |
6.3.2 Qatar Clay Products And Refractories Market Revenues & Volume, By Quartz, 2022-2032F |
6.3.3 Qatar Clay Products And Refractories Market Revenues & Volume, By Chamatte, 2022-2032F |
6.3.4 Qatar Clay Products And Refractories Market Revenues & Volume, By Sand, 2022-2032F |
6.3.5 Qatar Clay Products And Refractories Market Revenues & Volume, By Sawdust, 2022-2032F |
6.3.6 Qatar Clay Products And Refractories Market Revenues & Volume, By Slag, 2022-2032F |
6.3.7 Qatar Clay Products And Refractories Market Revenues & Volume, By Pulverized , 2022-2032F |
6.4 Qatar Clay Products And Refractories Market, By End-User Vertical |
6.4.1 Overview and Analysis |
6.4.2 Qatar Clay Products And Refractories Market Revenues & Volume, By Construction , 2022-2032F |
6.4.3 Qatar Clay Products And Refractories Market Revenues & Volume, By Automobiles , 2022-2032F |
6.4.4 Qatar Clay Products And Refractories Market Revenues & Volume, By Steel Making , 2022-2032F |
6.4.5 Qatar Clay Products And Refractories Market Revenues & Volume, By Cosmetics, 2022-2032F |
6.4.6 Qatar Clay Products And Refractories Market Revenues & Volume, By Food Industry, 2022-2032F |
6.4.7 Qatar Clay Products And Refractories Market Revenues & Volume, By Others, 2022-2032F |
7 Qatar Clay Products And Refractories Market Import-Export Trade Statistics |
7.1 Qatar Clay Products And Refractories Market Export to Major Countries |
7.2 Qatar Clay Products And Refractories Market Imports from Major Countries |
8 Qatar Clay Products And Refractories Market Key Performance Indicators |
8.1 Energy efficiency improvements in manufacturing processes |
8.2 Adoption rate of sustainable practices in the production of clay products and refractories |
8.3 Percentage of market share within the construction industry for clay products and refractories |
9 Qatar Clay Products And Refractories Market - Opportunity Assessment |
9.1 Qatar Clay Products And Refractories Market Opportunity Assessment, By Type, 2022 & 2032F |
9.2 Qatar Clay Products And Refractories Market Opportunity Assessment, By Process , 2022 & 2032F |
9.3 Qatar Clay Products And Refractories Market Opportunity Assessment, By Material , 2022 & 2032F |
9.4 Qatar Clay Products And Refractories Market Opportunity Assessment, By End-User Vertical , 2022 & 2032F |
10 Qatar Clay Products And Refractories Market - Competitive Landscape |
10.1 Qatar Clay Products And Refractories Market Revenue Share, By Companies, 2025 |
10.2 Qatar Clay Products And Refractories Market Competitive Benchmarking, By Operating and Technical Parameters |
11 Company Profiles |
12 Recommendations |
13 Disclaimer |
Global Go To Market Strategy - 2030
Export potential enables firms to identify high-growth global markets with greater confidence by combining advanced trade intelligence with a structured quantitative methodology. The framework analyzes emerging demand trends and country-level import patterns while integrating macroeconomic and trade datasets such as GDP and population forecasts, bilateral import–export flows, tariff structures, elasticity differentials between developed and developing economies, geographic distance, and import demand projections. Using weighted trade values from 2020–2024 as the base period to project country-to-country export potential for 2030, these inputs are operationalized through calculated drivers such as gravity model parameters, tariff impact factors, and projected GDP per-capita growth. Through an analysis of hidden potentials, demand hotspots, and market conditions that are most favorable to success, this method enables firms to focus on target countries, maximize returns, and global expansion with data, backed by accuracy.
By factoring in the projected importer demand gap that is currently unmet and could be potential opportunity, it identifies the potential for the Exporter (Country) among 190 countries, against the general trade analysis, which identifies the biggest importer or exporter.
To discover high-growth global markets and optimize your business strategy:
Click Here
Pricing
- Single User License$ 1,995
- Department License$ 2,400
- Site License$ 3,120
- Global License$ 3,795

Leadership Perspectives from Industry Events
Search
Thought Leadership and Analyst Meet


Our Clients
6WResearch In News
- India Air Conditioner Market Set for Strong Rebound in 2026 After Weather-Led Correction and GST-Driven Recovery: 6Wresearch
- ADAS in India: How Automatic Emergency Braking, Blind Spot Detection & Driver Monitoring are Transforming Road Safety
- Doha a strategic location for EV manufacturing hub: IPA Qatar
- Demand for luxury TVs surging in the GCC, says Samsung
- Empowering Growth: The Thriving Journey of Bangladesh’s Cable Industry
- Demand for luxury TVs surging in the GCC, says Samsung
Latest Reports
- Nicaragua RPG Gaming Market (2026-2032)
- New Zealand RPG Gaming Market (2026-2032)
- Netherlands RPG Gaming Market (2026-2032)
- Nauru RPG Gaming Market (2026-2032)
- Namibia RPG Gaming Market (2026-2032)
- Mozambique RPG Gaming Market (2026-2032)
- Montenegro RPG Gaming Market (2026-2032)
- Mongolia RPG Gaming Market (2026-2032)
- Monaco RPG Gaming Market (2026-2032)
- Micronesia RPG Gaming Market (2026-2032)
Industry Events and Analyst Meet

EV India Expo 2026

HIMTEX 2026

India Refining Summit 2026

India EV Show 2026

EV tech India Expo 2026
Whitepaper
- Middle East & Africa Commercial Security Market Click here to view more.
- Middle East & Africa Fire Safety Systems & Equipment Market Click here to view more.
- GCC Drone Market Click here to view more.
- Middle East Lighting Fixture Market Click here to view more.
- GCC Physical & Perimeter Security Market Click here to view more.