Qatar Halogenated Solvents Market (2026-2032) Outlook | Analysis, Revenue, Forecast, Industry, Size, Trends, Share, Value, Growth & Companies
Market Forecast By Product (Methylene Chloride, Perchloroethylene, Trichloroethylene), By End-use (Paint & Coatings, Printing Inks, Cosmetics & Toiletries, Other) And Competitive Landscape
| Product Code: ETC417157 | Publication Date: Oct 2022 | Updated Date: Jul 2026 | Product Type: Market Research Report | |
| Publisher: 6Wresearch | Author: Ravi Bhandari | No. of Pages: 75 | No. of Figures: 35 | No. of Tables: 20 |
Qatar Halogenated Solvents Market Size, Share & Growth Rate
The Qatar Halogenated Solvents Market was estimated at USD 203 Million in 2025 and is projected to reach USD 265 Million by 2032, growing at a CAGR of 3.9% from 2026 to 2032. This anticipated growth trajectory is primarily driven by the escalating demand from the robust pharmaceutical and chemical sectors, which are increasingly reliant on halogenated solvents for essential processes. Furthermore, Qatars advantageous position in the global petrochemical industry is likely to bolster the market, as local manufacturers seek to enhance their operational capabilities.
Qatar Halogenated Solvents Market Year-wise Growth Rate and Key Drivers
This graph highlights how the Qatar Halogenated Solvents Market has steadily grown over the years, supported by major growth factors.
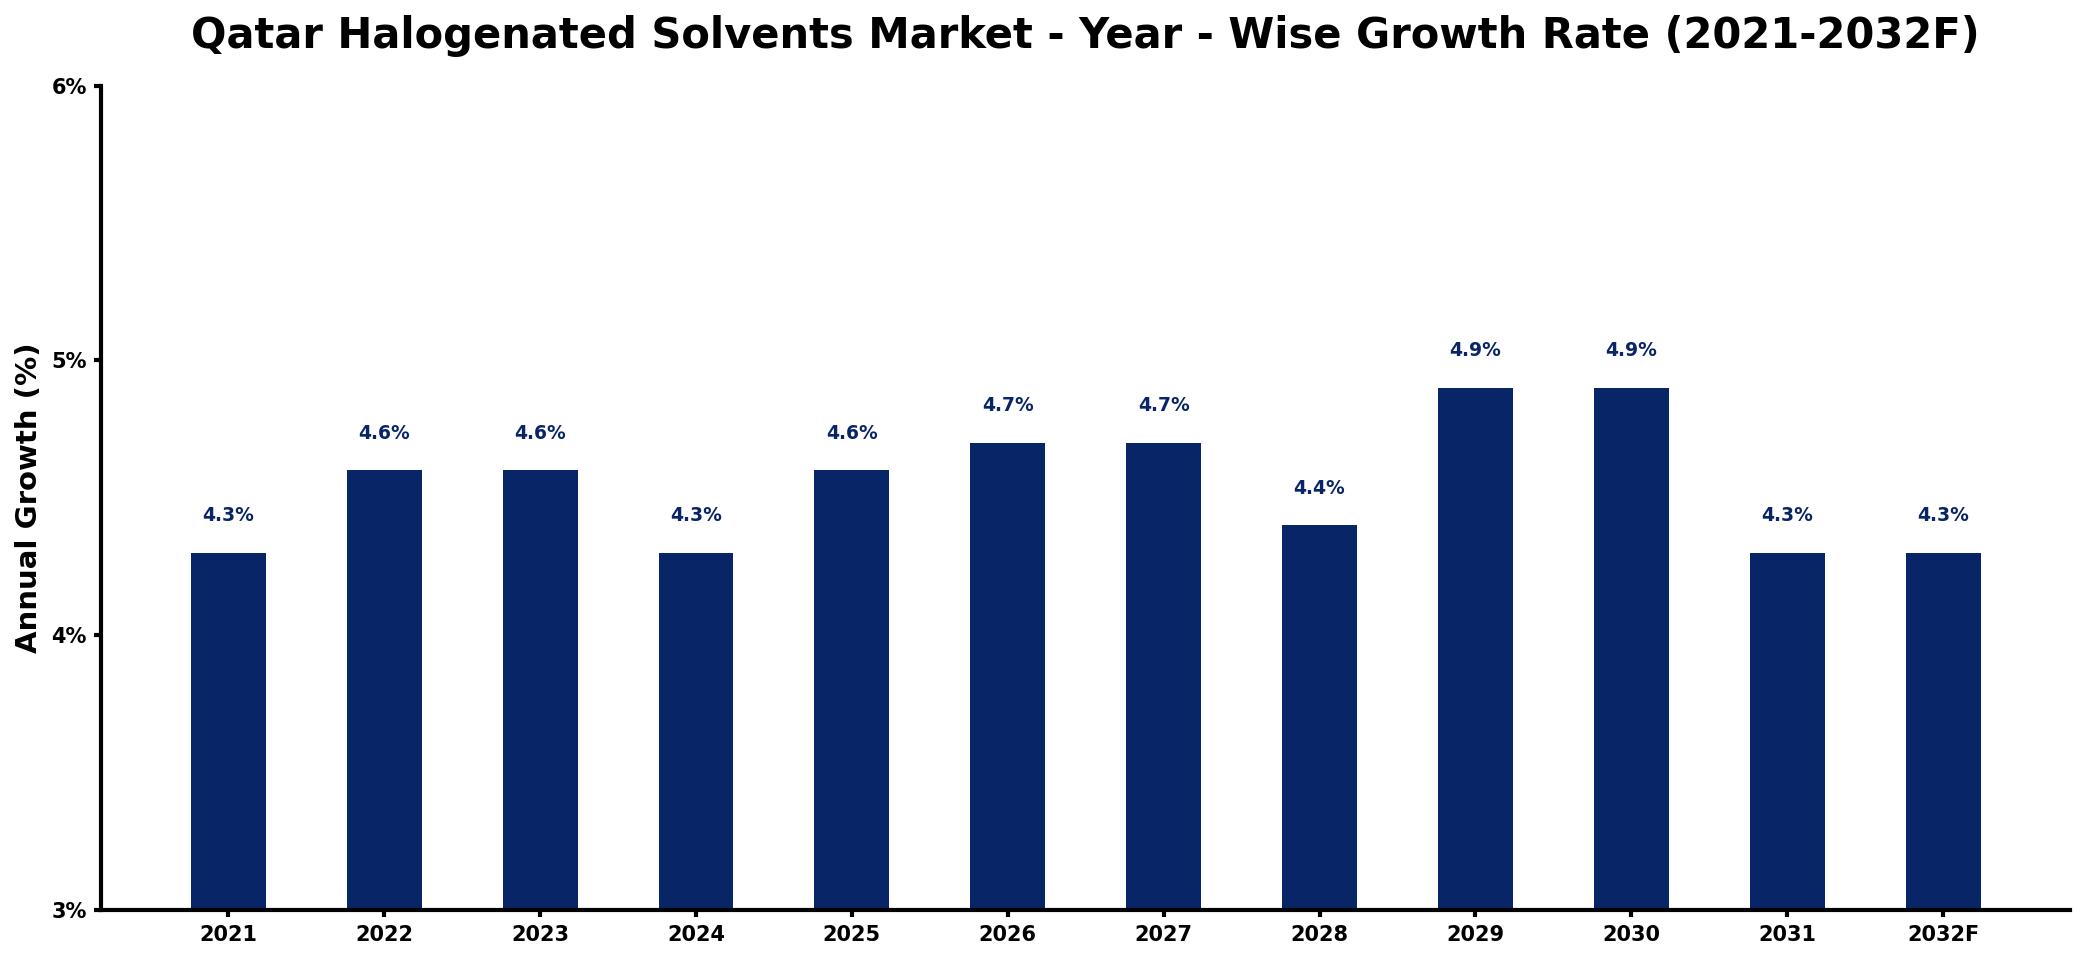
The table below presents the year‑wise growth rates along with the key drivers influencing the market
| Year | Growth Rate | Major Drivers |
| 2021 | 4.3% | Increased industrial manufacturing activities |
| 2022 | 4.6% | Rising demand from construction sector |
| 2023 | 4.6% | Growth in automotive production rates |
| 2024 | 4.3% | Expansion of chemical processing facilities |
| 2025 | 4.6% | Surge in healthcare product manufacturing |
| 2026 | 4.7% | Investments in renewable energy projects |
| 2027 | 4.7% | Technological advancements in production |
| 2028 | 4.4% | Rising consumer electronics demand |
| 2029 | 4.9% | expanding manufacturing base activity |
| 2030 | 4.9% | Increased focus on environmental compliance |
| 2031 | 4.3% | Expanding research and development initiatives |
| 2032 | 4.3% | Higher demand for specialty applications |
Note: Market size estimations and growth projections presented in this report are based on 6Wresearch's proprietary forecasting methodology, utilizing the latest available industry data, government publications, and primary research inputs.
Qatar Halogenated Solvents Market Synopsis
A pivotal force shaping the Qatar Halogenated Solvents Market is the country's burgeoning industrial sector, which is experiencing a resurgence as global markets stabilize post-pandemic. As businesses return to full operational capacity, the demand for halogenated solvents is set to rise, supported by their essential applications in various processes, including cleaning and degreasing.
Moreover, the focus on sustainable practices cannot be overlooked. As awareness of environmental concerns intensifies, there is an increasing push toward alternative, eco-friendly solvents. This shift presents both challenges and opportunities for market participants, as they navigate the balance between regulatory compliance and maintaining product efficacy.
Qatar Halogenated Solvents Market Key Takeaways
- The market is projected to grow from USD 203 Million in 2025 to USD 265 Million by 2032.
- Key drivers include a robust petrochemical industry and increasing demand in pharmaceuticals.
- Environmental regulations are pushing innovation toward sustainable solvent solutions.
- Market players must address challenges in sourcing high-quality raw materials.
- Competitive pressure from non-halogenated alternatives necessitates ongoing product development.
Evaluation of Restraints in Qatar Halogenated Solvents Market
The Qatar Halogenated Solvents Market faces significant restraints, primarily due to environmental concerns surrounding the use of halogenated compounds. Growing public awareness and regulatory scrutiny pose serious challenges for market players, necessitating shifts toward more sustainable practices. Additionally, the reliance on imported raw materials creates vulnerabilities in supply chains, impacting production consistency. This situation compels businesses to continuously innovate while adhering to both local and international standards, thus straining operational capacities.
Qatar Halogenated Solvents Market Trends
Current trends in the Qatar Halogenated Solvents Market reflect a shift towards increased regulatory compliance and sustainability. Companies are actively exploring alternative formulations that meet environmental standards without compromising performance. Furthermore, there is a growing integration of advanced technologies to enhance efficiency in solvent applications, including the adoption of green chemistry principles. This trend not only aligns with global sustainability goals but also resonates with local market demands.
Qatar Halogenated Solvents Market Opportunities
Opportunities in the Qatar Halogenated Solvents Market are ripe for exploration, particularly in the development of eco-friendly solvent alternatives. With rising industrial activity, there is a need for innovative solutions that align with environmental regulations. Additionally, the expansion of the pharmaceuticals and electronics sectors offers promising avenues for market growth. Stakeholders should also consider partnerships and collaborations to leverage local expertise and resources, ensuring a competitive edge in this evolving landscape.
Government Initiatives in the Qatar Halogenated Solvents Market
The Qatari government is actively promoting initiatives aimed at enhancing the industrial sectors sustainability through stringent environmental policies and regulations. Public spending on green technologies and eco-friendly practices is increasing, providing a favorable environment for innovation. Moreover, government programs that encourage research and development in the chemical sector are likely to spur advancements in halogenated solvent applications, ultimately benefiting local manufacturers and the market as a whole.
Future Insights of the Qatar Halogenated Solvents Market
Looking ahead to the period from 2026 to 2032, the Qatar Halogenated Solvents Market is expected to undergo significant transformation. As regulations around environmental impact continue to tighten, the market will likely shift towards more sustainable practices. Innovations in formulation will emerge, providing new solutions that not only meet industry demands but also align with global sustainability efforts. Furthermore, as the industrial landscape evolves, the demand for halogenated solvents will expand, driven by their critical roles in chemical processes.
Qatar Halogenated Solvents Market Latest Developments (2025 - 2026)
Recent developments in the Qatar Halogenated Solvents Market indicate a strengthening focus on sustainable alternatives and enhanced regulatory compliance. Companies are prioritizing research into innovative formulations that align with both domestic and international environmental standards. Collaboration between industry players and governmental bodies is fostering a conducive environment for development, while ongoing advancements in production technologies are enhancing overall efficiency in solvent applications.
Qatar Halogenated Solvents Market - Key Attractiveness of the Report
- 10 Years of Market Numbers
- Historical Data Starting from 2022 to 2025
- Base Year: 2025
- Forecast Data until 2032
- Key Performance Indicators Impacting the Market
- Major Upcoming Developments and Projects
Key Highlights of the Report:
- Qatar Halogenated Solvents Market Outlook
- Market Size of Qatar Halogenated Solvents Market, 2025
- Forecast of Qatar Halogenated Solvents Market, 2032
- Historical Data and Forecast of Qatar Halogenated Solvents Revenues & Volume for the Period 2022-2032F
- Qatar Halogenated Solvents Market Trend Evolution
- Qatar Halogenated Solvents Market Drivers and Challenges
- Qatar Halogenated Solvents Price Trends
- Qatar Halogenated Solvents Porter's Five Forces
- Qatar Halogenated Solvents Industry Life Cycle
- Historical Data and Forecast of Qatar Halogenated Solvents Market Revenues & Volume By Product for the Period 2022-2032F
- Historical Data and Forecast of Qatar Halogenated Solvents Market Revenues & Volume By Methylene Chloride for the Period 2022-2032F
- Historical Data and Forecast of Qatar Halogenated Solvents Market Revenues & Volume By Perchloroethylene for the Period 2022-2032F
- Historical Data and Forecast of Qatar Halogenated Solvents Market Revenues & Volume By Trichloroethylene for the Period 2022-2032F
- Historical Data and Forecast of Qatar Halogenated Solvents Market Revenues & Volume By End-use for the Period 2022-2032F
- Historical Data and Forecast of Qatar Halogenated Solvents Market Revenues & Volume By Paint & Coatings for the Period 2022-2032F
- Historical Data and Forecast of Qatar Halogenated Solvents Market Revenues & Volume By Printing Inks for the Period 2022-2032F
- Historical Data and Forecast of Qatar Halogenated Solvents Market Revenues & Volume By Cosmetics & Toiletries for the Period 2022-2032F
- Historical Data and Forecast of Qatar Halogenated Solvents Market Revenues & Volume By Other for the Period 2022-2032F
- Qatar Halogenated Solvents Import Export Trade Statistics
- Market Opportunity Assessment By Product
- Market Opportunity Assessment By End-use
- Qatar Halogenated Solvents Top Companies Market Share
- Qatar Halogenated Solvents Competitive Benchmarking By Technical and Operational Parameters
- Qatar Halogenated Solvents Company Profiles
- Qatar Halogenated Solvents Key Strategic Recommendations
Frequently Asked Questions About the Market Study (FAQs):
The Qatar Halogenated Solvents Market was estimated at USD 203 Million in 2025 and is projected to reach USD 265 Million by 2032, growing at a CAGR of 3.9% from 2026 to 2032.
Environmental regulations are driving a significant shift towards more sustainable practices in the Qatar Halogenated Solvents Market. Companies are under pressure to innovate and provide alternatives that reduce environmental impact while ensuring efficacy.
The largest consumers of halogenated solvents in Qatar include the pharmaceuticals, chemicals, and electronics sectors, all of which rely heavily on these solvents for various applications.
Manufacturers face challenges in securing a stable supply of high-quality raw materials, as Qatar relies on imports. This dependence can lead to fluctuations in production capabilities and costs.
Key trends include a focus on sustainability and regulatory compliance, with companies investing in alternative formulations and advanced production technologies to enhance efficiency and reduce environmental impact.
6Wresearch actively monitors the Qatar Halogenated Solvents Market and publishes its comprehensive annual report, highlighting emerging trends, growth drivers, revenue analysis, and forecast outlook. Our insights help businesses to make data-backed strategic decisions with ongoing market dynamics. Our analysts track relevent industries related to the Qatar Halogenated Solvents Market, allowing our clients with actionable intelligence and reliable forecasts tailored to emerging regional needs.
Yes, we provide customisation as per your requirements. To learn more, feel free to contact us on sales@6wresearch.com
1 Executive Summary |
2 Introduction |
2.1 Key Highlights of the Report |
2.2 Report Description |
2.3 Market Scope & Segmentation |
2.4 Research Methodology |
2.5 Assumptions |
3 Qatar Halogenated Solvents Market Overview |
3.1 Qatar Country Macro Economic Indicators |
3.2 Qatar Halogenated Solvents Market Revenues & Volume, 2022 & 2032F |
3.3 Qatar Halogenated Solvents Market - Industry Life Cycle |
3.4 Qatar Halogenated Solvents Market - Porter's Five Forces |
3.5 Qatar Halogenated Solvents Market Revenues & Volume Share, By Product, 2022 & 2032F |
3.6 Qatar Halogenated Solvents Market Revenues & Volume Share, By End-use, 2022 & 2032F |
4 Qatar Halogenated Solvents Market Dynamics |
4.1 Impact Analysis |
4.2 Market Drivers |
4.2.1 Increasing demand for halogenated solvents in various industries in Qatar |
4.2.2 Growing use of halogenated solvents in cleaning and degreasing applications |
4.2.3 Favorable government regulations supporting the use of halogenated solvents |
4.3 Market Restraints |
4.3.1 Environmental concerns regarding the use and disposal of halogenated solvents |
4.3.2 Volatility in raw material prices affecting the cost of production |
5 Qatar Halogenated Solvents Market Trends |
6 Qatar Halogenated Solvents Market, By Types |
6.1 Qatar Halogenated Solvents Market, By Product |
6.1.1 Overview and Analysis |
6.1.2 Qatar Halogenated Solvents Market Revenues & Volume, By Product, 2022-2032F |
6.1.3 Qatar Halogenated Solvents Market Revenues & Volume, By Methylene Chloride, 2022-2032F |
6.1.4 Qatar Halogenated Solvents Market Revenues & Volume, By Perchloroethylene, 2022-2032F |
6.1.5 Qatar Halogenated Solvents Market Revenues & Volume, By Trichloroethylene, 2022-2032F |
6.2 Qatar Halogenated Solvents Market, By End-use |
6.2.1 Overview and Analysis |
6.2.2 Qatar Halogenated Solvents Market Revenues & Volume, By Paint & Coatings, 2022-2032F |
6.2.3 Qatar Halogenated Solvents Market Revenues & Volume, By Printing Inks, 2022-2032F |
6.2.4 Qatar Halogenated Solvents Market Revenues & Volume, By Cosmetics & Toiletries, 2022-2032F |
6.2.5 Qatar Halogenated Solvents Market Revenues & Volume, By Other, 2022-2032F |
7 Qatar Halogenated Solvents Market Import-Export Trade Statistics |
7.1 Qatar Halogenated Solvents Market Export to Major Countries |
7.2 Qatar Halogenated Solvents Market Imports from Major Countries |
8 Qatar Halogenated Solvents Market Key Performance Indicators |
8.1 Adoption rate of halogenated solvents in key industries in Qatar |
8.2 Investments in research and development for the innovation of halogenated solvents |
8.3 Compliance with environmental regulations regarding the use of halogenated solvents |
9 Qatar Halogenated Solvents Market - Opportunity Assessment |
9.1 Qatar Halogenated Solvents Market Opportunity Assessment, By Product, 2022 & 2032F |
9.2 Qatar Halogenated Solvents Market Opportunity Assessment, By End-use, 2022 & 2032F |
10 Qatar Halogenated Solvents Market - Competitive Landscape |
10.1 Qatar Halogenated Solvents Market Revenue Share, By Companies, 2025 |
10.2 Qatar Halogenated Solvents Market Competitive Benchmarking, By Operating and Technical Parameters |
11 Company Profiles |
12 Recommendations |
13 Disclaimer |
Global Go To Market Strategy - 2030
Export potential enables firms to identify high-growth global markets with greater confidence by combining advanced trade intelligence with a structured quantitative methodology. The framework analyzes emerging demand trends and country-level import patterns while integrating macroeconomic and trade datasets such as GDP and population forecasts, bilateral import–export flows, tariff structures, elasticity differentials between developed and developing economies, geographic distance, and import demand projections. Using weighted trade values from 2020–2024 as the base period to project country-to-country export potential for 2030, these inputs are operationalized through calculated drivers such as gravity model parameters, tariff impact factors, and projected GDP per-capita growth. Through an analysis of hidden potentials, demand hotspots, and market conditions that are most favorable to success, this method enables firms to focus on target countries, maximize returns, and global expansion with data, backed by accuracy.
By factoring in the projected importer demand gap that is currently unmet and could be potential opportunity, it identifies the potential for the Exporter (Country) among 190 countries, against the general trade analysis, which identifies the biggest importer or exporter.
To discover high-growth global markets and optimize your business strategy:
Click Here
Pricing
- Single User License$ 1,995
- Department License$ 2,400
- Site License$ 3,120
- Global License$ 3,795

Leadership Perspectives from Industry Events
Search
Thought Leadership and Analyst Meet


Our Clients
6WResearch In News
- India Air Conditioner Market Set for Strong Rebound in 2026 After Weather-Led Correction and GST-Driven Recovery: 6Wresearch
- ADAS in India: How Automatic Emergency Braking, Blind Spot Detection & Driver Monitoring are Transforming Road Safety
- Doha a strategic location for EV manufacturing hub: IPA Qatar
- Demand for luxury TVs surging in the GCC, says Samsung
- Empowering Growth: The Thriving Journey of Bangladesh’s Cable Industry
- Demand for luxury TVs surging in the GCC, says Samsung
Latest Reports
- Nicaragua RPG Gaming Market (2026-2032)
- New Zealand RPG Gaming Market (2026-2032)
- Netherlands RPG Gaming Market (2026-2032)
- Nauru RPG Gaming Market (2026-2032)
- Namibia RPG Gaming Market (2026-2032)
- Mozambique RPG Gaming Market (2026-2032)
- Montenegro RPG Gaming Market (2026-2032)
- Mongolia RPG Gaming Market (2026-2032)
- Monaco RPG Gaming Market (2026-2032)
- Micronesia RPG Gaming Market (2026-2032)
Industry Events and Analyst Meet

EV India Expo 2026

HIMTEX 2026

India Refining Summit 2026

India EV Show 2026

EV tech India Expo 2026
Whitepaper
- Middle East & Africa Commercial Security Market Click here to view more.
- Middle East & Africa Fire Safety Systems & Equipment Market Click here to view more.
- GCC Drone Market Click here to view more.
- Middle East Lighting Fixture Market Click here to view more.
- GCC Physical & Perimeter Security Market Click here to view more.