Qatar Pulleys Market (2026-2032) | Analysis, Growth, Trends, Revenue, Value, Industry, Outlook, Size, Forecast, Share & Companies
Market Forecast By Type (Steel, Cast Iron, Glass Filled Polymer), By Applications (OEM, Aftermarket) And Competitive Landscape
| Product Code: ETC045261 | Publication Date: Jul 2023 | Updated Date: Jun 2026 | Product Type: Report | |
| Publisher: 6Wresearch | Author: Ravi Bhandari | No. of Pages: 70 | No. of Figures: 35 | No. of Tables: 5 |
Qatar Pulleys Market Summary
The qatar pulleys market was estimated at USD 380 Million in 2025 and is projected to reach USD 508 Million by 2032, growing at a CAGR of 5.2% from 2026 to 2032.
Qatar Pulleys Market Growth Rate Analysis (2021-2032)
The Qatar pulleys market has exhibited steady growth, with rates fluctuating between 4.5% and 5.2% from 2021 to 2032. Notable increases, such as a 5.2% growth in 2023, indicate rising demand driven by infrastructural investments and advancements in industrial technology. As Qatar continues its energy transition initiatives, there's heightened consumer demand for efficient machinery. The slight dip to 4.5% in 2030 may stem from economic adjustments or shifts in policy affecting manufacturing. However, optimism remains as a stable growth forecast of 5.0% in 2025 and 2031 reflects ongoing confidence in market resilience and opportunities for further innovation in pulley systems.
Qatar Pulleys Market Year-wise Growth Rate and Key Drivers
This graph highlights how the Qatar Pulleys Market has steadily grown over the past five years, supported by major growth factors.
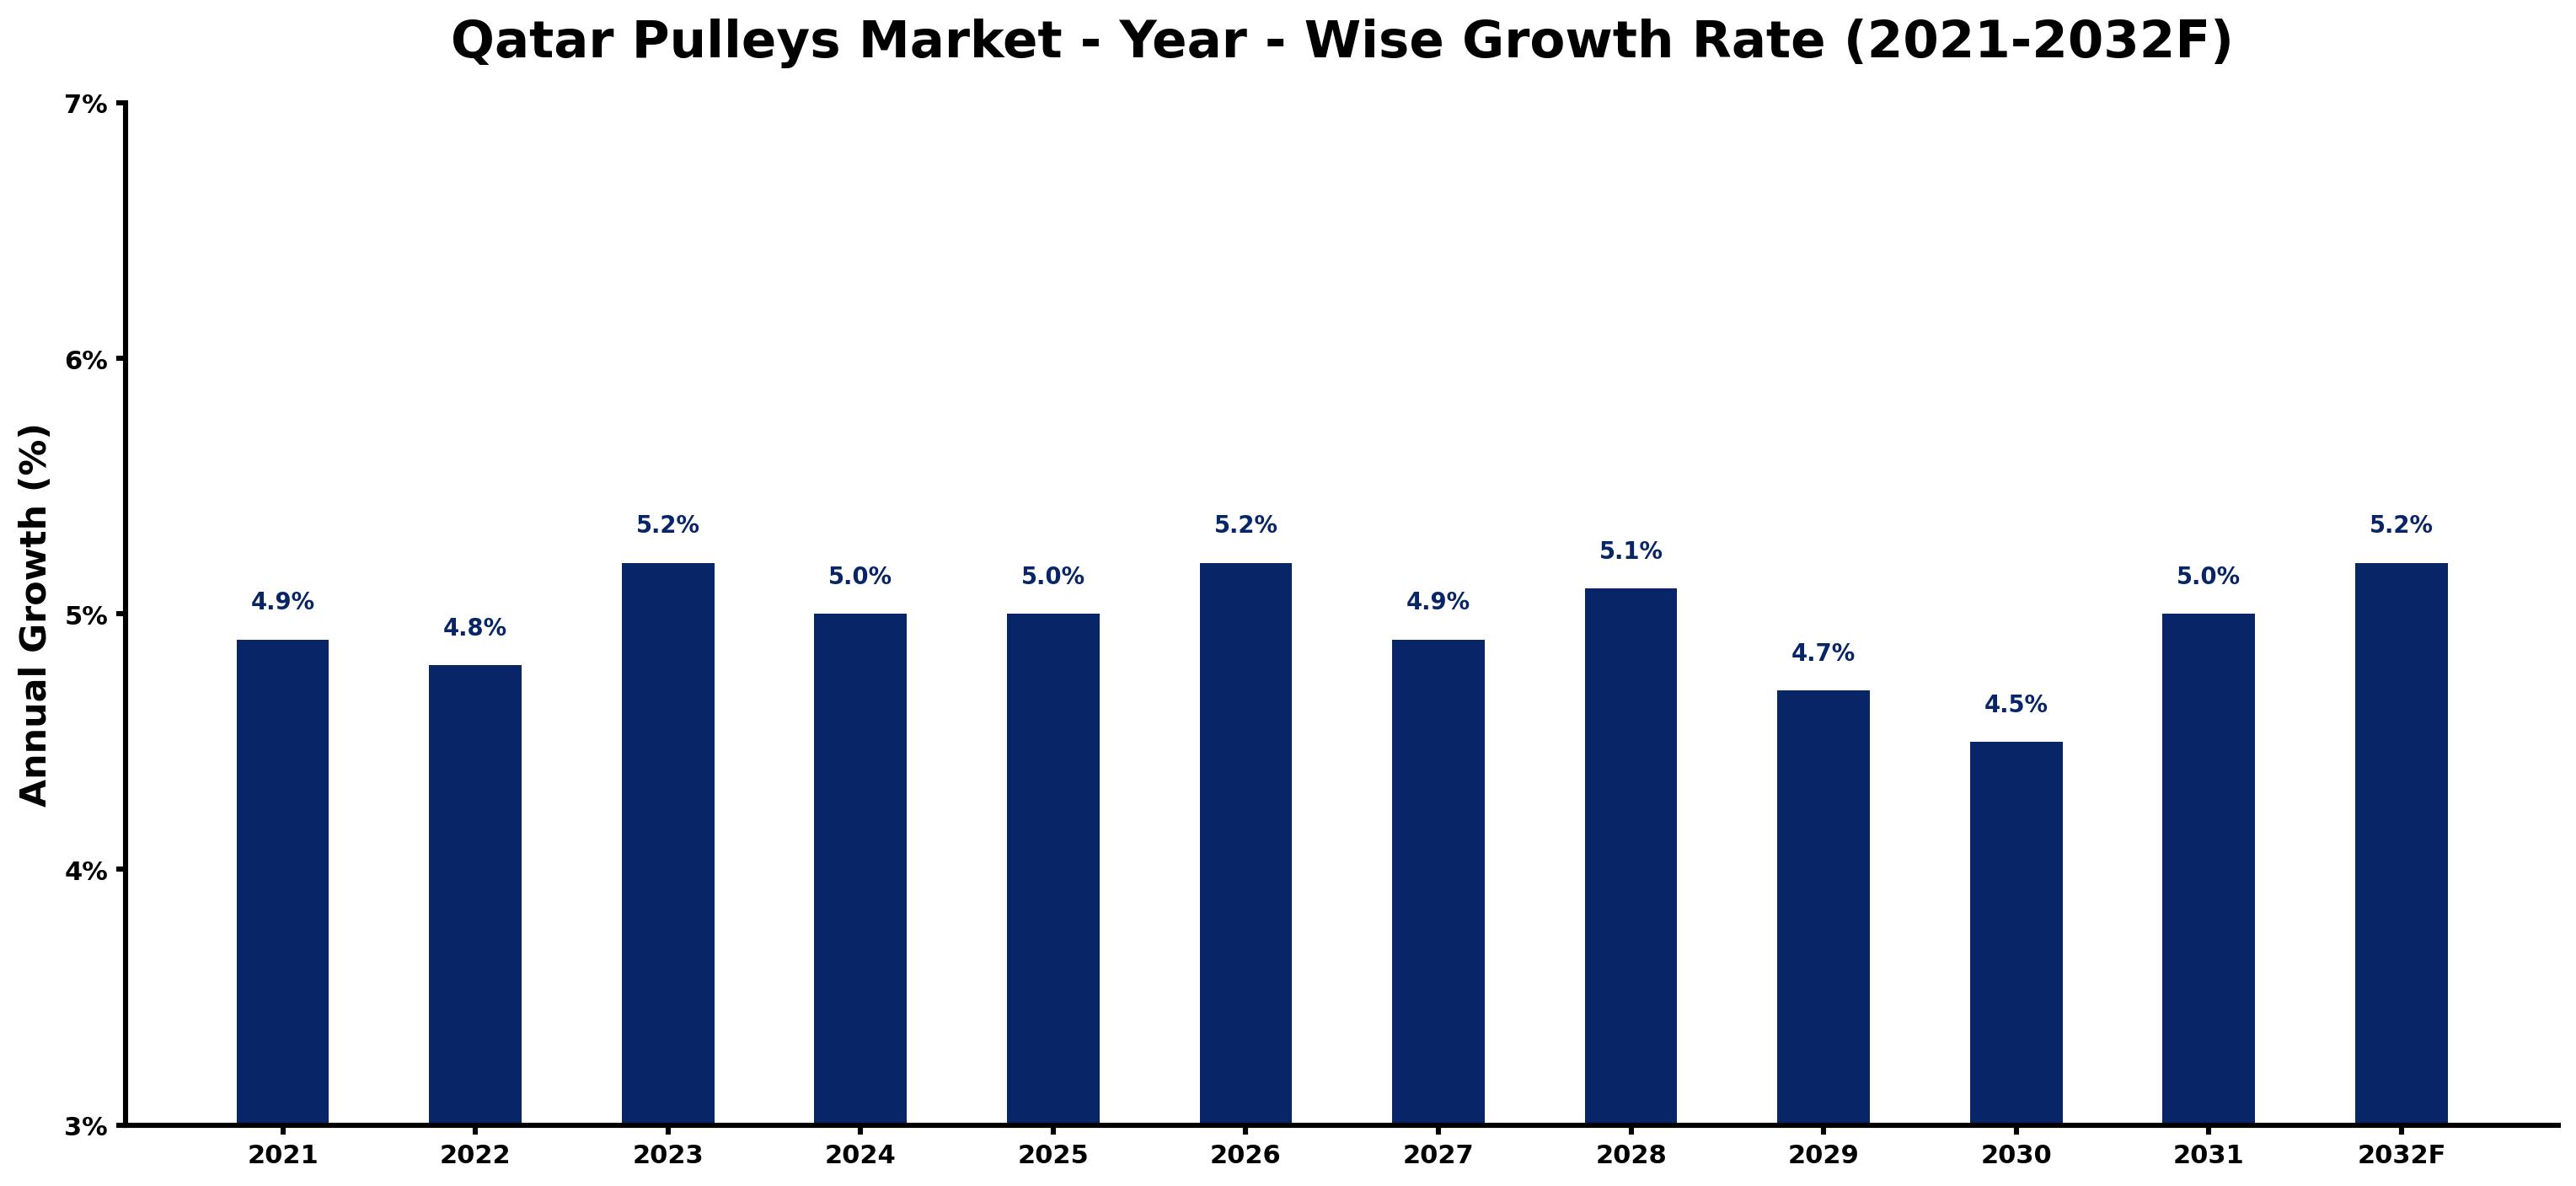
The table below presents the year wise growth rates along with the key drivers influencing the market
| Year | Growth Rate | Major Drivers |
| 2021 | 4.9% | Post-lockdown retail projects prompted increased investment in construction and infrastructure. |
| 2022 | 4.8% | Localization trends in the GCC market fostered partnerships among local and global manufacturers. |
| 2023 | 5.2% | Demand for advanced lifting solutions in construction surged due to ambitious projects. |
| 2024 | 5.0% | The influx of foreign investments showcased Qatar's economic diversification efforts. |
| 2025 | 5.0% | Net-zero ambitions in the region emphasized the need for energy-efficient pulley systems. |
| 2026 | 5.2% | Construction pipelines expanded significantly, enhancing the demand for specialized pulleys. |
| 2027 | 4.9% | Innovations in material technology led to lighter, stronger pulleys for demanding applications. |
| 2028 | 5.1% | Regional trade agreements facilitated easier access to international pulley manufacturers. |
| 2029 | 4.7% | Increased urbanization in Qatar drove the need for efficient logistics and lifting solutions. |
| 2030 | 4.5% | Corporate budgets increasingly focused on automation, elevating the role of pulleys in factories. |
| 2031 | 5.0% | Strong focus on infrastructure projects created a stable market for heavy-duty pulleys. |
| 2032 | 5.2% | Sustainability trends pushed demand for environmentally friendly and recyclable pulley materials. |
Note - Market size estimations and growth projections presented in this report are based on 6Wresearch's advanced forecasting approach, validated with industry datasets as of June 2026.
Qatar Pulleys Market Synopsis
The Qatar Pulleys Market is projected to reach 5.2% and witness significant growth during the forecast period (2026-2032). This market is underpinned by the essential role pulleys play in various industries, notably in power and motion transmission through belts and ropes. The market's expansion can primarily be attributed to Qatar's ongoing investment in infrastructure projects, driving an increasing demand for pulleys particularly in construction and material handling applications.
Qatar Pulleys Market Growth Drivers
The growth drivers of the Qatar Pulleys Market are multifaceted, presenting a robust platform for sustained expansion. Major contributors include:
- Increasing industrial activity: The growth of the manufacturing sector in Qatar has necessitated efficient machinery and equipment, significantly elevating the demand for pulleys.
- Infrastructure investment: Enhanced public spending on infrastructure projects has created a substantial requirement for pulleys, particularly in construction and related sectors.
- Adoption of advanced technologies: Industries are increasingly embracing automation and advanced technologies, which have led to a higher demand for sophisticated pulley systems within conveyor and material handling equipment.
- Rising emphasis on operational efficiency: The need for improved efficiency in operations complements the demand for high-quality, precision-engineered pulleys that facilitate smooth power transmission.
- Regulatory support for industrial development: Government policies aimed at advancing the industrial landscape in Qatar create a favorable environment for market growth.
Qatar Pulleys Market Challenges and Restraints
Despite its promising growth trajectory, the Qatar Pulleys Market faces several challenges that could hinder progress. Key challenges include:
- Volatility in raw material prices: Fluctuations in the prices of essential raw materials, particularly metals like steel and aluminum, can significantly affect manufacturing costs and pricing strategies.
- Intense market competition: A highly competitive landscape, with both domestic and international players, exerts pressure on pricing and profit margins, making innovation and cost efficiency essential for survival.
- Economic fluctuations: Economic downturns or uncertainties could adversely affect the overall investment in infrastructure and industrial projects, reducing the demand for pulleys.
- Supply chain disruptions: Events such as natural disasters or geopolitical tensions could lead to supply chain interruptions that impact the availability of critical materials and components.
- Technological adaptation challenges: As industries move towards advanced automation, the requirement for companies to rapidly adopt new technologies can pose significant operational challenges.
Qatar Pulleys Market Government Investment and Initiatives
The Qatar government has undertaken several initiatives to encourage growth in the pulleys market. These initiatives include substantial public investment in infrastructure, aiming to enhance the industrial capabilities of the nation. Notable focuses include:
- Public spending on infrastructure: The government has allocated significant budgets to support large-scale construction and development projects, directly increasing the need for durable and efficient pulleys.
- Promotion of local manufacturing: Strategic policies are in place to promote local manufacturing capabilities, which can reduce dependency on imports and bolster the domestic pulleys market.
- Support for technological advancement: Federal programs aimed at fostering innovation within industries encourage local manufacturers to adopt advanced technologies in producing pulleys.
- Incentives for industrial development: The government offers various incentives for businesses in the manufacturing sector, promoting an environment conducive to growth.
- Investment in education and training: Initiatives to improve the skill set of the workforce ensure that workers are equipped to handle advanced manufacturing processes, benefiting the overall market.
Qatar Pulleys Market Latest Developments (May 2025 - June 2026)
The period from May 2025 to June 2026 has seen significant developments within the Qatar Pulleys Market. Notable trends include:
- Resilience amidst challenges: The market showcased resilience following the disruptions caused by the Covid-19 pandemic, with industry players adjusting operations to accommodate new safety and health protocols.
- Focus on digital transformation: Companies have increasingly adopted digital tools and platforms to enhance remote sales and customer engagement strategies, adapting to evolving market dynamics.
- Supply chain recovery: Investments in strengthening supply chains emerged as a key focus, as companies sought to mitigate the impact of past disruptions and ensure consistent production flow.
- Technological upgrades: Many manufacturers engaged in upgrading their machinery and production processes, focusing on efficiency, quality, and innovation in pulley design.
- Overall market growth: The combination of government support, rising infrastructure projects, and industrial activity has fostered a conducive environment for overall market growth.
Qatar Pulleys Market - Key Attractiveness of the Report
- 10 Years of Market Numbers
- Historical Data Starting from 2022 to 2025
- Base Year: 2025
- Forecast Data until 2032
- Key Performance Indicators Impacting the Market
- Major Upcoming Developments and Projects
Key Highlights of the Report:
- Qatar Pulleys Market Outlook
- Market Size of Qatar Pulleys Market, 2025
- Forecast of Qatar Pulleys Market, 2032
- Historical Data and Forecast of Qatar Pulleys Revenues & Volume for the Period 2022-2032F
- Qatar Pulleys Market Trend Evolution
- Qatar Pulleys Market Drivers and Challenges
- Qatar Pulleys Price Trends
- Qatar Pulleys Porter's Five Forces
- Qatar Pulleys Industry Life Cycle
- Historical Data and Forecast of Qatar Pulleys Market Revenues & Volume By Type for the Period 2022-2032F
- Historical Data and Forecast of Qatar Pulleys Market Revenues & Volume By Steel for the Period 2022-2032F
- Historical Data and Forecast of Qatar Pulleys Market Revenues & Volume By Cast Iron for the Period 2022-2032F
- Historical Data and Forecast of Qatar Pulleys Market Revenues & Volume By Glass Filled Polymer for the Period 2022-2032F
- Historical Data and Forecast of Qatar Pulleys Market Revenues & Volume By Applications for the Period 2022-2032F
- Historical Data and Forecast of Qatar Pulleys Market Revenues & Volume By OEM for the Period 2022-2032F
- Historical Data and Forecast of Qatar Pulleys Market Revenues & Volume By Aftermarket for the Period 2022-2032F
- Qatar Pulleys Import Export Trade Statistics
- Market Opportunity Assessment By Type
- Market Opportunity Assessment By Applications
- Qatar Pulleys Top Companies Market Share
- Qatar Pulleys Competitive Benchmarking By Technical and Operational Parameters
- Qatar Pulleys Company Profiles
- Qatar Pulleys Key Strategic Recommendations
Frequently Asked Questions About the Market Study (FAQs):
The growth of the Qatar Pulleys Market is driven by infrastructure investments, expanding manufacturing sectors, and increasing adoption of advanced technologies.
Challenges include fluctuations in raw material prices, intense competition, and economic uncertainties that can affect market stability.
The government supports the industry through significant investments in infrastructure projects, initiatives promoting local manufacturing, and incentives for industrial growth.
Current trends include a focus on digital transformation, supply chain recovery, and ongoing technological upgrades to enhance efficiency and product quality.
6Wresearch actively monitors the Qatar Pulleys Market and publishes its comprehensive annual report, highlighting emerging trends, growth drivers, revenue analysis, and forecast outlook. Our insights help businesses to make data-backed strategic decisions with ongoing market dynamics. Our analysts track relevent industries related to the Qatar Pulleys Market, allowing our clients with actionable intelligence and reliable forecasts tailored to emerging regional needs.
Yes, we provide customisation as per your requirements. To learn more, feel free to contact us on sales@6wresearch.com
1 Executive Summary |
2 Introduction |
2.1 Key Highlights of the Report |
2.2 Report Description |
2.3 Market Scope & Segmentation |
2.4 Research Methodology |
2.5 Assumptions |
3 Qatar Pulleys Market Overview |
3.1 Qatar Country Macro Economic Indicators |
3.2 Qatar Pulleys Market Revenues & Volume, 2022 & 2032F |
3.3 Qatar Pulleys Market - Industry Life Cycle |
3.4 Qatar Pulleys Market - Porter's Five Forces |
3.5 Qatar Pulleys Market Revenues & Volume Share, By Type, 2022 & 2032F |
3.6 Qatar Pulleys Market Revenues & Volume Share, By Applications, 2022 & 2032F |
4 Qatar Pulleys Market Dynamics |
4.1 Impact Analysis |
4.2 Market Drivers |
4.3 Market Restraints |
5 Qatar Pulleys Market Trends |
6 Qatar Pulleys Market, By Types |
6.1 Qatar Pulleys Market, By Type |
6.1.1 Overview and Analysis |
6.1.2 Qatar Pulleys Market Revenues & Volume, By Type, 2022-2032F |
6.1.3 Qatar Pulleys Market Revenues & Volume, By Steel, 2022-2032F |
6.1.4 Qatar Pulleys Market Revenues & Volume, By Cast Iron, 2022-2032F |
6.1.5 Qatar Pulleys Market Revenues & Volume, By Glass Filled Polymer, 2022-2032F |
6.2 Qatar Pulleys Market, By Applications |
6.2.1 Overview and Analysis |
6.2.2 Qatar Pulleys Market Revenues & Volume, By OEM, 2022-2032F |
6.2.3 Qatar Pulleys Market Revenues & Volume, By Aftermarket, 2022-2032F |
7 Qatar Pulleys Market Import-Export Trade Statistics |
7.1 Qatar Pulleys Market Export to Major Countries |
7.2 Qatar Pulleys Market Imports from Major Countries |
8 Qatar Pulleys Market Key Performance Indicators |
9 Qatar Pulleys Market - Opportunity Assessment |
9.1 Qatar Pulleys Market Opportunity Assessment, By Type, 2022 & 2032F |
9.2 Qatar Pulleys Market Opportunity Assessment, By Applications, 2022 & 2032F |
10 Qatar Pulleys Market - Competitive Landscape |
10.1 Qatar Pulleys Market Revenue Share, By Companies, 2025 |
10.2 Qatar Pulleys Market Competitive Benchmarking, By Operating and Technical Parameters |
11 Company Profiles |
12 Recommendations |
13 Disclaimer |
Global Go To Market Strategy - 2030
Export potential enables firms to identify high-growth global markets with greater confidence by combining advanced trade intelligence with a structured quantitative methodology. The framework analyzes emerging demand trends and country-level import patterns while integrating macroeconomic and trade datasets such as GDP and population forecasts, bilateral import–export flows, tariff structures, elasticity differentials between developed and developing economies, geographic distance, and import demand projections. Using weighted trade values from 2020–2024 as the base period to project country-to-country export potential for 2030, these inputs are operationalized through calculated drivers such as gravity model parameters, tariff impact factors, and projected GDP per-capita growth. Through an analysis of hidden potentials, demand hotspots, and market conditions that are most favorable to success, this method enables firms to focus on target countries, maximize returns, and global expansion with data, backed by accuracy.
By factoring in the projected importer demand gap that is currently unmet and could be potential opportunity, it identifies the potential for the Exporter (Country) among 190 countries, against the general trade analysis, which identifies the biggest importer or exporter.
To discover high-growth global markets and optimize your business strategy:
Click Here
Pricing
- Single User License$ 1,995
- Department License$ 2,400
- Site License$ 3,120
- Global License$ 3,795

Leadership Perspectives from Industry Events
Search
Thought Leadership and Analyst Meet


Our Clients
6WResearch In News
- India Air Conditioner Market Set for Strong Rebound in 2026 After Weather-Led Correction and GST-Driven Recovery: 6Wresearch
- ADAS in India: How Automatic Emergency Braking, Blind Spot Detection & Driver Monitoring are Transforming Road Safety
- Doha a strategic location for EV manufacturing hub: IPA Qatar
- Demand for luxury TVs surging in the GCC, says Samsung
- Empowering Growth: The Thriving Journey of Bangladesh’s Cable Industry
- Demand for luxury TVs surging in the GCC, says Samsung
Latest Reports
- Nicaragua RPG Gaming Market (2026-2032)
- New Zealand RPG Gaming Market (2026-2032)
- Netherlands RPG Gaming Market (2026-2032)
- Nauru RPG Gaming Market (2026-2032)
- Namibia RPG Gaming Market (2026-2032)
- Mozambique RPG Gaming Market (2026-2032)
- Montenegro RPG Gaming Market (2026-2032)
- Mongolia RPG Gaming Market (2026-2032)
- Monaco RPG Gaming Market (2026-2032)
- Micronesia RPG Gaming Market (2026-2032)
Industry Events and Analyst Meet

HIMTEX 2026

India Refining Summit 2026

India EV Show 2026

EV tech India Expo 2026

Auto Tech Asia 2026
Whitepaper
- Middle East & Africa Commercial Security Market Click here to view more.
- Middle East & Africa Fire Safety Systems & Equipment Market Click here to view more.
- GCC Drone Market Click here to view more.
- Middle East Lighting Fixture Market Click here to view more.
- GCC Physical & Perimeter Security Market Click here to view more.