Qatar Sand & Gravel Market (2026-2032) Outlook | Industry, Value, Revenue, Share, Growth, Analysis, Companies, Size, Forecast & Trends
Market Forecast By Product Type (Coarse Crushed Limestone Gravel, Pit Or Coarse Sand, Crushed Clean Stone, Fine Limestone Gravel, River Sand), By End Users (Glass, Road Construction, Mining, Foundry, Others) And Competitive Landscape
| Product Code: ETC304541 | Publication Date: Aug 2022 | Updated Date: Jul 2026 | Product Type: Market Research Report | |
| Publisher: 6Wresearch | Author: Ravi Bhandari | No. of Pages: 75 | No. of Figures: 35 | No. of Tables: 20 |
Qatar Sand & Gravel Market Size, Share & Growth Rate
The Qatar Sand & Gravel Market was estimated at USD 1056 Million in 2025 and is projected to reach USD 1507 Million by 2032, growing at a CAGR of 5.2% from 2026 to 2032. This growth trajectory is largely fueled by Qatars ambitious infrastructure development agenda, which includes a slew of mega-projects such as stadiums, transportation networks, and residential complexes. Additionally, the country's rapid urbanization and increasing population are fostering a continuous demand for sand and gravel as essential construction materials.
Qatar Sand & Gravel Market Year-wise Growth Rate and Key Drivers
This graph highlights how the Qatar Sand & Gravel Market has steadily grown over the years, supported by major growth factors.
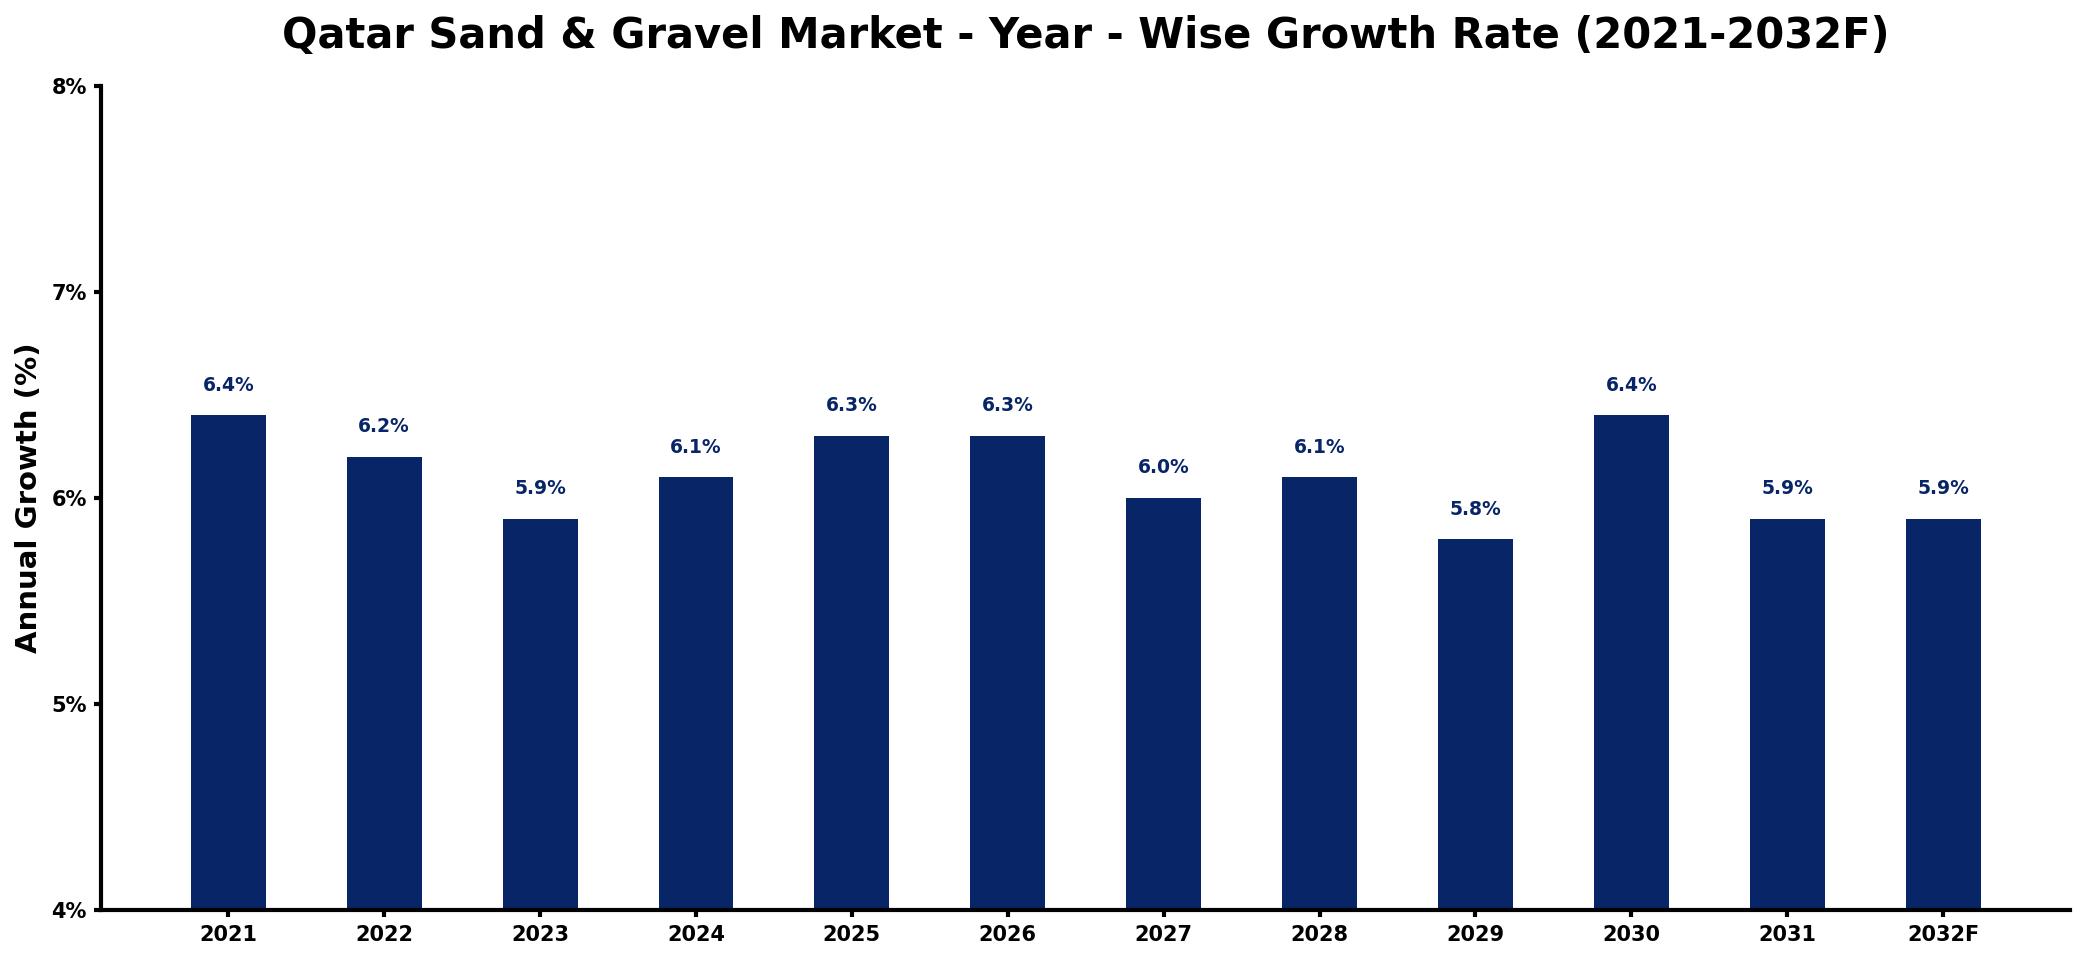
The table below presents the year‑wise growth rates along with the key drivers influencing the market
| Year | Growth Rate | Major Drivers |
| 2021 | 6.4% | Infrastructure investments drive demand |
| 2022 | 6.2% | Construction projects increase market activity |
| 2023 | 5.9% | Urbanization trends boost consumption |
| 2024 | 6.1% | Government initiatives support development |
| 2025 | 6.3% | Real estate growth enhances requirements |
| 2026 | 6.3% | Sustainable construction practices gain traction |
| 2027 | 6.0% | Transportation infrastructure needs rise |
| 2028 | 6.1% | Public projects stimulate market growth |
| 2029 | 5.8% | Private sector investments slow down |
| 2030 | 6.4% | Green building trends open opportunities |
| 2031 | 5.9% | Economic recovery fosters construction resurgence |
| 2032 | 5.9% | Technological advancements enhance efficiency |
Note: Market size estimations and growth projections presented in this report are based on 6Wresearch's proprietary forecasting methodology, utilizing the latest available industry data, government publications, and primary research inputs.
Qatar Sand & Gravel Market Synopsis
The most significant force shaping the Qatar Sand & Gravel Market is the booming construction sector, driven by unprecedented governmental investments in infrastructure. Major projects are underway, creating a stable demand for these vital materials, which are essential for realizing Qatar's developmental goals.
In addition, sustainability initiatives are playing an increasingly pivotal role in shaping market dynamics. With heightened awareness around environmental regulations, the demand for eco-friendly alternatives, including recycled sand and gravel, is on the rise, presenting new avenues for innovation and growth within the sector.
- Strong link to Qatars ongoing mega-projects driving robust demand for sand and gravel.
- Urbanization and population growth are vital contributors to market expansion.
- Focus on sustainability is steering demand towards eco-friendly construction materials.
- Adaptation to environmental regulations will be crucial for market players.
- Post-pandemic recovery is anticipated to boost infrastructure development activities.
Despite the promising growth prospects, the Qatar Sand & Gravel Market faces significant restraints, particularly related to sustainability and environmental concerns. The extraction processes for sand and gravel can lead to detrimental impacts on local ecosystems, prompting regulatory restrictions that could hinder operations. Furthermore, market players are required to navigate the complexities of fluctuating demand driven by economic cycles in the construction sector, necessitating a shift towards sustainable sourcing practices and innovative alternatives to traditional materials.
Several current and emerging trends are shaping the Qatar Sand & Gravel Market. A notable trend is the increased implementation of green building practices, where the use of recycled materials is gaining traction. Additionally, technological advancements in extraction and processing are enhancing operational efficiencies, allowing companies to meet rising demand while adhering to environmental standards. Moreover, the push for smart city initiatives is likely to redefine construction methodologies, further influencing the materials used.
The Qatar Sand & Gravel Market presents genuine growth opportunities, particularly in the realm of sustainable construction materials. Companies that invest in innovative recycling technologies can capitalize on the increasing demand for eco-friendly products. Furthermore, the anticipated surge in infrastructure projects tied to Qatar's Vision 2030 provides fertile ground for new entrants and established firms to expand their market footprint through strategic partnerships and collaborations.
The Qatari government has been actively promoting initiatives aimed at enhancing infrastructure and construction capabilities. Public spending on transportation networks, housing projects, and sporting facilities exemplifies this commitment, creating an enabling environment for the sand and gravel market. Additionally, various programs aimed at fostering sustainable development in construction practices are reinforcing the emphasis on using environmentally responsible materials.
Looking ahead to the period from 2026 to 2032, the Qatar Sand & Gravel Market is poised for significant evolution. Continued investments in mega-projects will sustain demand, while growing awareness of environmental issues will further push the shift towards sustainable practices. Market players who strategically adapt to these changes and embrace innovation will likely thrive in this competitive landscape, positioning themselves as leaders in a market defined by both growth and responsibility.
Recent developments in the Qatar Sand & Gravel Market indicate a strong recovery trajectory as infrastructure projects resume post-pandemic. There is an observable trend of increased collaboration among stakeholders aimed at enhancing the sustainability of extraction processes. Companies are also increasingly investing in R&D for eco-friendly alternatives to traditional materials, reflecting a shift toward greener construction practices.
- 10 Years of Market Numbers
- Historical Data Starting from 2022 to 2025
- Base Year: 2025
- Forecast Data until 2032
- Key Performance Indicators Impacting the Market
- Major Upcoming Developments and Projects
Key Highlights of the Report:
- Qatar Sand & Gravel Market Outlook
- Market Size of Qatar Sand & Gravel Market, 2025
- Forecast of Qatar Sand & Gravel Market, 2032
- Historical Data and Forecast of Qatar Sand & Gravel Revenues & Volume for the Period 2022-2032F
- Qatar Sand & Gravel Market Trend Evolution
- Qatar Sand & Gravel Market Drivers and Challenges
- Qatar Sand & Gravel Price Trends
- Qatar Sand & Gravel Porter's Five Forces
- Qatar Sand & Gravel Industry Life Cycle
- Historical Data and Forecast of Qatar Sand & Gravel Market Revenues & Volume By Product Type for the Period 2022-2032F
- Historical Data and Forecast of Qatar Sand & Gravel Market Revenues & Volume By Coarse Crushed Limestone Gravel for the Period 2022-2032F
- Historical Data and Forecast of Qatar Sand & Gravel Market Revenues & Volume By Pit Or Coarse Sand for the Period 2022-2032F
- Historical Data and Forecast of Qatar Sand & Gravel Market Revenues & Volume By Crushed Clean Stone for the Period 2022-2032F
- Historical Data and Forecast of Qatar Sand & Gravel Market Revenues & Volume By Fine Limestone Gravel for the Period 2022-2032F
- Historical Data and Forecast of Qatar Sand & Gravel Market Revenues & Volume By River Sand for the Period 2022-2032F
- Historical Data and Forecast of Qatar Sand & Gravel Market Revenues & Volume By End Users for the Period 2022-2032F
- Historical Data and Forecast of Qatar Sand & Gravel Market Revenues & Volume By Glass for the Period 2022-2032F
- Historical Data and Forecast of Qatar Sand & Gravel Market Revenues & Volume By Road Construction for the Period 2022-2032F
- Historical Data and Forecast of Qatar Sand & Gravel Market Revenues & Volume By Mining for the Period 2022-2032F
- Historical Data and Forecast of Qatar Sand & Gravel Market Revenues & Volume By Foundry for the Period 2022-2032F
- Historical Data and Forecast of Qatar Sand & Gravel Market Revenues & Volume By Others for the Period 2022-2032F
- Qatar Sand & Gravel Import Export Trade Statistics
- Market Opportunity Assessment By Product Type
- Market Opportunity Assessment By End Users
- Qatar Sand & Gravel Top Companies Market Share
- Qatar Sand & Gravel Competitive Benchmarking By Technical and Operational Parameters
- Qatar Sand & Gravel Company Profiles
- Qatar Sand & Gravel Key Strategic Recommendations
Frequently Asked Questions About the Market Study (FAQs):
The primary drivers include ongoing infrastructure development, a growing population, and the increasing focus on sustainability in construction practices.
The market was estimated at USD 1056 Million in 2025 and is projected to reach USD 1507 Million by 2032, growing at a CAGR of 5.2% from 2026 to 2032.
The extraction processes can have harmful effects on local ecosystems, leading to stricter regulations, which may increase operational costs and complicate sourcing practices.
Yes, there is a growing trend toward the use of recycled sand and gravel, along with other sustainable materials, as part of the green building movement.
Rapid urbanization in Qatar drives an increased demand for construction materials, necessitating a substantial supply of sand and gravel for housing and infrastructure development.
6Wresearch actively monitors the Qatar Sand & Gravel Market and publishes its comprehensive annual report, highlighting emerging trends, growth drivers, revenue analysis, and forecast outlook. Our insights help businesses to make data-backed strategic decisions with ongoing market dynamics. Our analysts track relevent industries related to the Qatar Sand & Gravel Market, allowing our clients with actionable intelligence and reliable forecasts tailored to emerging regional needs.
Yes, we provide customisation as per your requirements. To learn more, feel free to contact us on sales@6wresearch.com
1 Executive Summary |
2 Introduction |
2.1 Key Highlights of the Report |
2.2 Report Description |
2.3 Market Scope & Segmentation |
2.4 Research Methodology |
2.5 Assumptions |
3 Qatar Sand & Gravel Market Overview |
3.1 Qatar Country Macro Economic Indicators |
3.2 Qatar Sand & Gravel Market Revenues & Volume, 2022 & 2032F |
3.3 Qatar Sand & Gravel Market - Industry Life Cycle |
3.4 Qatar Sand & Gravel Market - Porter's Five Forces |
3.5 Qatar Sand & Gravel Market Revenues & Volume Share, By Product Type, 2022 & 2032F |
3.6 Qatar Sand & Gravel Market Revenues & Volume Share, By End Users, 2022 & 2032F |
4 Qatar Sand & Gravel Market Dynamics |
4.1 Impact Analysis |
4.2 Market Drivers |
4.2.1 Infrastructure development projects in Qatar |
4.2.2 Growing construction industry in Qatar |
4.2.3 Increasing urbanization and population growth in Qatar |
4.3 Market Restraints |
4.3.1 Limited availability of high-quality sand and gravel sources |
4.3.2 Environmental regulations and concerns related to extraction of sand and gravel |
5 Qatar Sand & Gravel Market Trends |
6 Qatar Sand & Gravel Market, By Types |
6.1 Qatar Sand & Gravel Market, By Product Type |
6.1.1 Overview and Analysis |
6.1.2 Qatar Sand & Gravel Market Revenues & Volume, By Product Type, 2022-2032F |
6.1.3 Qatar Sand & Gravel Market Revenues & Volume, By Coarse Crushed Limestone Gravel, 2022-2032F |
6.1.4 Qatar Sand & Gravel Market Revenues & Volume, By Pit Or Coarse Sand, 2022-2032F |
6.1.5 Qatar Sand & Gravel Market Revenues & Volume, By Crushed Clean Stone, 2022-2032F |
6.1.6 Qatar Sand & Gravel Market Revenues & Volume, By Fine Limestone Gravel, 2022-2032F |
6.1.7 Qatar Sand & Gravel Market Revenues & Volume, By River Sand, 2022-2032F |
6.2 Qatar Sand & Gravel Market, By End Users |
6.2.1 Overview and Analysis |
6.2.2 Qatar Sand & Gravel Market Revenues & Volume, By Glass, 2022-2032F |
6.2.3 Qatar Sand & Gravel Market Revenues & Volume, By Road Construction, 2022-2032F |
6.2.4 Qatar Sand & Gravel Market Revenues & Volume, By Mining, 2022-2032F |
6.2.5 Qatar Sand & Gravel Market Revenues & Volume, By Foundry, 2022-2032F |
6.2.6 Qatar Sand & Gravel Market Revenues & Volume, By Others, 2022-2032F |
7 Qatar Sand & Gravel Market Import-Export Trade Statistics |
7.1 Qatar Sand & Gravel Market Export to Major Countries |
7.2 Qatar Sand & Gravel Market Imports from Major Countries |
8 Qatar Sand & Gravel Market Key Performance Indicators |
8.1 Average selling price of sand and gravel |
8.2 Construction sector investment in Qatar |
8.3 Demand for sand and gravel in major infrastructure projects |
9 Qatar Sand & Gravel Market - Opportunity Assessment |
9.1 Qatar Sand & Gravel Market Opportunity Assessment, By Product Type, 2022 & 2032F |
9.2 Qatar Sand & Gravel Market Opportunity Assessment, By End Users, 2022 & 2032F |
10 Qatar Sand & Gravel Market - Competitive Landscape |
10.1 Qatar Sand & Gravel Market Revenue Share, By Companies, 2025 |
10.2 Qatar Sand & Gravel Market Competitive Benchmarking, By Operating and Technical Parameters |
11 Company Profiles |
12 Recommendations |
13 Disclaimer |
Global Go To Market Strategy - 2030
Export potential enables firms to identify high-growth global markets with greater confidence by combining advanced trade intelligence with a structured quantitative methodology. The framework analyzes emerging demand trends and country-level import patterns while integrating macroeconomic and trade datasets such as GDP and population forecasts, bilateral import–export flows, tariff structures, elasticity differentials between developed and developing economies, geographic distance, and import demand projections. Using weighted trade values from 2020–2024 as the base period to project country-to-country export potential for 2030, these inputs are operationalized through calculated drivers such as gravity model parameters, tariff impact factors, and projected GDP per-capita growth. Through an analysis of hidden potentials, demand hotspots, and market conditions that are most favorable to success, this method enables firms to focus on target countries, maximize returns, and global expansion with data, backed by accuracy.
By factoring in the projected importer demand gap that is currently unmet and could be potential opportunity, it identifies the potential for the Exporter (Country) among 190 countries, against the general trade analysis, which identifies the biggest importer or exporter.
To discover high-growth global markets and optimize your business strategy:
Click Here
Pricing
- Single User License$ 1,995
- Department License$ 2,400
- Site License$ 3,120
- Global License$ 3,795

Leadership Perspectives from Industry Events
Search
Thought Leadership and Analyst Meet


Our Clients
6WResearch In News
- India Air Conditioner Market Set for Strong Rebound in 2026 After Weather-Led Correction and GST-Driven Recovery: 6Wresearch
- ADAS in India: How Automatic Emergency Braking, Blind Spot Detection & Driver Monitoring are Transforming Road Safety
- Doha a strategic location for EV manufacturing hub: IPA Qatar
- Demand for luxury TVs surging in the GCC, says Samsung
- Empowering Growth: The Thriving Journey of Bangladesh’s Cable Industry
- Demand for luxury TVs surging in the GCC, says Samsung
Latest Reports
- Nicaragua RPG Gaming Market (2026-2032)
- New Zealand RPG Gaming Market (2026-2032)
- Netherlands RPG Gaming Market (2026-2032)
- Nauru RPG Gaming Market (2026-2032)
- Namibia RPG Gaming Market (2026-2032)
- Mozambique RPG Gaming Market (2026-2032)
- Montenegro RPG Gaming Market (2026-2032)
- Mongolia RPG Gaming Market (2026-2032)
- Monaco RPG Gaming Market (2026-2032)
- Micronesia RPG Gaming Market (2026-2032)
Industry Events and Analyst Meet

EV India Expo 2026

HIMTEX 2026

India Refining Summit 2026

India EV Show 2026

EV tech India Expo 2026
Whitepaper
- Middle East & Africa Commercial Security Market Click here to view more.
- Middle East & Africa Fire Safety Systems & Equipment Market Click here to view more.
- GCC Drone Market Click here to view more.
- Middle East Lighting Fixture Market Click here to view more.
- GCC Physical & Perimeter Security Market Click here to view more.