Qatar Steel Wires Market (2026-2032) | Value, Outlook, Revenue, Industry, Share, Companies, Growth, Trends, Forecast, Analysis & Size
Market Forecast By Grade (Carbon Steel, Stainless Steel, Alloy Steel), By End-Use Industry (Automotive, Construction, Energy, Agriculture, Others) And Competitive Landscape
| Product Code: ETC028501 | Publication Date: Jul 2023 | Updated Date: Jun 2026 | Product Type: Report | |
| Publisher: 6Wresearch | Author: Ravi Bhandari | No. of Pages: 70 | No. of Figures: 35 | No. of Tables: 5 |
Qatar Steel Wires Market Summary
The qatar steel wires market was estimated at USD 1404 Million in 2025 and is projected to reach USD 2000 Million by 2032, growing at a CAGR of 5.9% from 2026 to 2032.
Qatar Steel Wires Market Year-wise Growth Rate and Key Drivers
This graph highlights how the Qatar Steel Wires Market has steadily grown over the past five years, supported by major growth factors.
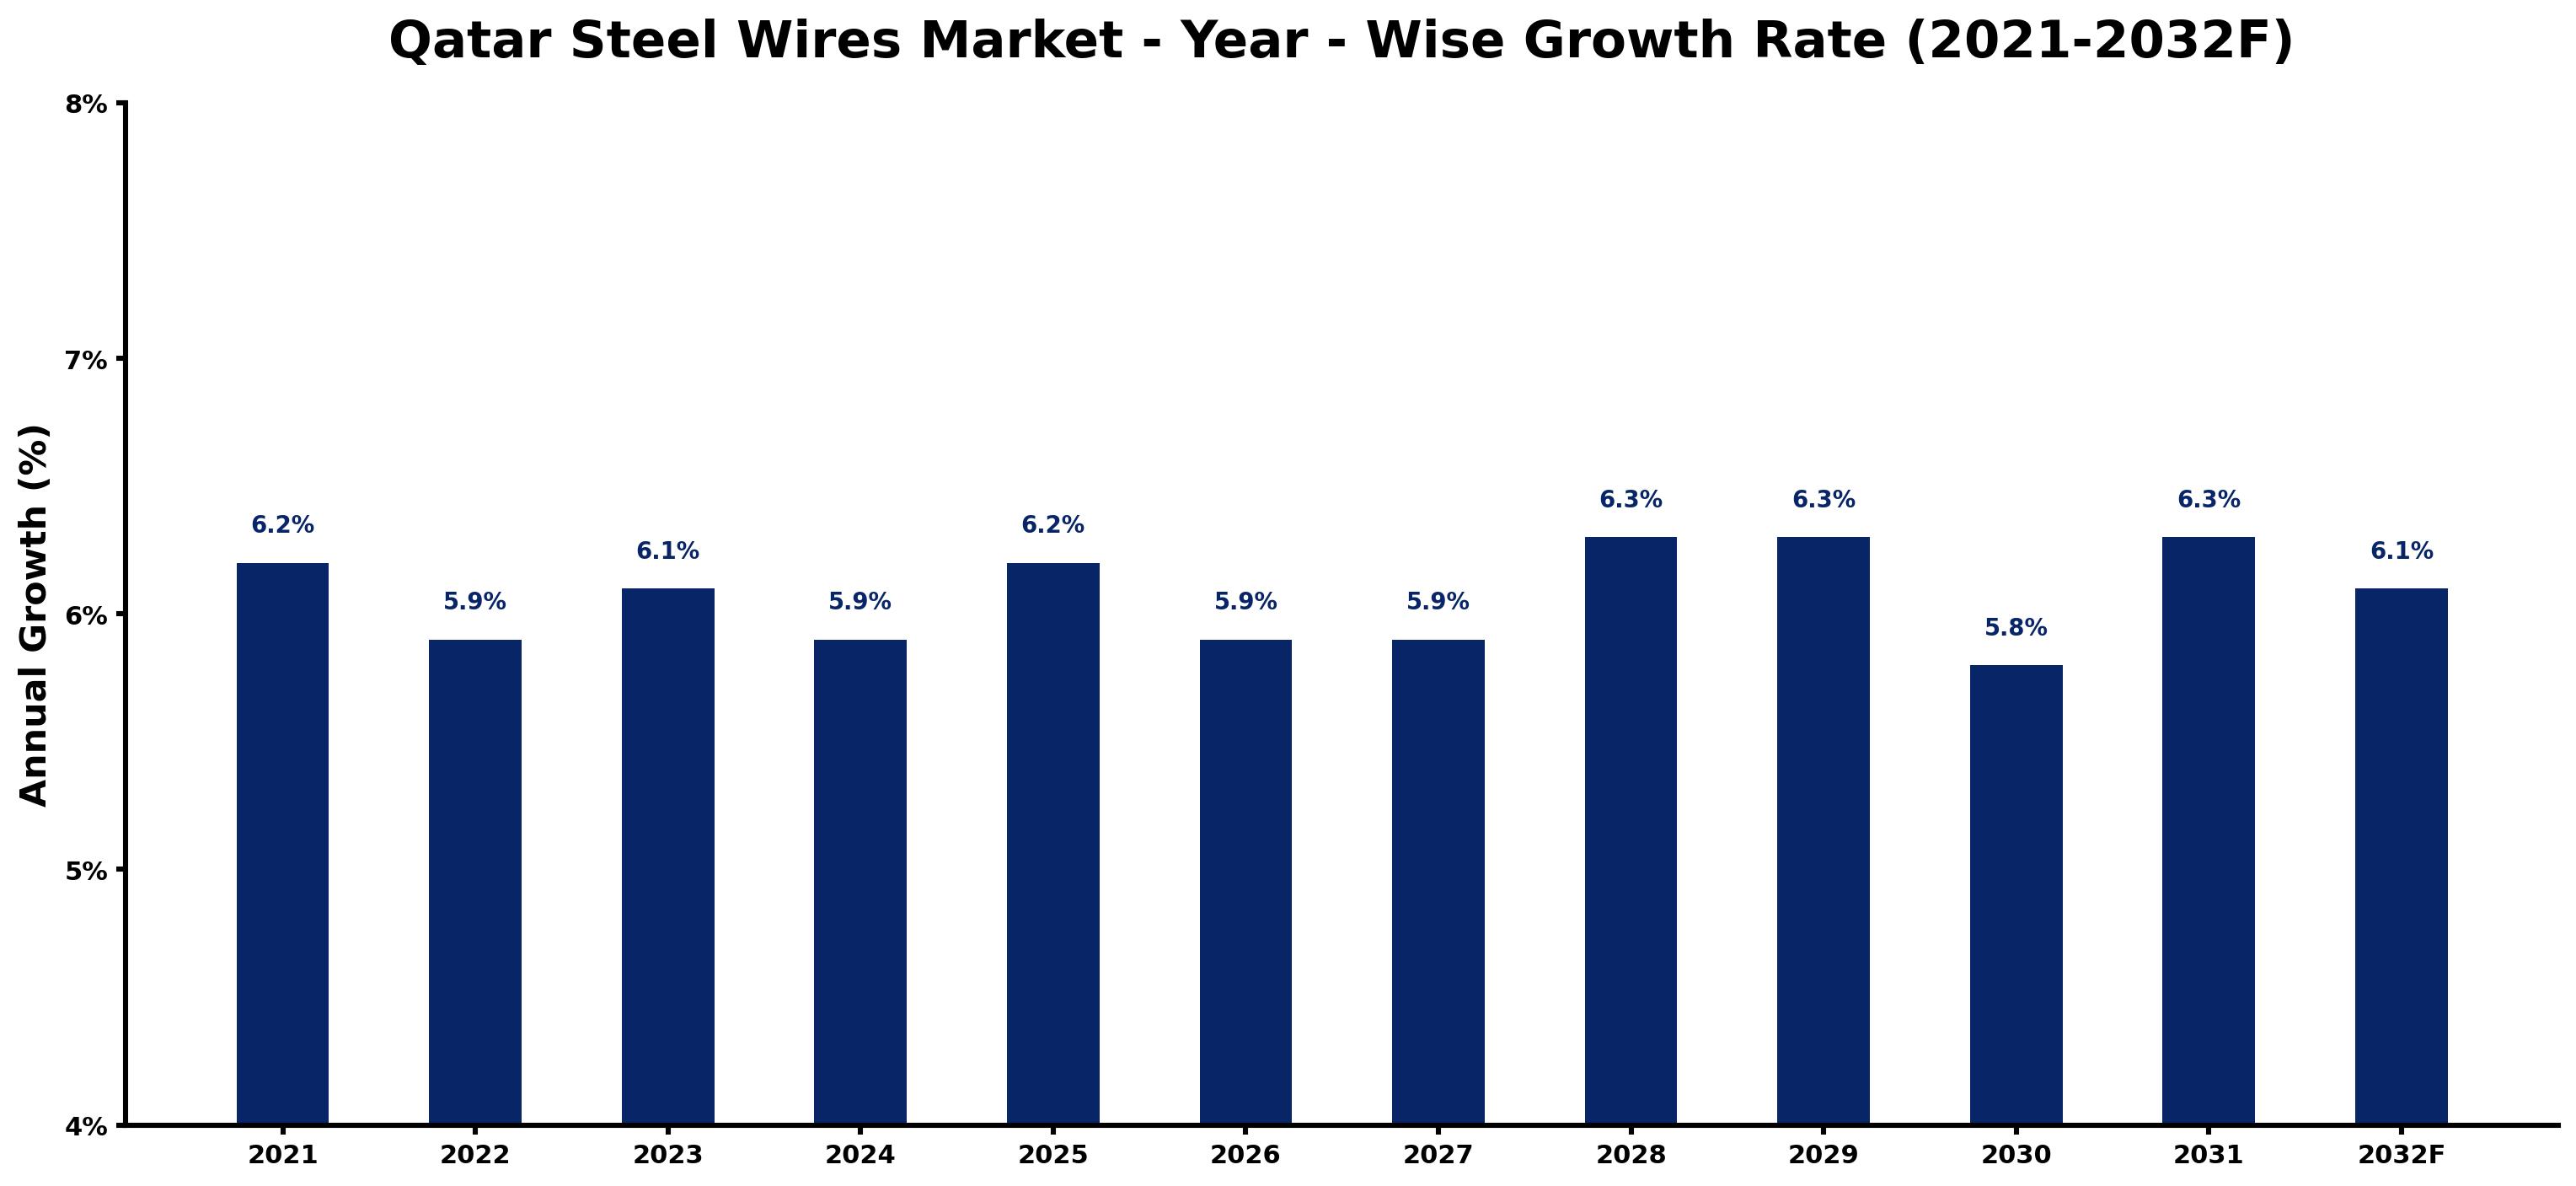
The table below presents the year wise growth rates along with the key drivers influencing the market
| Year | Growth Rate | Major Drivers |
| 2021 | 6.2% | Construction projects resumed post-pandemic, boosting steel wire demand throughout Qatar. |
| 2022 | 5.9% | Infrastructure development initiatives strengthened market resilience amid fluctuating global steel prices. |
| 2023 | 6.1% | Qatar's National Vision 2030 led to increased public-private partnerships in construction. |
| 2024 | 5.9% | Rising investments in infrastructure catalyzed demand for durable steel wire solutions. |
| 2025 | 6.2% | Local steel production enhancements improved supply chain efficiencies, affecting market dynamics. |
| 2026 | 5.9% | Sustainable construction practices gained traction, influencing wire specifications and material choices. |
| 2027 | 5.9% | Expansion in residential sectors contributed to a steady rise in wire consumption. |
| 2028 | 6.3% | Regional collaborations within the GCC fostered competitive pricing and market access. |
| 2029 | 6.3% | Technological innovations in manufacturing processes improved the quality of steel wires. |
| 2030 | 5.8% | Emerging renewable energy projects spurred additional applications for steel wire products. |
| 2031 | 6.3% | Economic diversification efforts decreased reliance on oil, increasing construction sector activity. |
| 2032 | 6.1% | The completion of major transport infrastructure transformed market accessibility and growth. |
Note - Market size estimations and growth projections presented in this report are based on 6Wresearch's advanced forecasting approach, validated with industry datasets as of June 2026.
Qatar Steel Wires Market Synopsis
The Qatar Steel Wires Market is projected to reach 5.9% and witness significant growth during the forecast period (2026-2032). As the largest and most competitive steel wires market in the region, Qatar's strategic investments in its steel industry have positioned it as a frontrunner in steel wire production. The market encompasses a diverse range of products including rods, bars, sheets, wire mesh, and GRP, predominantly utilized in construction and infrastructure projects.
Qatar Steel Wires Market Growth Drivers
The expansion of the Qatar Steel Wires Market is fueled by several key factors:
- The ongoing investment in infrastructure development across Qatar is a primary driver, as government initiatives bolster construction activities, thereby increasing demand for steel wire products.
- Government policies aimed at creating a robust industrial sector are enhancing operational efficiencies and boosting production capabilities for local manufacturers.
- Industries such as oil & gas and petrochemical plants are exhibiting a surge in demand for high-quality steel wires, further propelling market growth.
- Technological advancements in manufacturing processes have enabled producers to offer premium quality steel wires at lower costs, enhancing their appeal for various applications.
- The need for reliable materials in large-scale projects, such as the FIFA World Cup facilities and Qatar National Vision 2030, underscores the critical role of steel wires in the nation's infrastructure push.
Qatar Steel Wires Market Challenges and Restraints
Despite its promising growth trajectory, the Qatar Steel Wires Market faces several challenges:
- Procurement of raw materials can be hindered by stringent import/export regulations imposed by countries outside of Qatar, complicating supply chain dynamics.
- A lack of standardization among suppliers and manufacturers can lead to inconsistencies in product quality, potentially affecting customer trust and market stability.
- High transportation costs, exacerbated by geopolitical tensions, pose additional financial burdens on manufacturers, impacting overall profitability.
- Delays in delivery schedules, often caused by logistical issues, can disrupt project timelines and negatively affect client relationships.
- Adapting to fluctuating market conditions and maintaining competitive pricing require robust management strategies to navigate these challenges effectively.
Qatar Steel Wires Market Government Investment and Initiatives
The Qatari government plays a pivotal role in shaping the landscape of the steel wires market through various investments and initiatives:
- The government has outlined substantial funding commitments towards infrastructure development, significantly increasing the demand for steel wire applications in construction sectors.
- Policies aimed at enhancing manufacturing capabilities, including tax incentives and subsidies for local producers, are designed to boost the competitiveness of the domestic steel industry.
- Initiatives under Qatar National Vision 2030 focus on diversifying the economy, promoting industrial growth, and ultimately leading to enhanced demand for steel wire products.
- The establishment of quality control and standardization frameworks ensures that local manufacturers meet both domestic and international safety and quality benchmarks.
- Public-Private Partnerships (PPPs) are encouraged to foster collaboration between government entities and private sector players, facilitating investment and innovation within the steel wires market.
Qatar Steel Wires Market Latest Developments (May 2025 - June 2026)
During the period of May 2025 to June 2026, the Qatar Steel Wires Market has experienced notable developments:
- The market has seen a gradual recovery from the disruptions caused by the Covid-19 pandemic, with a rise in production capacities and operational stability.
- Increased focus on sustainability has prompted manufacturers to explore eco-friendly practices and the adoption of recycled materials in steel wire production.
- Investment in automation and digital technologies has led to improved operational efficiencies and reduced production costs for local firms.
- There has been a marked increase in online sales channels for steel wire products, allowing manufacturers to reach a broader customer base amidst ongoing challenges in traditional retail environments.
- Collaborations with international firms have emerged to enhance technological capabilities and share best practices, facilitating knowledge transfer within the industry.
Qatar Steel Wires Market - Key Attractiveness of the Report
- 10 Years of Market Numbers
- Historical Data Starting from 2022 to 2025
- Base Year: 2025
- Forecast Data until 2032
- Key Performance Indicators Impacting the Market
- Major Upcoming Developments and Projects
Key Highlights of the Report:
- Qatar Steel Wires Market Outlook
- Market Size of Qatar Steel Wires Market, 2025
- Forecast of Qatar Steel Wires Market, 2032
- Historical Data and Forecast of Qatar Steel Wires Revenues & Volume for the Period 2022-2032F
- Qatar Steel Wires Market Trend Evolution
- Qatar Steel Wires Market Drivers and Challenges
- Qatar Steel Wires Price Trends
- Qatar Steel Wires Porter's Five Forces
- Qatar Steel Wires Industry Life Cycle
- Historical Data and Forecast of Qatar Steel Wires Market Revenues & Volume By ?Grade for the Period 2022-2032F
- Historical Data and Forecast of Qatar Steel Wires Market Revenues & Volume By Carbon Steel for the Period 2022-2032F
- Historical Data and Forecast of Qatar Steel Wires Market Revenues & Volume By Stainless Steel for the Period 2022-2032F
- Historical Data and Forecast of Qatar Steel Wires Market Revenues & Volume By Alloy Steel for the Period 2022-2032F
- Historical Data and Forecast of Qatar Steel Wires Market Revenues & Volume By End-Use Industry for the Period 2022-2032F
- Historical Data and Forecast of Qatar Steel Wires Market Revenues & Volume By Automotive for the Period 2022-2032F
- Historical Data and Forecast of Qatar Steel Wires Market Revenues & Volume By Construction for the Period 2022-2032F
- Historical Data and Forecast of Qatar Steel Wires Market Revenues & Volume By Energy for the Period 2022-2032F
- Historical Data and Forecast of Qatar Steel Wires Market Revenues & Volume By Agriculture for the Period 2022-2032F
- Historical Data and Forecast of Qatar Steel Wires Market Revenues & Volume By Others for the Period 2022-2032F
- Qatar Steel Wires Import Export Trade Statistics
- Market Opportunity Assessment By ?Grade
- Market Opportunity Assessment By End-Use Industry
- Qatar Steel Wires Top Companies Market Share
- Qatar Steel Wires Competitive Benchmarking By Technical and Operational Parameters
- Qatar Steel Wires Company Profiles
- Qatar Steel Wires Key Strategic Recommendations
Frequently Asked Questions About the Market Study (FAQs):
Factors driving growth include government infrastructure investments, increasing industrial demand, and advancements in manufacturing technology.
Challenges include raw material procurement issues, high transportation costs, and a lack of standardization among suppliers.
The pandemic caused supply chain disruptions and decreased demand, although some opportunities in online sales have emerged since then.
The government supports the industry through investments, infrastructure development, and policies that promote local manufacturing and quality standards.
6Wresearch actively monitors the Qatar Steel Wires Market and publishes its comprehensive annual report, highlighting emerging trends, growth drivers, revenue analysis, and forecast outlook. Our insights help businesses to make data-backed strategic decisions with ongoing market dynamics. Our analysts track relevent industries related to the Qatar Steel Wires Market, allowing our clients with actionable intelligence and reliable forecasts tailored to emerging regional needs.
Yes, we provide customisation as per your requirements. To learn more, feel free to contact us on sales@6wresearch.com
1 Executive Summary |
2 Introduction |
2.1 Key Highlights of the Report |
2.2 Report Description |
2.3 Market Scope & Segmentation |
2.4 Research Methodology |
2.5 Assumptions |
3 Qatar Steel Wires Market Overview |
3.1 Qatar Country Macro Economic Indicators |
3.2 Qatar Steel Wires Market Revenues & Volume, 2022 & 2032F |
3.3 Qatar Steel Wires Market - Industry Life Cycle |
3.4 Qatar Steel Wires Market - Porter's Five Forces |
3.5 Qatar Steel Wires Market Revenues & Volume Share, By Grade, 2022 & 2032F |
3.6 Qatar Steel Wires Market Revenues & Volume Share, By End-Use Industry, 2022 & 2032F |
4 Qatar Steel Wires Market Dynamics |
4.1 Impact Analysis |
4.2 Market Drivers |
4.3 Market Restraints |
5 Qatar Steel Wires Market Trends |
6 Qatar Steel Wires Market, By Types |
6.1 Qatar Steel Wires Market, By Grade |
6.1.1 Overview and Analysis |
6.1.2 Qatar Steel Wires Market Revenues & Volume, By Grade, 2022-2032F |
6.1.3 Qatar Steel Wires Market Revenues & Volume, By Carbon Steel, 2022-2032F |
6.1.4 Qatar Steel Wires Market Revenues & Volume, By Stainless Steel, 2022-2032F |
6.1.5 Qatar Steel Wires Market Revenues & Volume, By Alloy Steel, 2022-2032F |
6.2 Qatar Steel Wires Market, By End-Use Industry |
6.2.1 Overview and Analysis |
6.2.2 Qatar Steel Wires Market Revenues & Volume, By Automotive, 2022-2032F |
6.2.3 Qatar Steel Wires Market Revenues & Volume, By Construction, 2022-2032F |
6.2.4 Qatar Steel Wires Market Revenues & Volume, By Energy, 2022-2032F |
6.2.5 Qatar Steel Wires Market Revenues & Volume, By Agriculture, 2022-2032F |
6.2.6 Qatar Steel Wires Market Revenues & Volume, By Others, 2022-2032F |
7 Qatar Steel Wires Market Import-Export Trade Statistics |
7.1 Qatar Steel Wires Market Export to Major Countries |
7.2 Qatar Steel Wires Market Imports from Major Countries |
8 Qatar Steel Wires Market Key Performance Indicators |
9 Qatar Steel Wires Market - Opportunity Assessment |
9.1 Qatar Steel Wires Market Opportunity Assessment, By Grade, 2022 & 2032F |
9.2 Qatar Steel Wires Market Opportunity Assessment, By End-Use Industry, 2022 & 2032F |
10 Qatar Steel Wires Market - Competitive Landscape |
10.1 Qatar Steel Wires Market Revenue Share, By Companies, 2025 |
10.2 Qatar Steel Wires Market Competitive Benchmarking, By Operating and Technical Parameters |
11 Company Profiles |
12 Recommendations |
13 Disclaimer |
Global Go To Market Strategy - 2030
Export potential enables firms to identify high-growth global markets with greater confidence by combining advanced trade intelligence with a structured quantitative methodology. The framework analyzes emerging demand trends and country-level import patterns while integrating macroeconomic and trade datasets such as GDP and population forecasts, bilateral import–export flows, tariff structures, elasticity differentials between developed and developing economies, geographic distance, and import demand projections. Using weighted trade values from 2020–2024 as the base period to project country-to-country export potential for 2030, these inputs are operationalized through calculated drivers such as gravity model parameters, tariff impact factors, and projected GDP per-capita growth. Through an analysis of hidden potentials, demand hotspots, and market conditions that are most favorable to success, this method enables firms to focus on target countries, maximize returns, and global expansion with data, backed by accuracy.
By factoring in the projected importer demand gap that is currently unmet and could be potential opportunity, it identifies the potential for the Exporter (Country) among 190 countries, against the general trade analysis, which identifies the biggest importer or exporter.
To discover high-growth global markets and optimize your business strategy:
Click Here
Pricing
- Single User License$ 1,995
- Department License$ 2,400
- Site License$ 3,120
- Global License$ 3,795

Leadership Perspectives from Industry Events
Search
Thought Leadership and Analyst Meet


Our Clients
6WResearch In News
- India Air Conditioner Market Set for Strong Rebound in 2026 After Weather-Led Correction and GST-Driven Recovery: 6Wresearch
- ADAS in India: How Automatic Emergency Braking, Blind Spot Detection & Driver Monitoring are Transforming Road Safety
- Doha a strategic location for EV manufacturing hub: IPA Qatar
- Demand for luxury TVs surging in the GCC, says Samsung
- Empowering Growth: The Thriving Journey of Bangladesh’s Cable Industry
- Demand for luxury TVs surging in the GCC, says Samsung
Latest Reports
- Nicaragua RPG Gaming Market (2026-2032)
- New Zealand RPG Gaming Market (2026-2032)
- Netherlands RPG Gaming Market (2026-2032)
- Nauru RPG Gaming Market (2026-2032)
- Namibia RPG Gaming Market (2026-2032)
- Mozambique RPG Gaming Market (2026-2032)
- Montenegro RPG Gaming Market (2026-2032)
- Mongolia RPG Gaming Market (2026-2032)
- Monaco RPG Gaming Market (2026-2032)
- Micronesia RPG Gaming Market (2026-2032)
Industry Events and Analyst Meet

EV India Expo 2026

HIMTEX 2026

India Refining Summit 2026

India EV Show 2026

EV tech India Expo 2026
Whitepaper
- Middle East & Africa Commercial Security Market Click here to view more.
- Middle East & Africa Fire Safety Systems & Equipment Market Click here to view more.
- GCC Drone Market Click here to view more.
- Middle East Lighting Fixture Market Click here to view more.
- GCC Physical & Perimeter Security Market Click here to view more.