Romania Bio Compatible Dental Materials Market (2026-2032) | Segments, Pricing Analysis, Revenue, Strategy, Trends, Restraints, Opportunities, Challenges, Investment Trends, Drivers, Analysis, Competitive, Outlook, Size, Consumer Insights, Industry, Forecast, Segmentation, Growth, Demand, Competition, Companies, Supply, Strategic Insights, Share, Value
Market Forecast By Material Type (Bio-Ceramics, Bio-Polymers, Bio-Metals), By Application (Dental Crowns, Braces, Dental Implants), By End User (Clinics, Orthodontics, Dental Labs), By Source (Biomass, Plant-Based, Sugar-Based), By Environmental Impact (Biodegradable, Non-Toxic, Durable) And Competitive Landscape
| Product Code: ETC11452708 | Publication Date: Apr 2025 | Updated Date: Apr 2026 | Product Type: Market Research Report | |
| Publisher: 6Wresearch | No. of Pages: 65 | No. of Figures: 34 | No. of Tables: 19 | |
Romania Bio Compatible Dental Materials Market Size (2020-2030)
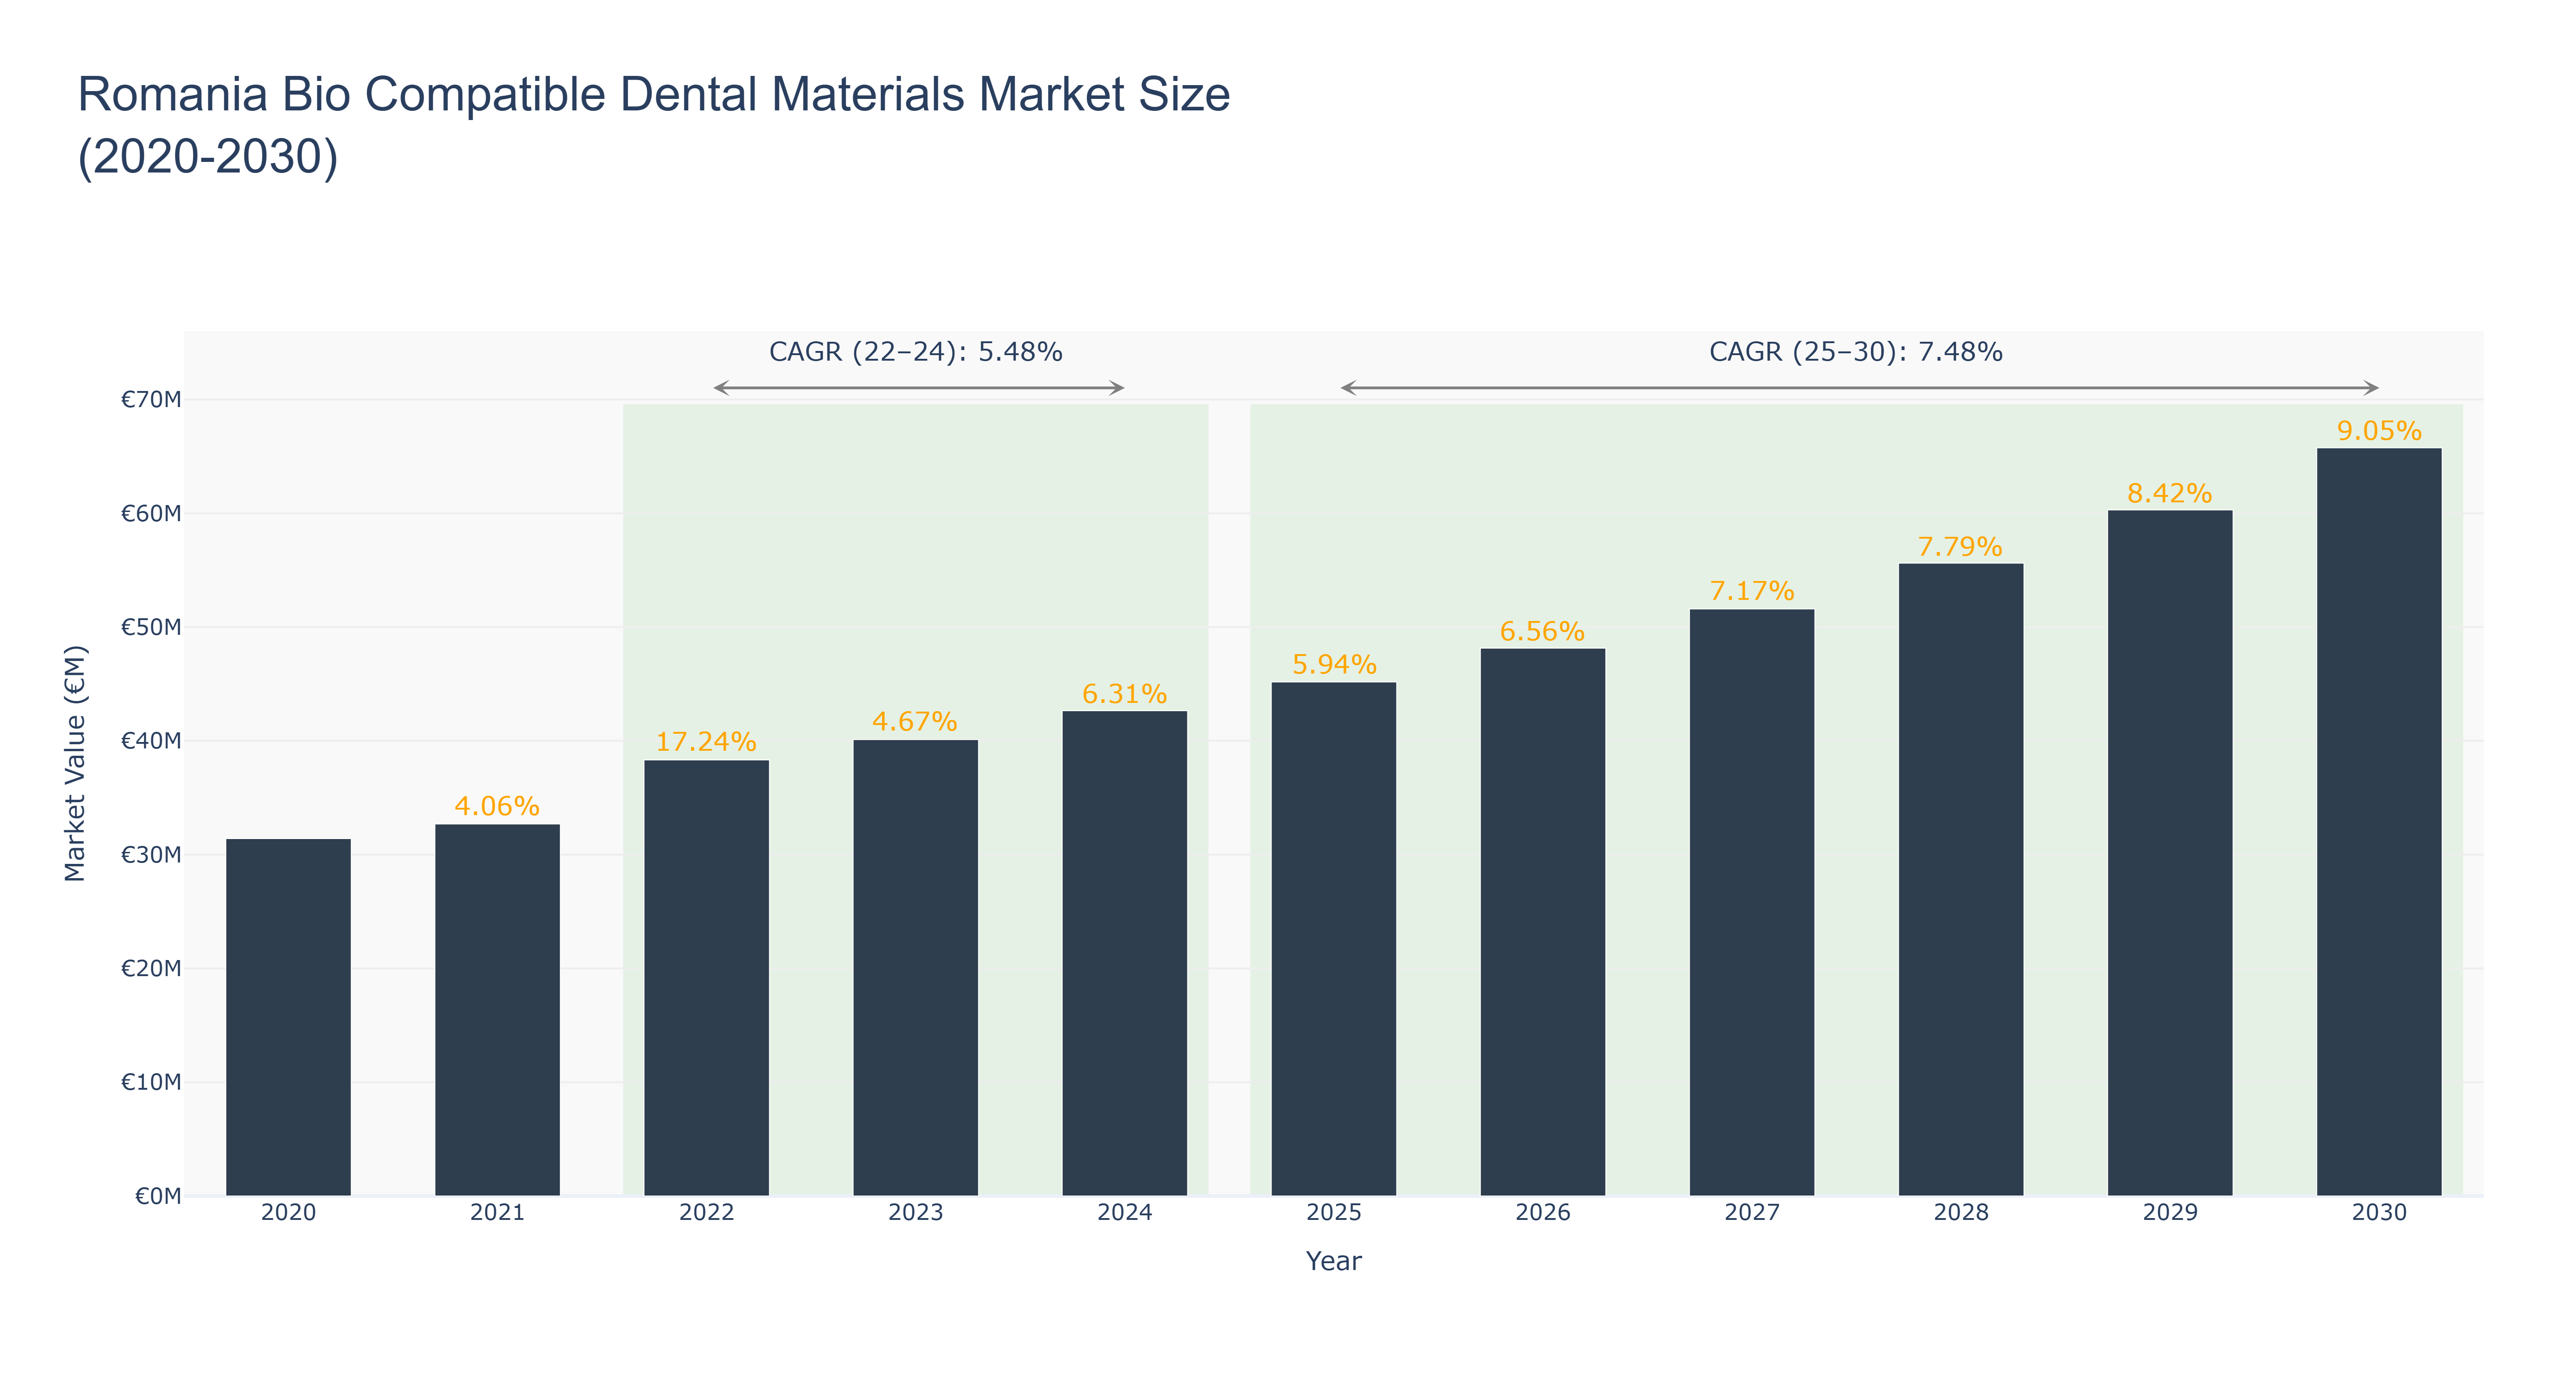
The Romania Bio Compatible Dental Materials Market experienced steady growth from €31.41 million in 2020 to a peak of €40.12 million in 2023, reflecting a compound annual growth rate (CAGR) of 5.48% between 2022 and 2024. This growth can be attributed to increasing consumer awareness of dental health and advancements in dental technology, which have driven demand for high-quality, biocompatible materials. The market is projected to continue its upward trajectory, reaching €65.76 million by 2030, with a forecasted CAGR of 7.48% from 2025 to 2030. Factors such as the rising incidence of dental disorders, an expanding elderly population, and ongoing investments in dental care infrastructure are expected to propel this growth. Additionally, emerging innovations in dental materials and techniques are likely to enhance treatment outcomes, further stimulating market expansion in the coming years.
Romania Bio Compatible Dental Materials Market: Production & Trade Performance (2019-2025)
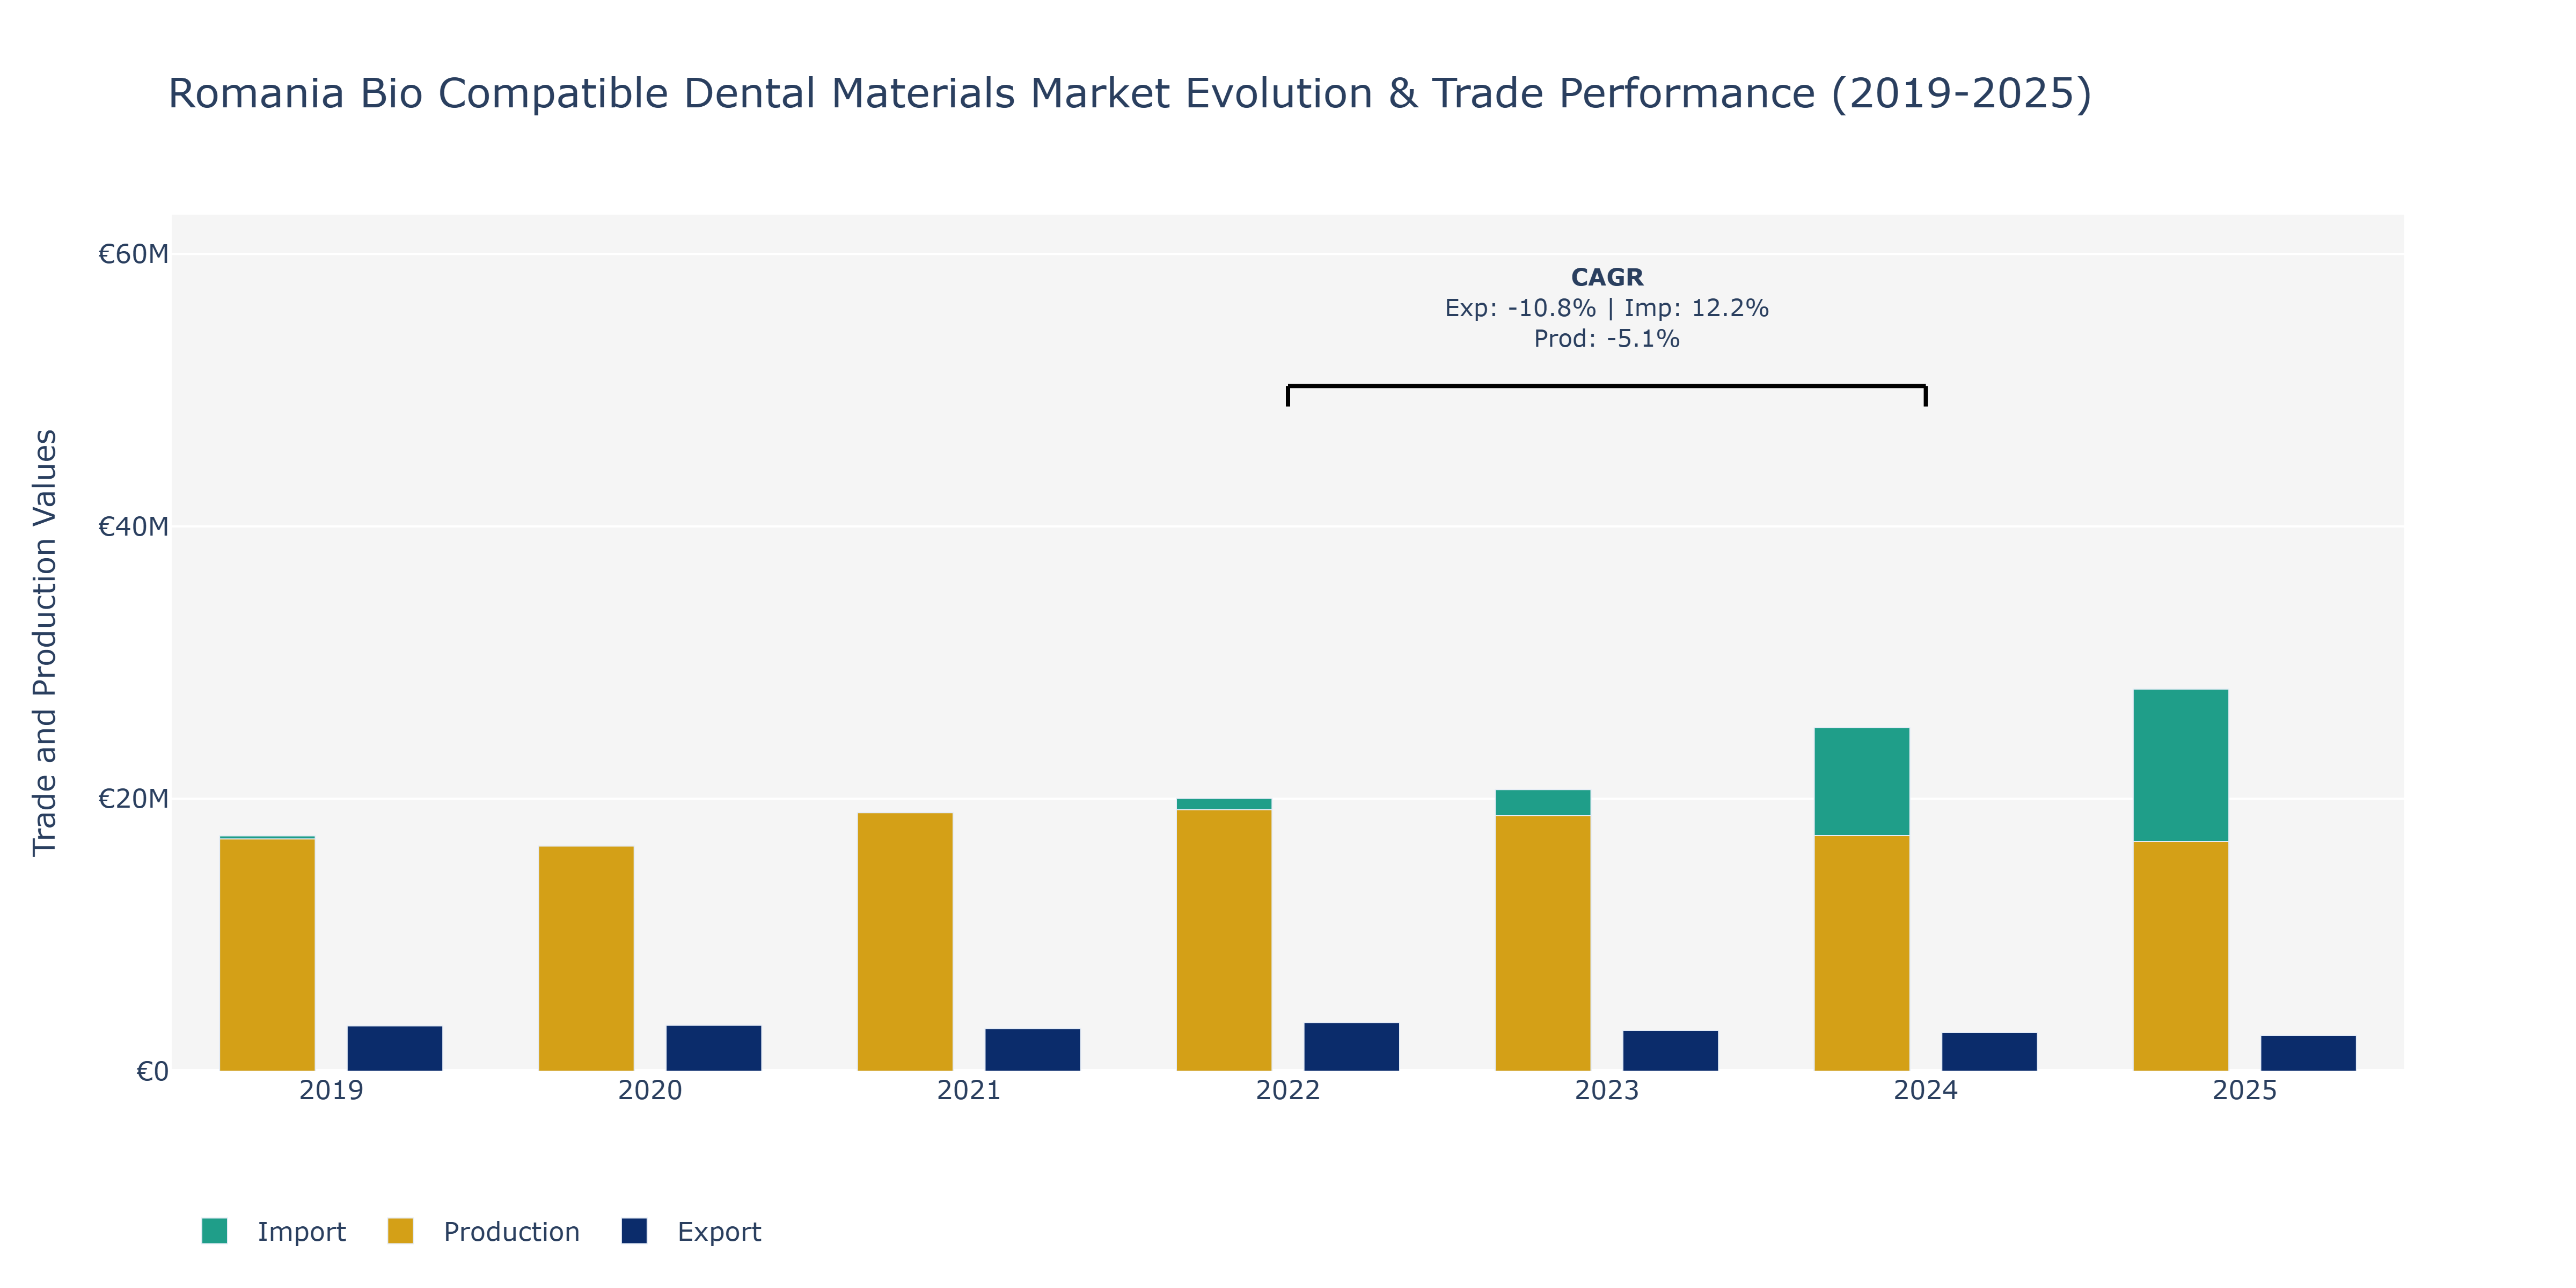
Between 2019 and 2025, Romania's Bio Compatible Dental Materials Market witnessed varying trends in exports, imports, and production. In 2022, exports peaked at €3.57 million, followed by a decline in subsequent years, dropping to €2.64 million in 2025. Conversely, imports surged to €28.05 million in 2025 from €17.28 million in 2019, with a notable growth rate of 12.23% during 2022–2024. Production, however, experienced a dip from €17.05 million in 2019 to €16.86 million in 2025, with a notable low in 2024. The fluctuations in exports and production could be attributed to advancements in technology leading to increased domestic production and greater export competitiveness. The rise in imports could reflect a growing demand for specialized dental materials not extensively produced domestically, indicating a potential need for partnerships or investment in local production capabilities to reduce dependency on imports and support market growth in the future.
Key Highlights of the Report:
- Romania Bio Compatible Dental Materials Market Outlook
- Market Size of Romania Bio Compatible Dental Materials Market, 2025
- Forecast of Romania Bio Compatible Dental Materials Market, 2032
- Historical Data and Forecast of Romania Bio Compatible Dental Materials Revenues & Volume for the Period 2022-2032F
- Romania Bio Compatible Dental Materials Market Trend Evolution
- Romania Bio Compatible Dental Materials Market Drivers and Challenges
- Romania Bio Compatible Dental Materials Price Trends
- Romania Bio Compatible Dental Materials Porter's Five Forces
- Romania Bio Compatible Dental Materials Industry Life Cycle
- Historical Data and Forecast of Romania Bio Compatible Dental Materials Market Revenues & Volume By Material Type for the Period 2022-2032F
- Historical Data and Forecast of Romania Bio Compatible Dental Materials Market Revenues & Volume By Bio-Ceramics for the Period 2022-2032F
- Historical Data and Forecast of Romania Bio Compatible Dental Materials Market Revenues & Volume By Bio-Polymers for the Period 2022-2032F
- Historical Data and Forecast of Romania Bio Compatible Dental Materials Market Revenues & Volume By Bio-Metals for the Period 2022-2032F
- Historical Data and Forecast of Romania Bio Compatible Dental Materials Market Revenues & Volume By Application for the Period 2022-2032F
- Historical Data and Forecast of Romania Bio Compatible Dental Materials Market Revenues & Volume By Dental Crowns for the Period 2022-2032F
- Historical Data and Forecast of Romania Bio Compatible Dental Materials Market Revenues & Volume By Braces for the Period 2022-2032F
- Historical Data and Forecast of Romania Bio Compatible Dental Materials Market Revenues & Volume By Dental Implants for the Period 2022-2032F
- Historical Data and Forecast of Romania Bio Compatible Dental Materials Market Revenues & Volume By End User for the Period 2022-2032F
- Historical Data and Forecast of Romania Bio Compatible Dental Materials Market Revenues & Volume By Clinics for the Period 2022-2032F
- Historical Data and Forecast of Romania Bio Compatible Dental Materials Market Revenues & Volume By Orthodontics for the Period 2022-2032F
- Historical Data and Forecast of Romania Bio Compatible Dental Materials Market Revenues & Volume By Dental Labs for the Period 2022-2032F
- Historical Data and Forecast of Romania Bio Compatible Dental Materials Market Revenues & Volume By Source for the Period 2022-2032F
- Historical Data and Forecast of Romania Bio Compatible Dental Materials Market Revenues & Volume By Biomass for the Period 2022-2032F
- Historical Data and Forecast of Romania Bio Compatible Dental Materials Market Revenues & Volume By Plant-Based for the Period 2022-2032F
- Historical Data and Forecast of Romania Bio Compatible Dental Materials Market Revenues & Volume By Sugar-Based for the Period 2022-2032F
- Historical Data and Forecast of Romania Bio Compatible Dental Materials Market Revenues & Volume By Environmental Impact for the Period 2022-2032F
- Historical Data and Forecast of Romania Bio Compatible Dental Materials Market Revenues & Volume By Biodegradable for the Period 2022-2032F
- Historical Data and Forecast of Romania Bio Compatible Dental Materials Market Revenues & Volume By Non-Toxic for the Period 2022-2032F
- Historical Data and Forecast of Romania Bio Compatible Dental Materials Market Revenues & Volume By Durable for the Period 2022-2032F
- Romania Bio Compatible Dental Materials Import Export Trade Statistics
- Market Opportunity Assessment By Material Type
- Market Opportunity Assessment By Application
- Market Opportunity Assessment By End User
- Market Opportunity Assessment By Source
- Market Opportunity Assessment By Environmental Impact
- Romania Bio Compatible Dental Materials Top Companies Market Share
- Romania Bio Compatible Dental Materials Competitive Benchmarking By Technical and Operational Parameters
- Romania Bio Compatible Dental Materials Company Profiles
- Romania Bio Compatible Dental Materials Key Strategic Recommendations
Frequently Asked Questions About the Market Study (FAQs):
6Wresearch actively monitors the Romania Bio Compatible Dental Materials Market and publishes its comprehensive annual report, highlighting emerging trends, growth drivers, revenue analysis, and forecast outlook. Our insights help businesses to make data-backed strategic decisions with ongoing market dynamics. Our analysts track relevent industries related to the Romania Bio Compatible Dental Materials Market, allowing our clients with actionable intelligence and reliable forecasts tailored to emerging regional needs.
Yes, we provide customisation as per your requirements. To learn more, feel free to contact us on sales@6wresearch.com
1 Executive Summary |
2 Introduction |
2.1 Key Highlights of the Report |
2.2 Report Description |
2.3 Market Scope & Segmentation |
2.4 Research Methodology |
2.5 Assumptions |
3 Romania Bio Compatible Dental Materials Market Overview |
3.1 Romania Country Macro Economic Indicators |
3.2 Romania Bio Compatible Dental Materials Market Revenues & Volume, 2022 & 2032F |
3.3 Romania Bio Compatible Dental Materials Market - Industry Life Cycle |
3.4 Romania Bio Compatible Dental Materials Market - Porter's Five Forces |
3.5 Romania Bio Compatible Dental Materials Market Revenues & Volume Share, By Material Type, 2022 & 2032F |
3.6 Romania Bio Compatible Dental Materials Market Revenues & Volume Share, By Application, 2022 & 2032F |
3.7 Romania Bio Compatible Dental Materials Market Revenues & Volume Share, By End User, 2022 & 2032F |
3.8 Romania Bio Compatible Dental Materials Market Revenues & Volume Share, By Source, 2022 & 2032F |
3.9 Romania Bio Compatible Dental Materials Market Revenues & Volume Share, By Environmental Impact, 2022 & 2032F |
4 Romania Bio Compatible Dental Materials Market Dynamics |
4.1 Impact Analysis |
4.2 Market Drivers |
4.2.1 Increasing awareness about the benefits of bio compatible dental materials among consumers and dental professionals |
4.2.2 Growing demand for cosmetic dentistry procedures in Romania |
4.2.3 Technological advancements leading to the development of innovative bio compatible dental materials |
4.3 Market Restraints |
4.3.1 High initial costs associated with bio compatible dental materials compared to traditional materials |
4.3.2 Limited reimbursement policies for bio compatible dental materials in Romania |
5 Romania Bio Compatible Dental Materials Market Trends |
6 Romania Bio Compatible Dental Materials Market, By Types |
6.1 Romania Bio Compatible Dental Materials Market, By Material Type |
6.1.1 Overview and Analysis |
6.1.2 Romania Bio Compatible Dental Materials Market Revenues & Volume, By Material Type, 2022 - 2032F |
6.1.3 Romania Bio Compatible Dental Materials Market Revenues & Volume, By Bio-Ceramics, 2022 - 2032F |
6.1.4 Romania Bio Compatible Dental Materials Market Revenues & Volume, By Bio-Polymers, 2022 - 2032F |
6.1.5 Romania Bio Compatible Dental Materials Market Revenues & Volume, By Bio-Metals, 2022 - 2032F |
6.2 Romania Bio Compatible Dental Materials Market, By Application |
6.2.1 Overview and Analysis |
6.2.2 Romania Bio Compatible Dental Materials Market Revenues & Volume, By Dental Crowns, 2022 - 2032F |
6.2.3 Romania Bio Compatible Dental Materials Market Revenues & Volume, By Braces, 2022 - 2032F |
6.2.4 Romania Bio Compatible Dental Materials Market Revenues & Volume, By Dental Implants, 2022 - 2032F |
6.3 Romania Bio Compatible Dental Materials Market, By End User |
6.3.1 Overview and Analysis |
6.3.2 Romania Bio Compatible Dental Materials Market Revenues & Volume, By Clinics, 2022 - 2032F |
6.3.3 Romania Bio Compatible Dental Materials Market Revenues & Volume, By Orthodontics, 2022 - 2032F |
6.3.4 Romania Bio Compatible Dental Materials Market Revenues & Volume, By Dental Labs, 2022 - 2032F |
6.4 Romania Bio Compatible Dental Materials Market, By Source |
6.4.1 Overview and Analysis |
6.4.2 Romania Bio Compatible Dental Materials Market Revenues & Volume, By Biomass, 2022 - 2032F |
6.4.3 Romania Bio Compatible Dental Materials Market Revenues & Volume, By Plant-Based, 2022 - 2032F |
6.4.4 Romania Bio Compatible Dental Materials Market Revenues & Volume, By Sugar-Based, 2022 - 2032F |
6.5 Romania Bio Compatible Dental Materials Market, By Environmental Impact |
6.5.1 Overview and Analysis |
6.5.2 Romania Bio Compatible Dental Materials Market Revenues & Volume, By Biodegradable, 2022 - 2032F |
6.5.3 Romania Bio Compatible Dental Materials Market Revenues & Volume, By Non-Toxic, 2022 - 2032F |
6.5.4 Romania Bio Compatible Dental Materials Market Revenues & Volume, By Durable, 2022 - 2032F |
7 Romania Bio Compatible Dental Materials Market Import-Export Trade Statistics |
7.1 Romania Bio Compatible Dental Materials Market Export to Major Countries |
7.2 Romania Bio Compatible Dental Materials Market Imports from Major Countries |
8 Romania Bio Compatible Dental Materials Market Key Performance Indicators |
8.1 Number of dental professionals trained in using bio compatible dental materials |
8.2 Adoption rate of bio compatible dental materials in dental clinics and hospitals |
8.3 Number of research and development initiatives focused on improving bio compatible dental materials |
9 Romania Bio Compatible Dental Materials Market - Opportunity Assessment |
9.1 Romania Bio Compatible Dental Materials Market Opportunity Assessment, By Material Type, 2022 & 2032F |
9.2 Romania Bio Compatible Dental Materials Market Opportunity Assessment, By Application, 2022 & 2032F |
9.3 Romania Bio Compatible Dental Materials Market Opportunity Assessment, By End User, 2022 & 2032F |
9.4 Romania Bio Compatible Dental Materials Market Opportunity Assessment, By Source, 2022 & 2032F |
9.5 Romania Bio Compatible Dental Materials Market Opportunity Assessment, By Environmental Impact, 2022 & 2032F |
10 Romania Bio Compatible Dental Materials Market - Competitive Landscape |
10.1 Romania Bio Compatible Dental Materials Market Revenue Share, By Companies, 2025 |
10.2 Romania Bio Compatible Dental Materials Market Competitive Benchmarking, By Operating and Technical Parameters |
11 Company Profiles |
12 Recommendations |
13 Disclaimer |
Export potential assessment - trade Analytics for 2030
Export potential enables firms to identify high-growth global markets with greater confidence by combining advanced trade intelligence with a structured quantitative methodology. The framework analyzes emerging demand trends and country-level import patterns while integrating macroeconomic and trade datasets such as GDP and population forecasts, bilateral import–export flows, tariff structures, elasticity differentials between developed and developing economies, geographic distance, and import demand projections. Using weighted trade values from 2020–2024 as the base period to project country-to-country export potential for 2030, these inputs are operationalized through calculated drivers such as gravity model parameters, tariff impact factors, and projected GDP per-capita growth. Through an analysis of hidden potentials, demand hotspots, and market conditions that are most favorable to success, this method enables firms to focus on target countries, maximize returns, and global expansion with data, backed by accuracy.
By factoring in the projected importer demand gap that is currently unmet and could be potential opportunity, it identifies the potential for the Exporter (Country) among 190 countries, against the general trade analysis, which identifies the biggest importer or exporter.
To discover high-growth global markets and optimize your business strategy:
Click Here
Pricing
- Single User License$ 1,995
- Department License$ 2,400
- Site License$ 3,120
- Global License$ 3,795

Search
Thought Leadership and Analyst Meet


Our Clients
Latest Reports
- India Ultrasonic Smart Water Meter Market (2026-2032) | Outlook, Competition, Drivers, Trends, Demand, Competitive, Strategic Insights, Companies, Challenges, Strategy, Consumer Insights, Analysis, Opportunities, Growth, Size, Share, Industry, Revenue, Segments, Value, Segmentation, Supply, Forecast, Restraints,
- India Electromagnetic Bulk Flow Meter Market (2026-2032) | Analysis, Challenges, Strategic Insights, Supply, Forecast, Growth, Share, Consumer Insights, Competitive, Value, Outlook, Size & Demand,
- India Battery Powered Bulk Flow Meter Market (2026-2032) | Outlook, Analysis, Competitive Landscape, Growth, Size, Trends, Value, Revenue, Companies, Segmentation, Share & Forecast
- Bosnia and Herzegovina Fuel-Efficient Winglets Market (2026-2032) | Growth, Competition, Strategy, Restraints, Trends, Challenges, segmentation, Value, Outlook, Investment Opportunities, Analysis, Revenue, Companies, Insights, Pricing, Size, Drivers, Demand, Share, Forecast
- Canada Cloud CFD Market (2026-2032) | Size & Revenue, Industry, Growth, Competitive Landscape, Forecast, Segmentation, Value, Outlook, Trends, Share, Analysis, Companies
- Taiwan Food Delivery Platform Market (2026-2032) | Companies, Outlook, Analysis, Trends, Value, Revenue, Segmentation, Share, Forecast, Competitive Landscape, Growth, Size & Forecast
- United Kingdom (UK) Long-term Care Insurance Market (2026-2032) | Growth, Share, Consumer Insights, Drivers, Opportunities, Competition, Pricing Analysis, Segments, Restraints, Companies, Competitive, Value, Outlook, Size, Demand, Analysis, Challenges, Strategic Insights, Investment Trends, Revenue, Trends, Supply, Forecast
- United Kingdom (UK) Long Term Care Market (2026-2032) | Companies, Outlook, Analysis, Trends, Value, Revenue, Segmentation, Share, Forecast, Competitive Landscape, Growth, Size & Forecast
- Iraq Insulation and Waterproofing Market (2026-2032) | Outlook, Drivers, Growth, Size, Share, Industry, Revenue, Trends, Demand, Competitive, Strategic Insights, Opportunities, Segments, Companies, Challenges, Strategy, Consumer Insights, Analysis, Investment Trends, Value, Segmentation, Forecast, Restraints
- India Switchgear Market Outlook (2026-2032) | Size, Share, Trends, Growth, Revenue, Forecast, Analysis, Value, Outlook
Industry Events and Analyst Meet

India EV Show 2026

EV tech India Expo 2026

Auto Tech Asia 2026

Battery Tech India 2026

Smart Production Solutions Guangzhou 2026
Whitepaper
- Middle East & Africa Commercial Security Market Click here to view more.
- Middle East & Africa Fire Safety Systems & Equipment Market Click here to view more.
- GCC Drone Market Click here to view more.
- Middle East Lighting Fixture Market Click here to view more.
- GCC Physical & Perimeter Security Market Click here to view more.
6WResearch In News
- Doha a strategic location for EV manufacturing hub: IPA Qatar
- Demand for luxury TVs surging in the GCC, says Samsung
- Empowering Growth: The Thriving Journey of Bangladesh’s Cable Industry
- Demand for luxury TVs surging in the GCC, says Samsung
- Video call with a traditional healer? Once unthinkable, it’s now common in South Africa
- Intelligent Buildings To Smooth GCC’s Path To Net Zero