Romania Butyric Acid Market Outlook | Revenue, Industry, Trends, COVID-19 IMPACT, Forecast, Size, Share, Growth, Value, Analysis & Companies
Market Forecast By Type (Natural Butyric Acid, Synthetic Butyric Acid), By Derivatives (Sodium Butyrate, Calcium Butyrate, Others), By Application (Animal Feed, Chemical Intermediate, Food and Flavours, Pharmaceuticals, Perfumes, Inks, Paints & Coatings, Others) And Competitive Landscape
| Product Code: ETC106537 | Publication Date: Jun 2021 | Updated Date: Mar 2026 | Product Type: Report | |
| Publisher: 6Wresearch | Author: Ravi Bhandari | No. of Pages: 70 | No. of Figures: 35 | No. of Tables: 5 |
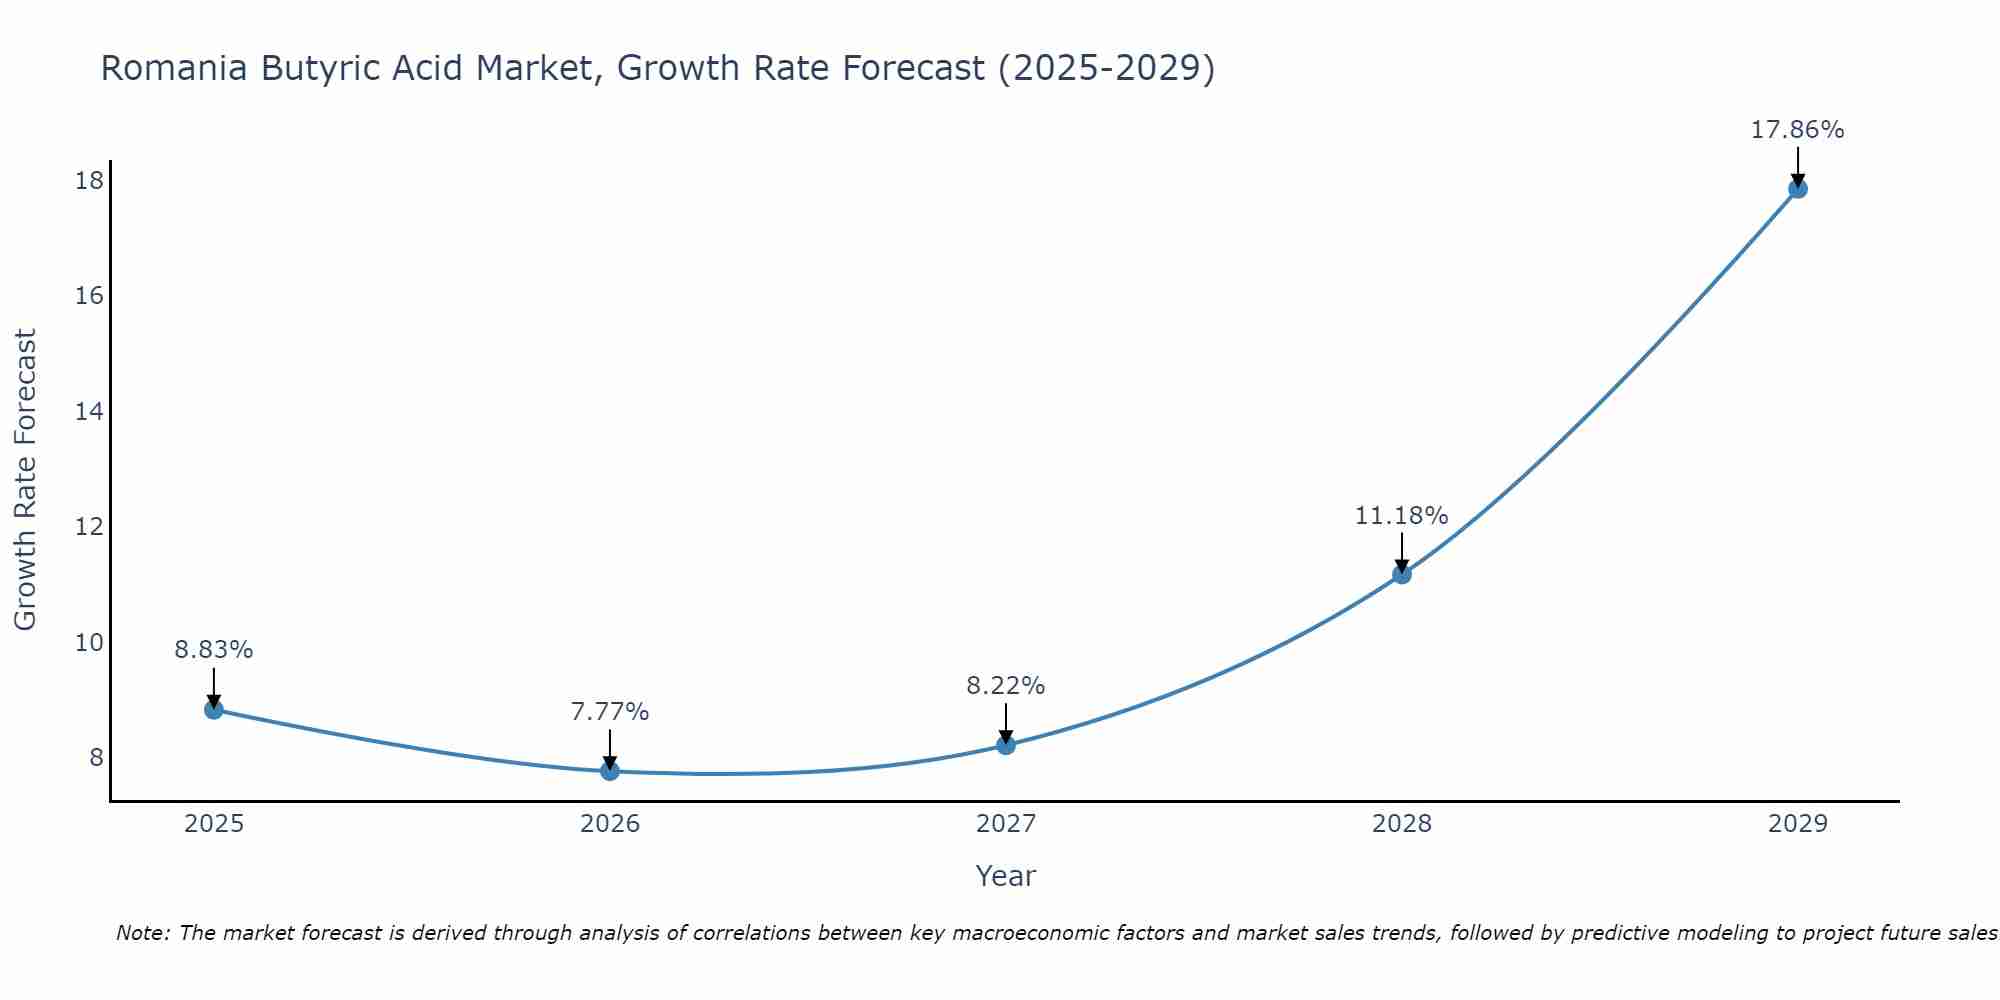
Romania Butyric Acid Market Size Growth Rate
The Romania Butyric Acid Market is projected to witness mixed growth rate patterns during 2025 to 2029. The growth rate starts at 8.83% in 2025 and reaches 17.86% by 2029.
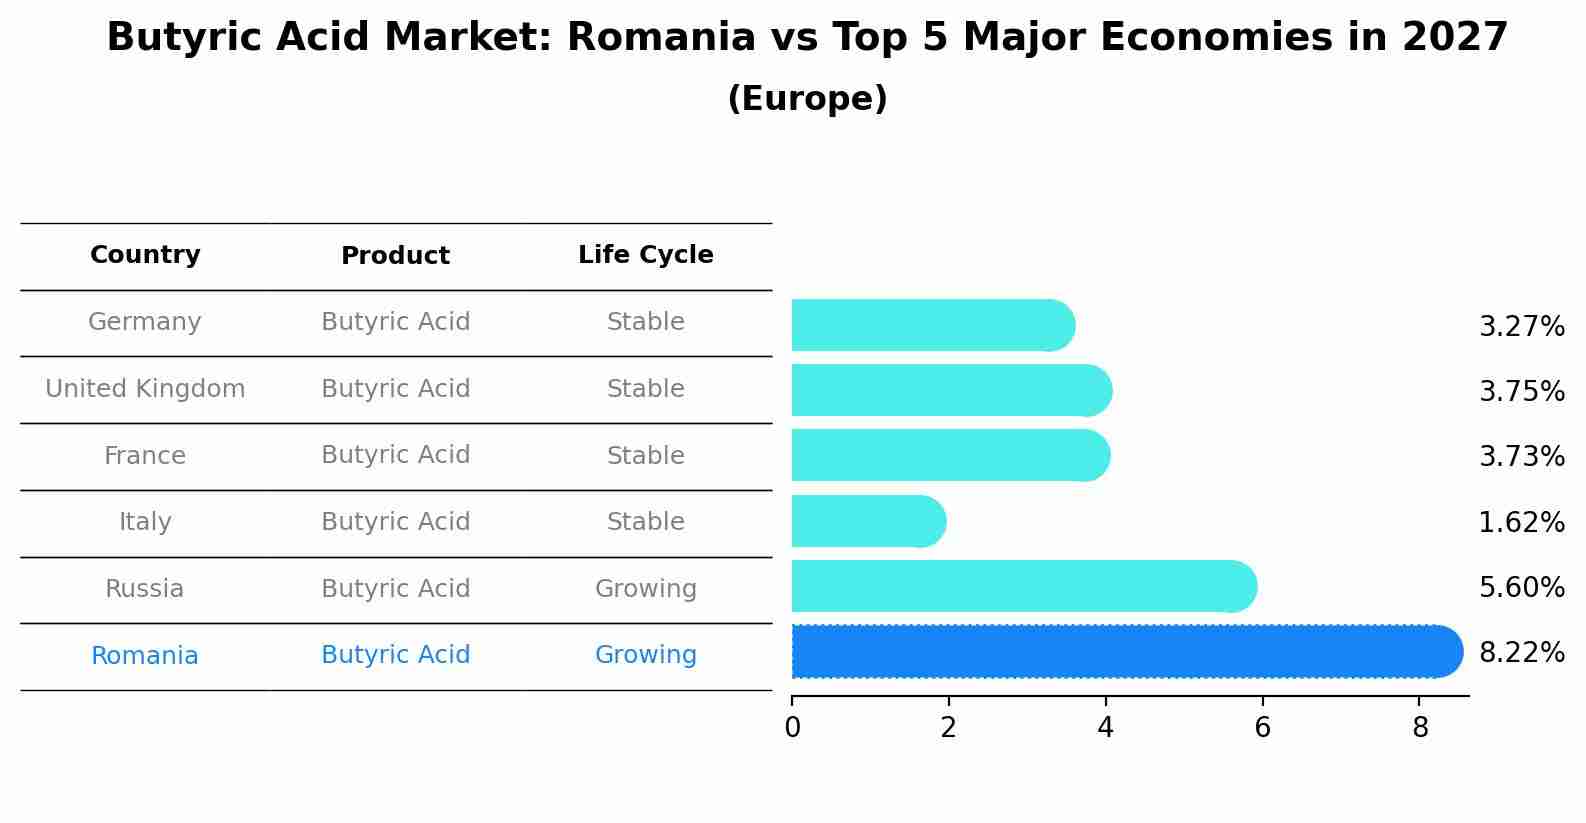
Butyric Acid Market: Romania vs Top 5 Major Economies in 2027 (Europe)
The Butyric Acid market in Romania is projected to grow at a growing growth rate of 8.22% by 2027, highlighting the country's increasing focus on advanced technologies within the Europe region, where Germany holds the dominant position, followed closely by United Kingdom, France, Italy and Russia, shaping overall regional demand.
Romania Butyric Acid Market Overview
The Romanian butyric acid market is experiencing growth driven by its applications in food and beverage, pharmaceutical, and animal feed industries. Increasing consumer preference for natural preservatives and nutritional supplements is boosting market demand. Manufacturers are emphasizing on sustainable production methods and product differentiation to capitalize on emerging opportunities in the market.
Drivers of the market
In Romania, the butyric acid market is driven by its applications in animal feed, pharmaceuticals, and food additives. Its role as a flavoring agent and antimicrobial preservative in food products, as well as its use in animal nutrition for its antibacterial properties, supports its market growth.
Challenges of the market
The Butyric Acid market in Romania faces challenges such as limited availability of raw materials and high production costs. Market growth is hindered by the niche applications of butyric acid, primarily in animal feed additives and pharmaceuticals. Economic factors and regulatory pressures influence market dynamics, requiring continuous innovation and cost management strategies.
Government Policy of the market
Similarly, in the butyric acid market, Romania government emphasizes sustainable agriculture and food safety. Policies promote the use of butyric acid as a food additive within strict regulatory limits, ensuring consumer health and promoting transparency in food labeling and production practices.
Key Highlights of the Report:
- Romania Butyric Acid Market Outlook
- Market Size of Romania Butyric Acid Market, 2025
- Forecast of Romania Butyric Acid Market, 2032
- Historical Data and Forecast of Romania Butyric Acid Revenues & Volume for the Period 2018 - 2032
- Romania Butyric Acid Market Trend Evolution
- Romania Butyric Acid Market Drivers and Challenges
- Romania Butyric Acid Price Trends
- Romania Butyric Acid Porter's Five Forces
- Romania Butyric Acid Industry Life Cycle
- Historical Data and Forecast of Romania Butyric Acid Market Revenues & Volume By Type for the Period 2018 - 2032
- Historical Data and Forecast of Romania Butyric Acid Market Revenues & Volume By Natural Butyric Acid for the Period 2018 - 2032
- Historical Data and Forecast of Romania Butyric Acid Market Revenues & Volume By Synthetic Butyric Acid for the Period 2018 - 2032
- Historical Data and Forecast of Romania Butyric Acid Market Revenues & Volume By Derivatives for the Period 2018 - 2032
- Historical Data and Forecast of Romania Butyric Acid Market Revenues & Volume By Sodium Butyrate for the Period 2018 - 2032
- Historical Data and Forecast of Romania Butyric Acid Market Revenues & Volume By Calcium Butyrate for the Period 2018 - 2032
- Historical Data and Forecast of Romania Butyric Acid Market Revenues & Volume By Others for the Period 2018 - 2032
- Historical Data and Forecast of Romania Butyric Acid Market Revenues & Volume By Application for the Period 2018 - 2032
- Historical Data and Forecast of Romania Butyric Acid Market Revenues & Volume By Animal Feed for the Period 2018 - 2032
- Historical Data and Forecast of Romania Butyric Acid Market Revenues & Volume By Chemical Intermediate for the Period 2018 - 2032
- Historical Data and Forecast of Romania Butyric Acid Market Revenues & Volume By Food and Flavours for the Period 2018 - 2032
- Historical Data and Forecast of Romania Butyric Acid Market Revenues & Volume By Pharmaceuticals for the Period 2018 - 2032
- Historical Data and Forecast of Romania Butyric Acid Market Revenues & Volume By Perfumes for the Period 2018 - 2032
- Historical Data and Forecast of Romania Butyric Acid Market Revenues & Volume By Inks for the Period 2018 - 2032
- Historical Data and Forecast of Romania Butyric Acid Market Revenues & Volume By Paints & Coatings for the Period 2018 - 2032
- Historical Data and Forecast of Romania Butyric Acid Market Revenues & Volume By Others for the Period 2018 - 2032
- Romania Butyric Acid Import Export Trade Statistics
- Market Opportunity Assessment By Type
- Market Opportunity Assessment By Derivatives
- Market Opportunity Assessment By Application
- Romania Butyric Acid Top Companies Market Share
- Romania Butyric Acid Competitive Benchmarking By Technical and Operational Parameters
- Romania Butyric Acid Company Profiles
- Romania Butyric Acid Key Strategic Recommendations
Romania Butyric Acid Market: FAQs
6Wresearch actively monitors the Romania Butyric Acid Market and publishes its comprehensive annual report, highlighting emerging trends, growth drivers, revenue analysis, and forecast outlook. Our insights help businesses to make data-backed strategic decisions with ongoing market dynamics. Our analysts track relevent industries related to the Romania Butyric Acid Market, allowing our clients with actionable intelligence and reliable forecasts tailored to emerging regional needs.
Yes, we provide customisation as per your requirements. To learn more, feel free to contact us on sales@6wresearch.com
1 Executive Summary |
2 Introduction |
2.1 Key Highlights of the Report |
2.2 Report Description |
2.3 Market Scope & Segmentation |
2.4 Research Methodology |
2.5 Assumptions |
3 Romania Butyric Acid Market Overview |
3.1 Romania Country Macro Economic Indicators |
3.2 Romania Butyric Acid Market Revenues & Volume, 2022 & 2032F |
3.3 Romania Butyric Acid Market - Industry Life Cycle |
3.4 Romania Butyric Acid Market - Porter's Five Forces |
3.5 Romania Butyric Acid Market Revenues & Volume Share, By Type, 2022 & 2032F |
3.6 Romania Butyric Acid Market Revenues & Volume Share, By Derivatives, 2022 & 2032F |
3.7 Romania Butyric Acid Market Revenues & Volume Share, By Application, 2022 & 2032F |
4 Romania Butyric Acid Market Dynamics |
4.1 Impact Analysis |
4.2 Market Drivers |
4.3 Market Restraints |
5 Romania Butyric Acid Market Trends |
6 Romania Butyric Acid Market, By Types |
6.1 Romania Butyric Acid Market, By Type |
6.1.1 Overview and Analysis |
6.1.2 Romania Butyric Acid Market Revenues & Volume, By Type, 2022 - 2032F |
6.1.3 Romania Butyric Acid Market Revenues & Volume, By Natural Butyric Acid, 2022 - 2032F |
6.1.4 Romania Butyric Acid Market Revenues & Volume, By Synthetic Butyric Acid, 2022 - 2032F |
6.2 Romania Butyric Acid Market, By Derivatives |
6.2.1 Overview and Analysis |
6.2.2 Romania Butyric Acid Market Revenues & Volume, By Sodium Butyrate, 2022 - 2032F |
6.2.3 Romania Butyric Acid Market Revenues & Volume, By Calcium Butyrate, 2022 - 2032F |
6.2.4 Romania Butyric Acid Market Revenues & Volume, By Others, 2022 - 2032F |
6.3 Romania Butyric Acid Market, By Application |
6.3.1 Overview and Analysis |
6.3.2 Romania Butyric Acid Market Revenues & Volume, By Animal Feed, 2022 - 2032F |
6.3.3 Romania Butyric Acid Market Revenues & Volume, By Chemical Intermediate, 2022 - 2032F |
6.3.4 Romania Butyric Acid Market Revenues & Volume, By Food and Flavours, 2022 - 2032F |
6.3.5 Romania Butyric Acid Market Revenues & Volume, By Pharmaceuticals, 2022 - 2032F |
6.3.6 Romania Butyric Acid Market Revenues & Volume, By Perfumes, 2022 - 2032F |
6.3.7 Romania Butyric Acid Market Revenues & Volume, By Inks, 2022 - 2032F |
6.3.8 Romania Butyric Acid Market Revenues & Volume, By Others, 2022 - 2032F |
6.3.9 Romania Butyric Acid Market Revenues & Volume, By Others, 2022 - 2032F |
7 Romania Butyric Acid Market Import-Export Trade Statistics |
7.1 Romania Butyric Acid Market Export to Major Countries |
7.2 Romania Butyric Acid Market Imports from Major Countries |
8 Romania Butyric Acid Market Key Performance Indicators |
9 Romania Butyric Acid Market - Opportunity Assessment |
9.1 Romania Butyric Acid Market Opportunity Assessment, By Type, 2022 & 2032F |
9.2 Romania Butyric Acid Market Opportunity Assessment, By Derivatives, 2022 & 2032F |
9.3 Romania Butyric Acid Market Opportunity Assessment, By Application, 2022 & 2032F |
10 Romania Butyric Acid Market - Competitive Landscape |
10.1 Romania Butyric Acid Market Revenue Share, By Companies, 2025 |
10.2 Romania Butyric Acid Market Competitive Benchmarking, By Operating and Technical Parameters |
11 Company Profiles |
12 Recommendations |
13 Disclaimer |
Global Go To Market Strategy - 2030
Export potential enables firms to identify high-growth global markets with greater confidence by combining advanced trade intelligence with a structured quantitative methodology. The framework analyzes emerging demand trends and country-level import patterns while integrating macroeconomic and trade datasets such as GDP and population forecasts, bilateral import–export flows, tariff structures, elasticity differentials between developed and developing economies, geographic distance, and import demand projections. Using weighted trade values from 2020–2024 as the base period to project country-to-country export potential for 2030, these inputs are operationalized through calculated drivers such as gravity model parameters, tariff impact factors, and projected GDP per-capita growth. Through an analysis of hidden potentials, demand hotspots, and market conditions that are most favorable to success, this method enables firms to focus on target countries, maximize returns, and global expansion with data, backed by accuracy.
By factoring in the projected importer demand gap that is currently unmet and could be potential opportunity, it identifies the potential for the Exporter (Country) among 190 countries, against the general trade analysis, which identifies the biggest importer or exporter.
To discover high-growth global markets and optimize your business strategy:
Click Here
Pricing
- Single User License$ 1,995
- Department License$ 2,400
- Site License$ 3,120
- Global License$ 3,795

Leadership Perspectives from Industry Events
Search
Thought Leadership and Analyst Meet


Our Clients
6WResearch In News
- India Air Conditioner Market Set for Strong Rebound in 2026 After Weather-Led Correction and GST-Driven Recovery: 6Wresearch
- ADAS in India: How Automatic Emergency Braking, Blind Spot Detection & Driver Monitoring are Transforming Road Safety
- Doha a strategic location for EV manufacturing hub: IPA Qatar
- Demand for luxury TVs surging in the GCC, says Samsung
- Empowering Growth: The Thriving Journey of Bangladesh’s Cable Industry
- Demand for luxury TVs surging in the GCC, says Samsung
Latest Reports
- Nicaragua RPG Gaming Market (2026-2032)
- New Zealand RPG Gaming Market (2026-2032)
- Netherlands RPG Gaming Market (2026-2032)
- Nauru RPG Gaming Market (2026-2032)
- Namibia RPG Gaming Market (2026-2032)
- Mozambique RPG Gaming Market (2026-2032)
- Montenegro RPG Gaming Market (2026-2032)
- Mongolia RPG Gaming Market (2026-2032)
- Monaco RPG Gaming Market (2026-2032)
- Micronesia RPG Gaming Market (2026-2032)
Industry Events and Analyst Meet

EV India Expo 2026

HIMTEX 2026

India Refining Summit 2026

India EV Show 2026

EV tech India Expo 2026
Whitepaper
- Middle East & Africa Commercial Security Market Click here to view more.
- Middle East & Africa Fire Safety Systems & Equipment Market Click here to view more.
- GCC Drone Market Click here to view more.
- Middle East Lighting Fixture Market Click here to view more.
- GCC Physical & Perimeter Security Market Click here to view more.