Romania Molybdenum Market (2026-2032) | Growth, Forecast, Outlook, Share, Revenue, Industry, Trends, Size, COVID-19 IMPACT, Value, Companies & Analysis
Market Forecast By Product Types (Steel, Chemical, Foundry, MO-Metal, Nickel Alloy, Others), By End-users (Oil and Gas, Chemical and Petrochemical, Automotive, Industrial Usage, Building and Construction, Aerospace and Defense, Others) And Competitive Landscape
| Product Code: ETC008858 | Publication Date: Jun 2023 | Product Type: Report | ||
| Publisher: 6Wresearch | Author: Ravi Bhandari | No. of Pages: 70 | No. of Figures: 35 | No. of Tables: 5 |
Romania Molybdenum Market Summary
The romania molybdenum market was estimated at USD 328 Million in 2025 and is projected to reach USD 443 Million by 2032, growing at a CAGR of 5.3% from 2026 to 2032.
Romania Molybdenum Market Year-wise Growth Rate and Key Drivers
This graph highlights how the Romania Molybdenum Market has steadily grown over the past five years, supported by major growth factors.
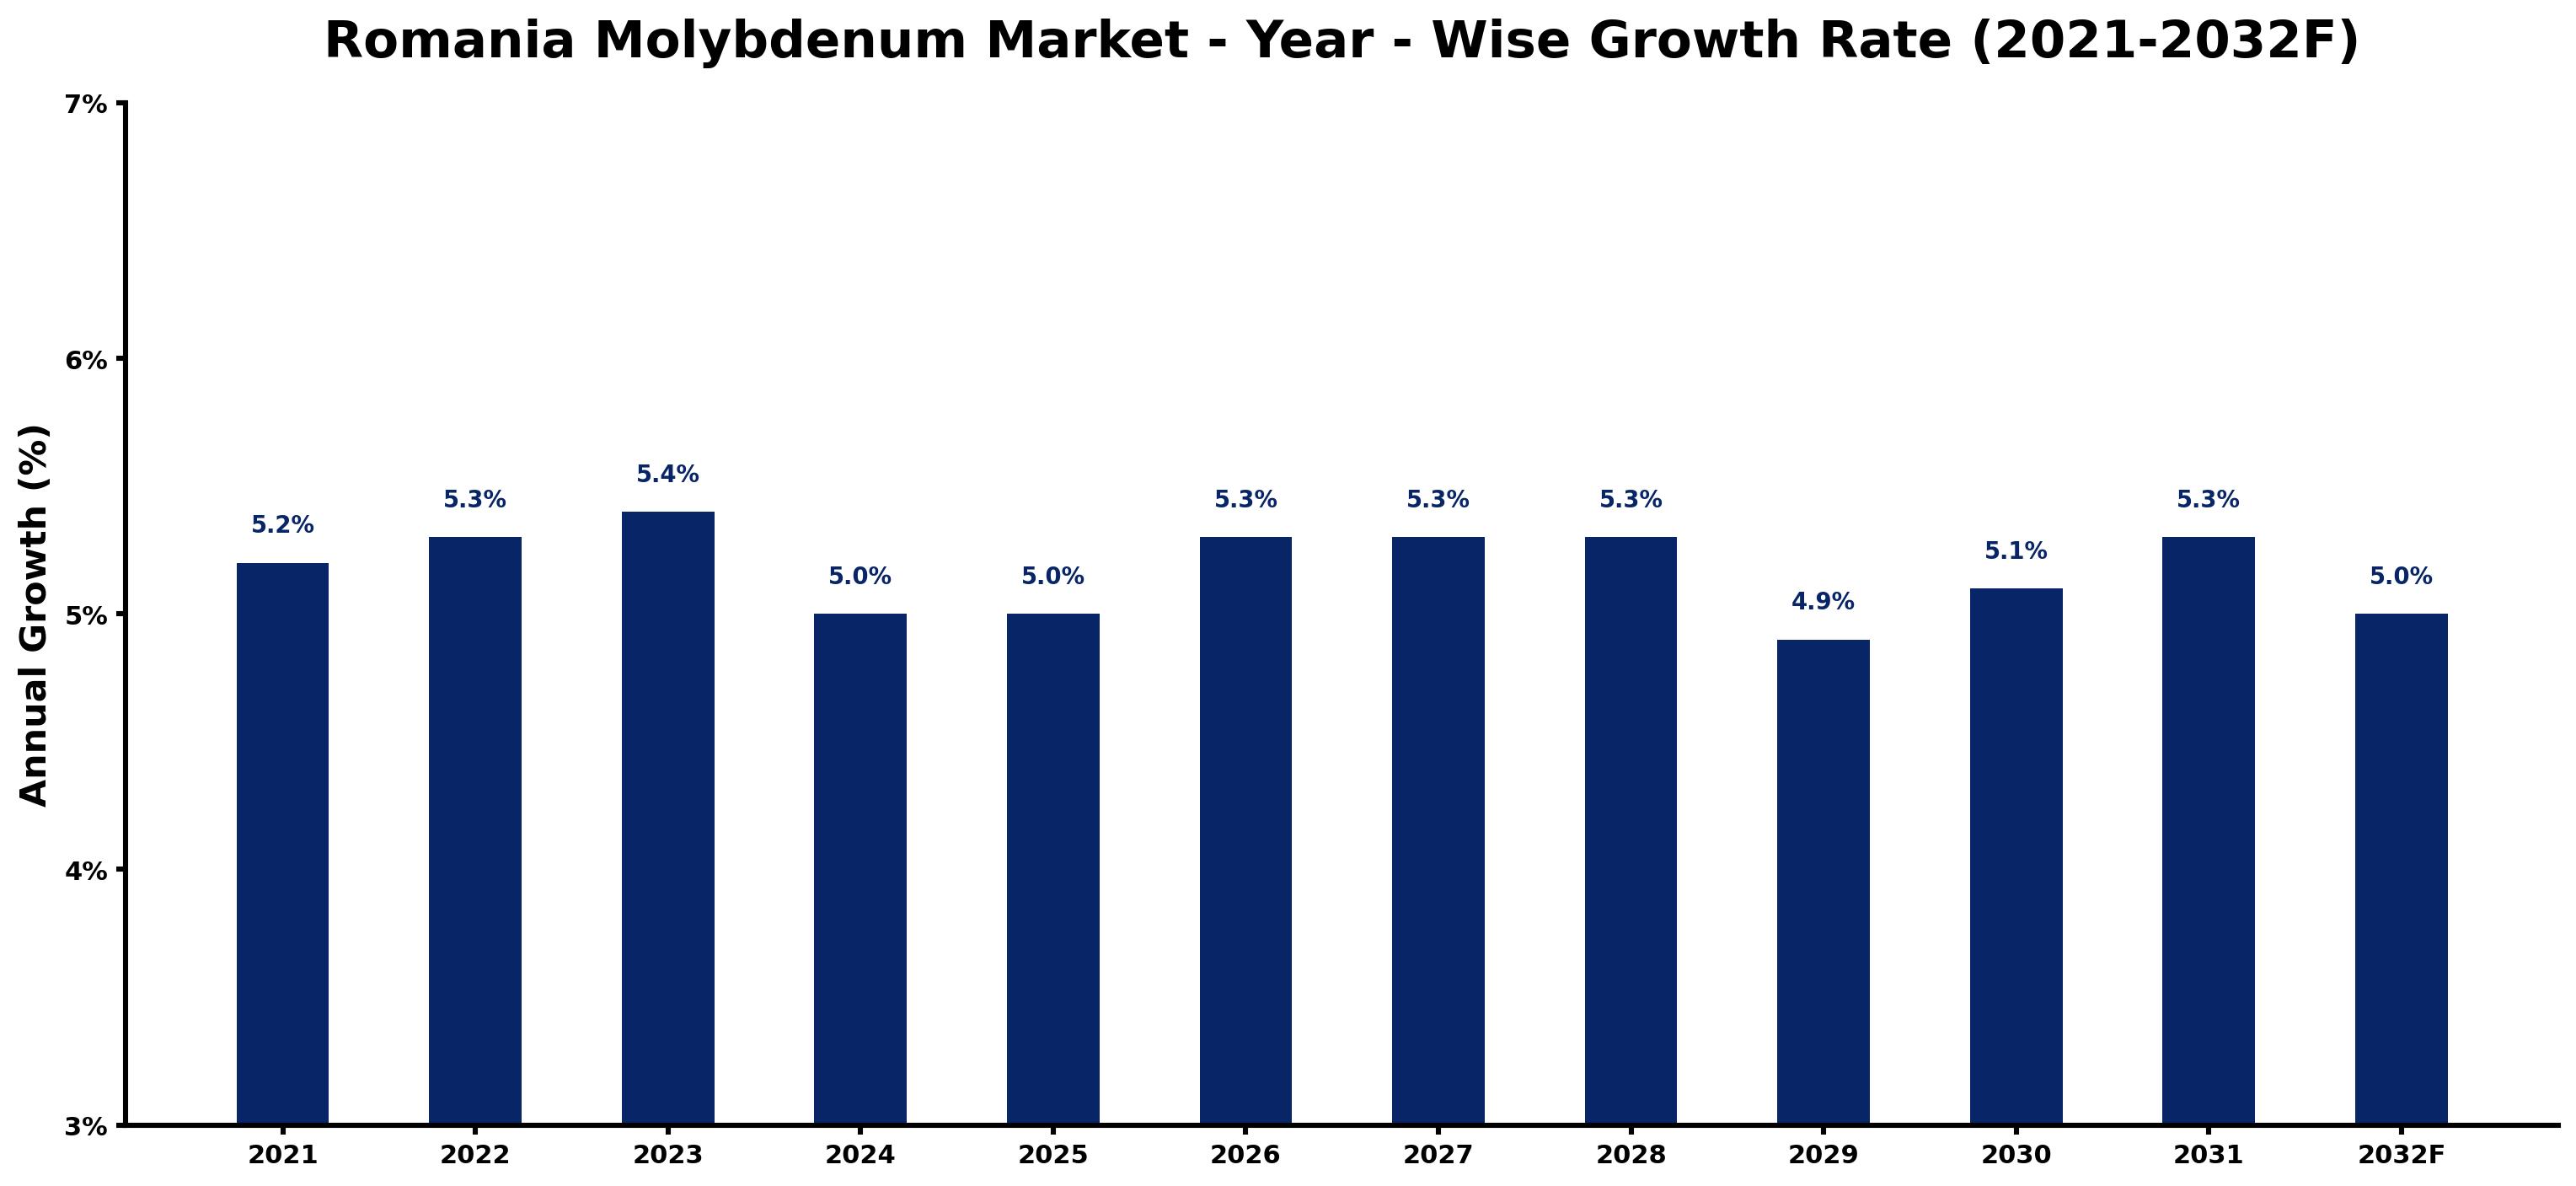
The table below presents the year wise growth rates along with the key drivers influencing the market
| Year | Growth Rate | Major Drivers |
| 2021 | 5.2% | The molybdenum market in Romania began stabilizing after pandemic disruptions. |
| 2022 | 5.3% | Local industries started emphasizing molybdenum's role in advanced steel production. |
| 2023 | 5.4% | Increased infrastructure projects highlighted the need for high-performance materials like molybdenum. |
| 2024 | 5.0% | Romania's focus on technological improvements boosted molybdenum demand in manufacturing sectors. |
| 2025 | 5.0% | Investment in green technologies integrated molybdenum for sustainable energy solutions. |
| 2026 | 5.3% | Emerging automotive technologies required higher molybdenum content for durability and efficiency. |
| 2027 | 5.3% | Increased collaboration between local miners and manufacturers enhanced supply chain efficiencies. |
| 2028 | 5.3% | Rising environmental awareness influenced molybdenum's usage in eco-friendly construction materials. |
| 2029 | 4.9% | Technological innovations in extraction processes improved molybdenum yield and cost-effectiveness. |
| 2030 | 5.1% | Romania's economic growth necessitated more advanced alloys in various industrial applications. |
| 2031 | 5.3% | Regional partnerships opened new markets for Romanian molybdenum exporters in Europe. |
| 2032 | 5.0% | Forecasts indicated that demand for molybdenum would consistently increase across industrial sectors. |
Note - Market size estimations and growth projections presented in this report are based on 6Wresearch's advanced forecasting approach, validated with industry datasets as of June 2026.
Romania Molybdenum Market Synopsis
The Romania Molybdenum Market is projected to reach 5.3% and witness significant growth during the forecast period (2026-2032). This growth is anticipated to be driven primarily by increasing demand from emerging economies and robust construction activities within Romania. As the country focuses on infrastructure development, the molybdenum industry stands to benefit significantly from both public and private sector investments.
Romania Molybdenum Market Growth Drivers
Key factors driving the growth of the Romania Molybdenum Market include:
- Demand for molybdenum in various sectors, especially automotive and aerospace, where its properties such as corrosion resistance and strength provide distinct advantages.
- Increased construction activities in Romania as part of national modernization efforts, necessitating the use of high-performance materials.
- Growing investments in infrastructure projects endorsed by the government, aimed at improving the overall quality of public services and facilities.
- Rising awareness about the benefits of molybdenum in enhancing the performance and durability of both commercial and residential structures.
- Strengthening ties with emerging economies that are becoming significant consumers of molybdenum, consequently expanding the market opportunities.
Romania Molybdenum Market Trends and Opportunities
The Romania Molybdenum Market is witnessing various trends that indicate promising opportunities for growth. Notable trends include:
- A shift towards sustainable construction practices, prompting the adoption of molybdenum due to its environmentally friendly characteristics.
- Increased technological advancements in processing techniques, enhancing the overall efficiency of molybdenum extraction and utilization.
- Emphasis on research and development to explore new applications for molybdenum in high-tech industries, potentially broadening its market base.
- Growing focus on developing strong international trade relations that may lead to increased exports of molybdenum, thus elevating Romania's position in the global market.
- The emergence of partnerships between public and private sectors aimed at developing local molybdenum supply chains, ensuring stability and cost-effectiveness.
Romania Molybdenum Market Challenges and Restraints
Despite the growth potential, the Romania Molybdenum Market faces certain challenges that may hinder its progress:
- High costs associated with the extraction and processing of molybdenum, which could limit profitability for stakeholders involved.
- Stringent environmental regulations that necessitate compliance and investment in eco-friendly technologies, potentially delaying project timelines.
- Fluctuations in global molybdenum prices, influenced by supply-demand dynamics, which may impact local market conditions.
- Competition from alternative materials that offer similar benefits, leading to a potential decrease in molybdenum's market share.
- Market dependency on economic recovery patterns in key industries, which can lead to instability in demand under fluctuating economic conditions.
Romania Molybdenum Market Government Investment and Initiatives
The Romanian government is actively involved in fostering a conducive environment for the molybdenum industry through various investment initiatives:
- Implementation of infrastructure development plans focused on modernization, which indirectly boosts the demand for molybdenum.
- Incentives for private sector investments in mining and metallurgy sectors to ensure the sustainability of raw material supply.
- Commitment to enhancing environmental protection laws while promoting the use of advanced technologies in molybdenum production.
- Government-led public-private partnerships aimed at enhancing resource efficiency and reducing production costs.
- Support for research programs that seek to innovate and identify new applications for molybdenum in contemporary industries.
Romania Molybdenum Market Latest Developments (May 2025 - June 2026)
During the period from May 2025 to June 2026, the Romania Molybdenum Market has experienced several notable developments. There has been increased collaboration among industry stakeholders aimed at streamlining production processes to improve efficiency. Public initiatives towards enhancing the resilience of infrastructure showcased a strong focus on utilizing durable materials, including molybdenum. Moreover, environmental regulations were reassessed, prompting many companies to adapt their operations accordingly. The exploration of advanced materials applications gained traction, reflecting a shift towards innovation in the sector. Overall, these developments highlight a proactive approach to addressing both market demands and sustainability considerations.
Romania Molybdenum Market - Key Attractiveness of the Report
- 10 Years of Market Numbers
- Historical Data Starting from 2022 to 2025
- Base Year: 2025
- Forecast Data until 2032
- Key Performance Indicators Impacting the Market
- Major Upcoming Developments and Projects
Key Highlights of the Report:
- Romania Molybdenum Market Outlook
- Market Size of Romania Molybdenum Market, 2025
- Forecast of Romania Molybdenum Market, 2032F
- Historical Data and Forecast of Romania Molybdenum Revenues & Volume for the Period 2022-2032F
- Romania Molybdenum Market Trend Evolution
- Romania Molybdenum Market Drivers and Challenges
- Romania Molybdenum Price Trends
- Romania Molybdenum Porter's Five Forces
- Romania Molybdenum Industry Life Cycle
- Historical Data and Forecast of Romania Molybdenum Market Revenues & Volume By Product Types for the Period 2022-2032F
- Historical Data and Forecast of Romania Molybdenum Market Revenues & Volume By Steel for the Period 2022-2032F
- Historical Data and Forecast of Romania Molybdenum Market Revenues & Volume By Chemical for the Period 2022-2032F
- Historical Data and Forecast of Romania Molybdenum Market Revenues & Volume By Foundry for the Period 2022-2032F
- Historical Data and Forecast of Romania Molybdenum Market Revenues & Volume By MO-Metal for the Period 2022-2032F
- Historical Data and Forecast of Romania Molybdenum Market Revenues & Volume By Nickel Alloy for the Period 2022-2032F
- Historical Data and Forecast of Romania Molybdenum Market Revenues & Volume By Others for the Period 2022-2032F
- Historical Data and Forecast of Romania Molybdenum Market Revenues & Volume By End-users for the Period 2022-2032F
- Historical Data and Forecast of Romania Molybdenum Market Revenues & Volume By Oil and Gas for the Period 2022-2032F
- Historical Data and Forecast of Romania Molybdenum Market Revenues & Volume By Chemical and Petrochemical for the Period 2022-2032F
- Historical Data and Forecast of Romania Molybdenum Market Revenues & Volume By Automotive for the Period 2022-2032F
- Historical Data and Forecast of Romania Molybdenum Market Revenues & Volume By Industrial Usage for the Period 2022-2032F
- Historical Data and Forecast of Romania Molybdenum Market Revenues & Volume By Building and Construction for the Period 2022-2032F
- Historical Data and Forecast of Romania Molybdenum Market Revenues & Volume By Aerospace and Defense for the Period 2022-2032F
- Historical Data and Forecast of Romania Molybdenum Market Revenues & Volume By Others for the Period 2022-2032F
- Romania Molybdenum Import Export Trade Statistics
- Market Opportunity Assessment By Product Types
- Market Opportunity Assessment By End-users
- Romania Molybdenum Top Companies Market Share
- Romania Molybdenum Competitive Benchmarking By Technical and Operational Parameters
- Romania Molybdenum Company Profiles
- Romania Molybdenum Key Strategic Recommendations
Frequently Asked Questions About the Market Study (FAQs):
The Romania Molybdenum Market is projected to register a CAGR of 3.4% during the forecast period of 2026-2032.
The automotive and aerospace industries are the largest consumers of molybdenum, leveraging its superior characteristics for their applications.
Challenges include the high cost of raw materials, stringent environmental regulations, and competition from alternative materials.
The government is supporting the industry through infrastructure investment, incentives for private sector engagement, and facilitating public-private partnerships.
6Wresearch actively monitors the Romania Molybdenum Market and publishes its comprehensive annual report, highlighting emerging trends, growth drivers, revenue analysis, and forecast outlook. Our insights help businesses to make data-backed strategic decisions with ongoing market dynamics. Our analysts track relevent industries related to the Romania Molybdenum Market, allowing our clients with actionable intelligence and reliable forecasts tailored to emerging regional needs.
Yes, we provide customisation as per your requirements. To learn more, feel free to contact us on sales@6wresearch.com
1 Executive Summary |
2 Introduction |
2.1 Key Highlights of the Report |
2.2 Report Description |
2.3 Market Scope & Segmentation |
2.4 Research Methodology |
2.5 Assumptions |
3 Romania Molybdenum Market Overview |
3.1 Romania Country Macro Economic Indicators |
3.2 Romania Molybdenum Market Revenues & Volume, 2022 & 2032F |
3.3 Romania Molybdenum Market - Industry Life Cycle |
3.4 Romania Molybdenum Market - Porter's Five Forces |
3.5 Romania Molybdenum Market Revenues & Volume Share, By Product Types, 2022 & 2032F |
3.6 Romania Molybdenum Market Revenues & Volume Share, By End-users, 2022 & 2032F |
4 Romania Molybdenum Market Dynamics |
4.1 Impact Analysis |
4.2 Market Drivers |
4.3 Market Restraints |
5 Romania Molybdenum Market Trends |
6 Romania Molybdenum Market, By Types |
6.1 Romania Molybdenum Market, By Product Types |
6.1.1 Overview and Analysis |
6.1.2 Romania Molybdenum Market Revenues & Volume, By Product Types, 2022-2032F |
6.1.3 Romania Molybdenum Market Revenues & Volume, By Steel, 2022-2032F |
6.1.4 Romania Molybdenum Market Revenues & Volume, By Chemical, 2022-2032F |
6.1.5 Romania Molybdenum Market Revenues & Volume, By Foundry, 2022-2032F |
6.1.6 Romania Molybdenum Market Revenues & Volume, By MO-Metal, 2022-2032F |
6.1.7 Romania Molybdenum Market Revenues & Volume, By Nickel Alloy, 2022-2032F |
6.1.8 Romania Molybdenum Market Revenues & Volume, By Others, 2022-2032F |
6.2 Romania Molybdenum Market, By End-users |
6.2.1 Overview and Analysis |
6.2.2 Romania Molybdenum Market Revenues & Volume, By Oil and Gas, 2022-2032F |
6.2.3 Romania Molybdenum Market Revenues & Volume, By Chemical and Petrochemical, 2022-2032F |
6.2.4 Romania Molybdenum Market Revenues & Volume, By Automotive, 2022-2032F |
6.2.5 Romania Molybdenum Market Revenues & Volume, By Industrial Usage, 2022-2032F |
6.2.6 Romania Molybdenum Market Revenues & Volume, By Building and Construction, 2022-2032F |
6.2.7 Romania Molybdenum Market Revenues & Volume, By Aerospace and Defense, 2022-2032F |
7 Romania Molybdenum Market Import-Export Trade Statistics |
7.1 Romania Molybdenum Market Export to Major Countries |
7.2 Romania Molybdenum Market Imports from Major Countries |
8 Romania Molybdenum Market Key Performance Indicators |
9 Romania Molybdenum Market - Opportunity Assessment |
9.1 Romania Molybdenum Market Opportunity Assessment, By Product Types, 2022 & 2032F |
9.2 Romania Molybdenum Market Opportunity Assessment, By End-users, 2022 & 2032F |
10 Romania Molybdenum Market - Competitive Landscape |
10.1 Romania Molybdenum Market Revenue Share, By Companies, 2025 |
10.2 Romania Molybdenum Market Competitive Benchmarking, By Operating and Technical Parameters |
11 Company Profiles |
12 Recommendations |
13 Disclaimer |
Global Go To Market Strategy - 2030
Export potential enables firms to identify high-growth global markets with greater confidence by combining advanced trade intelligence with a structured quantitative methodology. The framework analyzes emerging demand trends and country-level import patterns while integrating macroeconomic and trade datasets such as GDP and population forecasts, bilateral import–export flows, tariff structures, elasticity differentials between developed and developing economies, geographic distance, and import demand projections. Using weighted trade values from 2020–2024 as the base period to project country-to-country export potential for 2030, these inputs are operationalized through calculated drivers such as gravity model parameters, tariff impact factors, and projected GDP per-capita growth. Through an analysis of hidden potentials, demand hotspots, and market conditions that are most favorable to success, this method enables firms to focus on target countries, maximize returns, and global expansion with data, backed by accuracy.
By factoring in the projected importer demand gap that is currently unmet and could be potential opportunity, it identifies the potential for the Exporter (Country) among 190 countries, against the general trade analysis, which identifies the biggest importer or exporter.
To discover high-growth global markets and optimize your business strategy:
Click Here
Pricing
- Single User License$ 1,995
- Department License$ 2,400
- Site License$ 3,120
- Global License$ 3,795

Leadership Perspectives from Industry Events
Search
Thought Leadership and Analyst Meet


Our Clients
6WResearch In News
- India Air Conditioner Market Set for Strong Rebound in 2026 After Weather-Led Correction and GST-Driven Recovery: 6Wresearch
- ADAS in India: How Automatic Emergency Braking, Blind Spot Detection & Driver Monitoring are Transforming Road Safety
- Doha a strategic location for EV manufacturing hub: IPA Qatar
- Demand for luxury TVs surging in the GCC, says Samsung
- Empowering Growth: The Thriving Journey of Bangladesh’s Cable Industry
- Demand for luxury TVs surging in the GCC, says Samsung
Latest Reports
- Nicaragua RPG Gaming Market (2026-2032)
- New Zealand RPG Gaming Market (2026-2032)
- Netherlands RPG Gaming Market (2026-2032)
- Nauru RPG Gaming Market (2026-2032)
- Namibia RPG Gaming Market (2026-2032)
- Mozambique RPG Gaming Market (2026-2032)
- Montenegro RPG Gaming Market (2026-2032)
- Mongolia RPG Gaming Market (2026-2032)
- Monaco RPG Gaming Market (2026-2032)
- Micronesia RPG Gaming Market (2026-2032)
Industry Events and Analyst Meet

EV India Expo 2026

HIMTEX 2026

India Refining Summit 2026

India EV Show 2026

EV tech India Expo 2026
Whitepaper
- Middle East & Africa Commercial Security Market Click here to view more.
- Middle East & Africa Fire Safety Systems & Equipment Market Click here to view more.
- GCC Drone Market Click here to view more.
- Middle East Lighting Fixture Market Click here to view more.
- GCC Physical & Perimeter Security Market Click here to view more.