Romania Rare Earth & Products Market (2026-2032) | Forecast, Industry, Outlook, Size, Revenue, Companies, Trends, Growth, Analysis, Share & Value
Market Forecast By Product Types (Cerium, Dysprosium, Erbium, Europium, Gadolinium, Holmium, Lanthanum, Others), By Applications (Magnets, Catalysts, Metallurgy, Polishing, Glass, Phosphors, Ceramics, Others) And Competitive Landscape
| Product Code: ETC008738 | Publication Date: Oct 2020 | Updated Date: Apr 2026 | Product Type: Report | |
| Publisher: 6Wresearch | Author: Ravi Bhandari | No. of Pages: 70 | No. of Figures: 35 | No. of Tables: 5 |
Romania Rare Earth & Products Market Size (2020-2030)
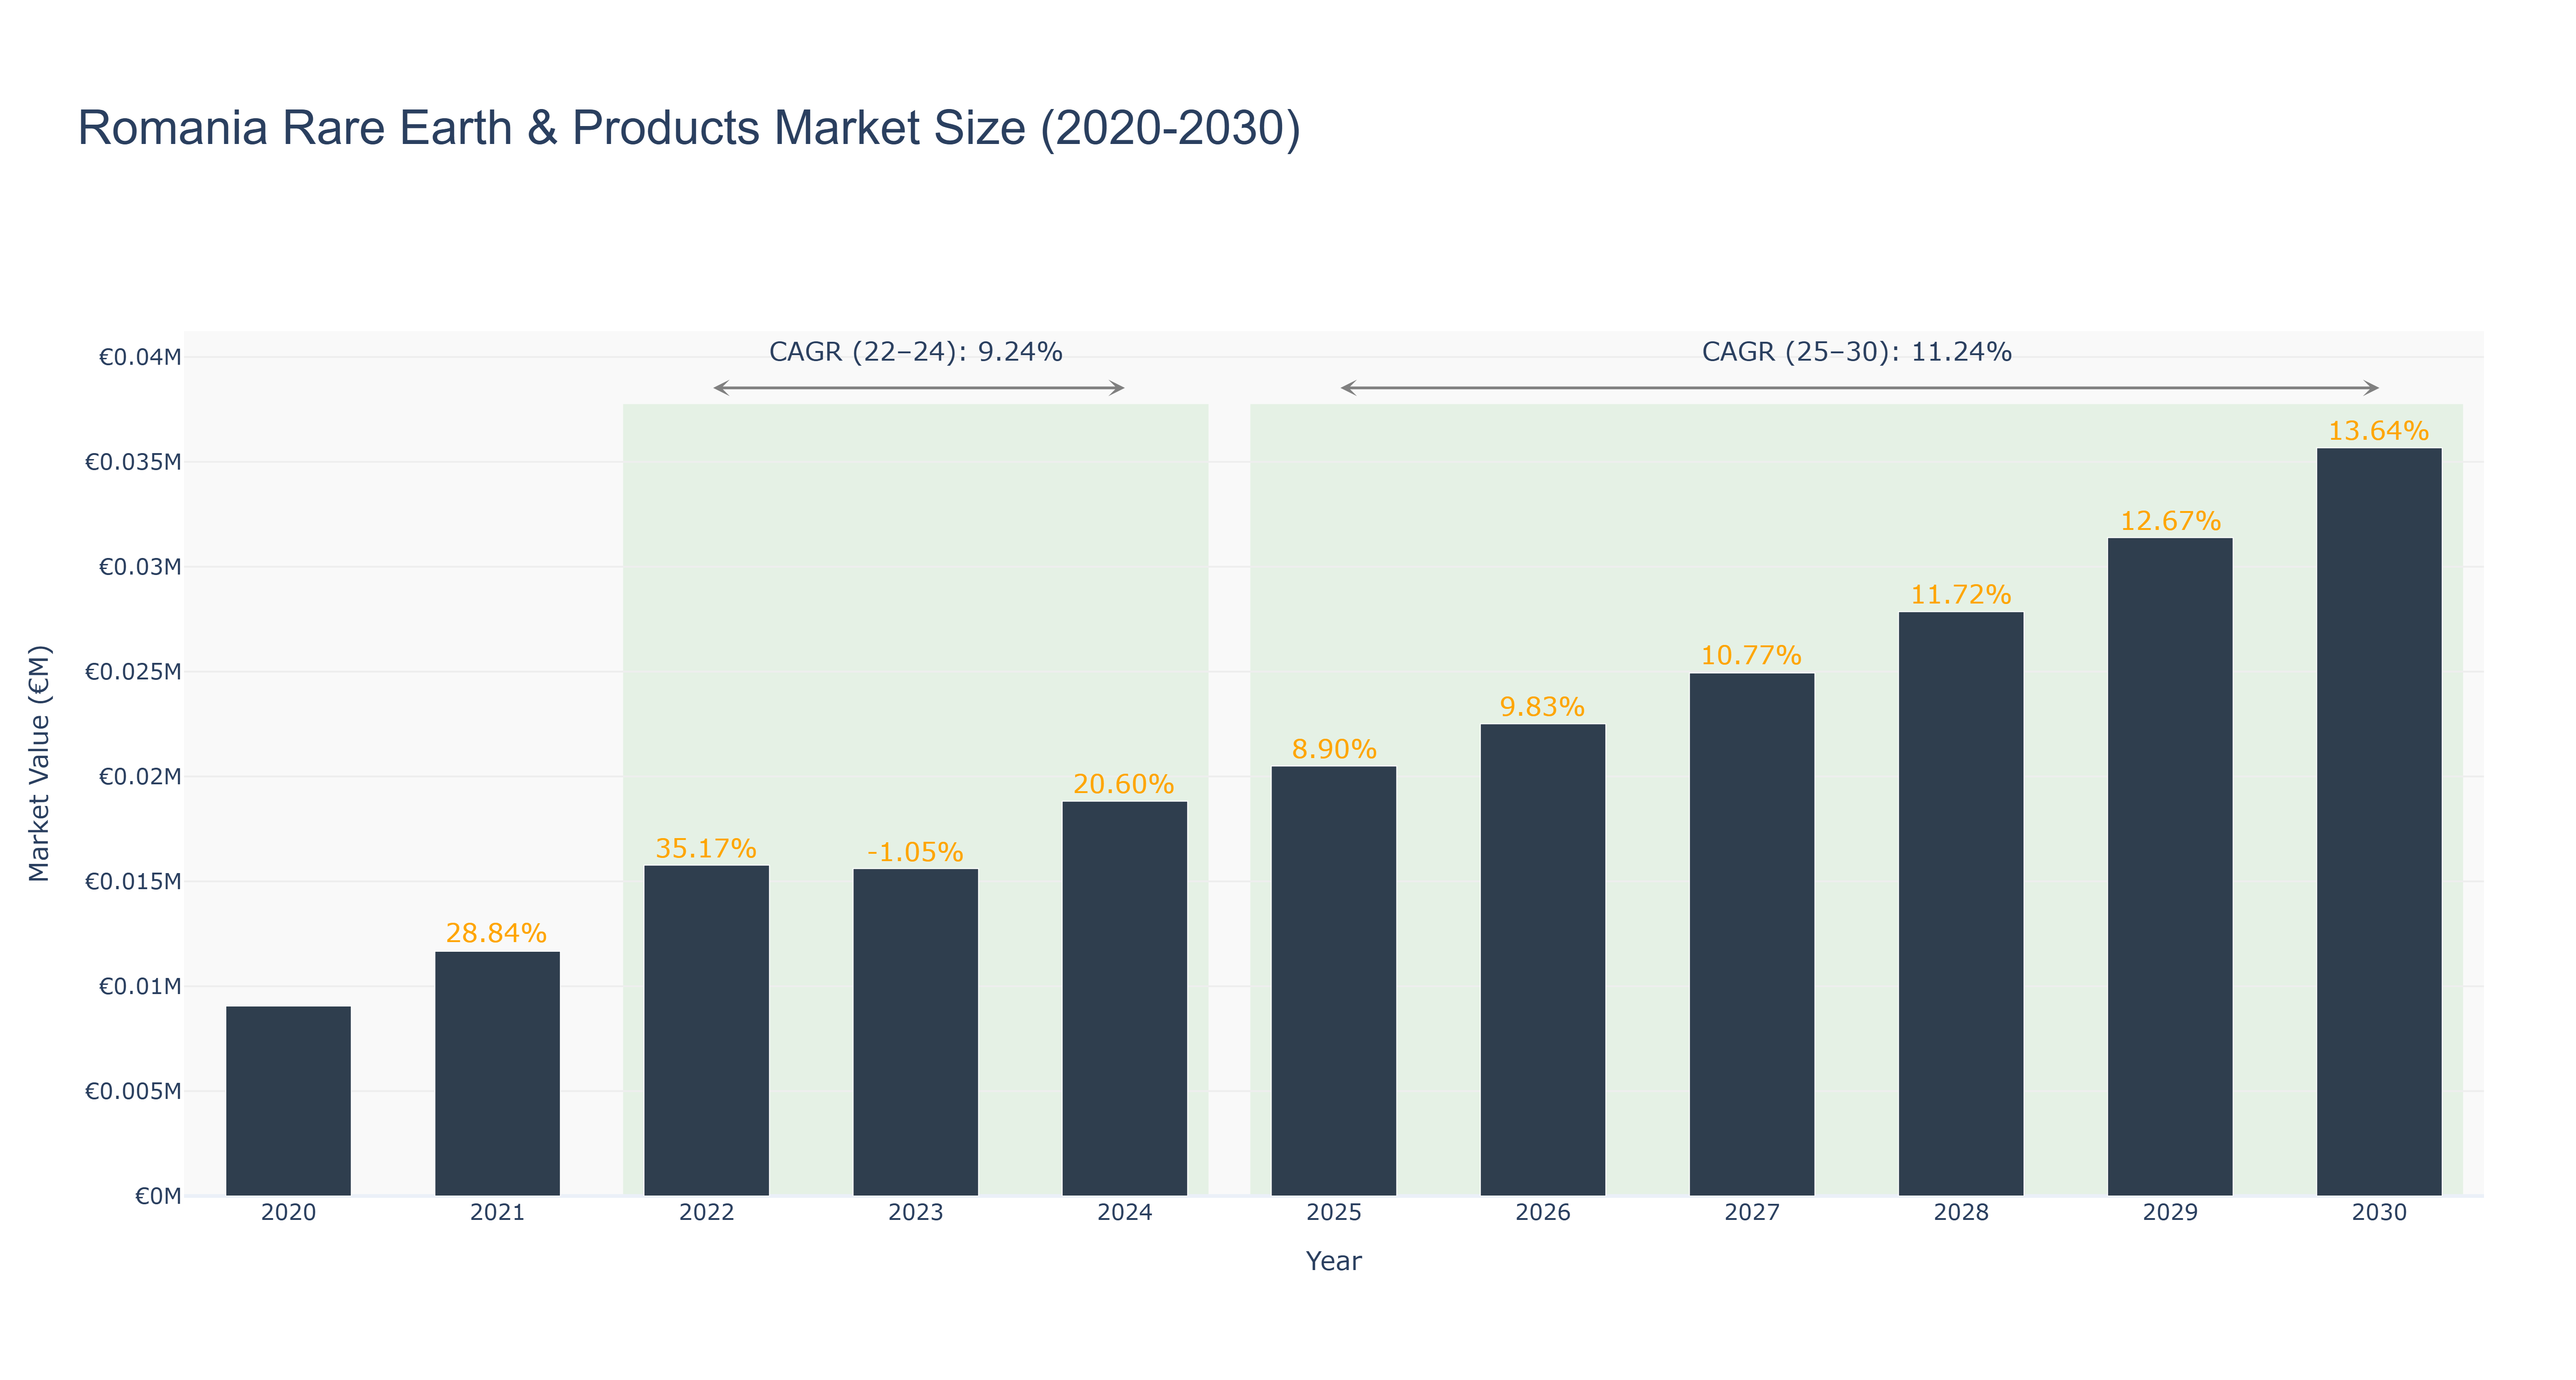
The Romania Rare Earth & Products Market has shown steady growth over the years. The market peaked at €0.04 million in 2030, with a consistent increase in size from €0.01 million in 2020. The growth rates have fluctuated, with a notable spike in 2022 at 35.17% followed by a slight decline in 2023 at -1.05%. The market has maintained positive growth trends, with a CAGR of 9.24% from 2022 to 2024 and a projected CAGR of 11.24% from 2025 to 2030. The growth can be attributed to increasing demand for rare earth materials in various industries, driving market expansion. Looking ahead, Romania is set to launch a new rare earth mining project in collaboration with international partners, further boosting the market's growth potential. Industry drivers include advancements in technology requiring rare earth elements, growing environmental concerns leading to the adoption of green technologies, and increasing demand for electric vehicles and renewable energy sources. Future developments in the Romania Rare Earth & Products Market include the establishment of a new processing facility to enhance production capacity and meet growing market demands.
Romania Rare Earth & Products Market: Production & Trade Performance (2019-2025)
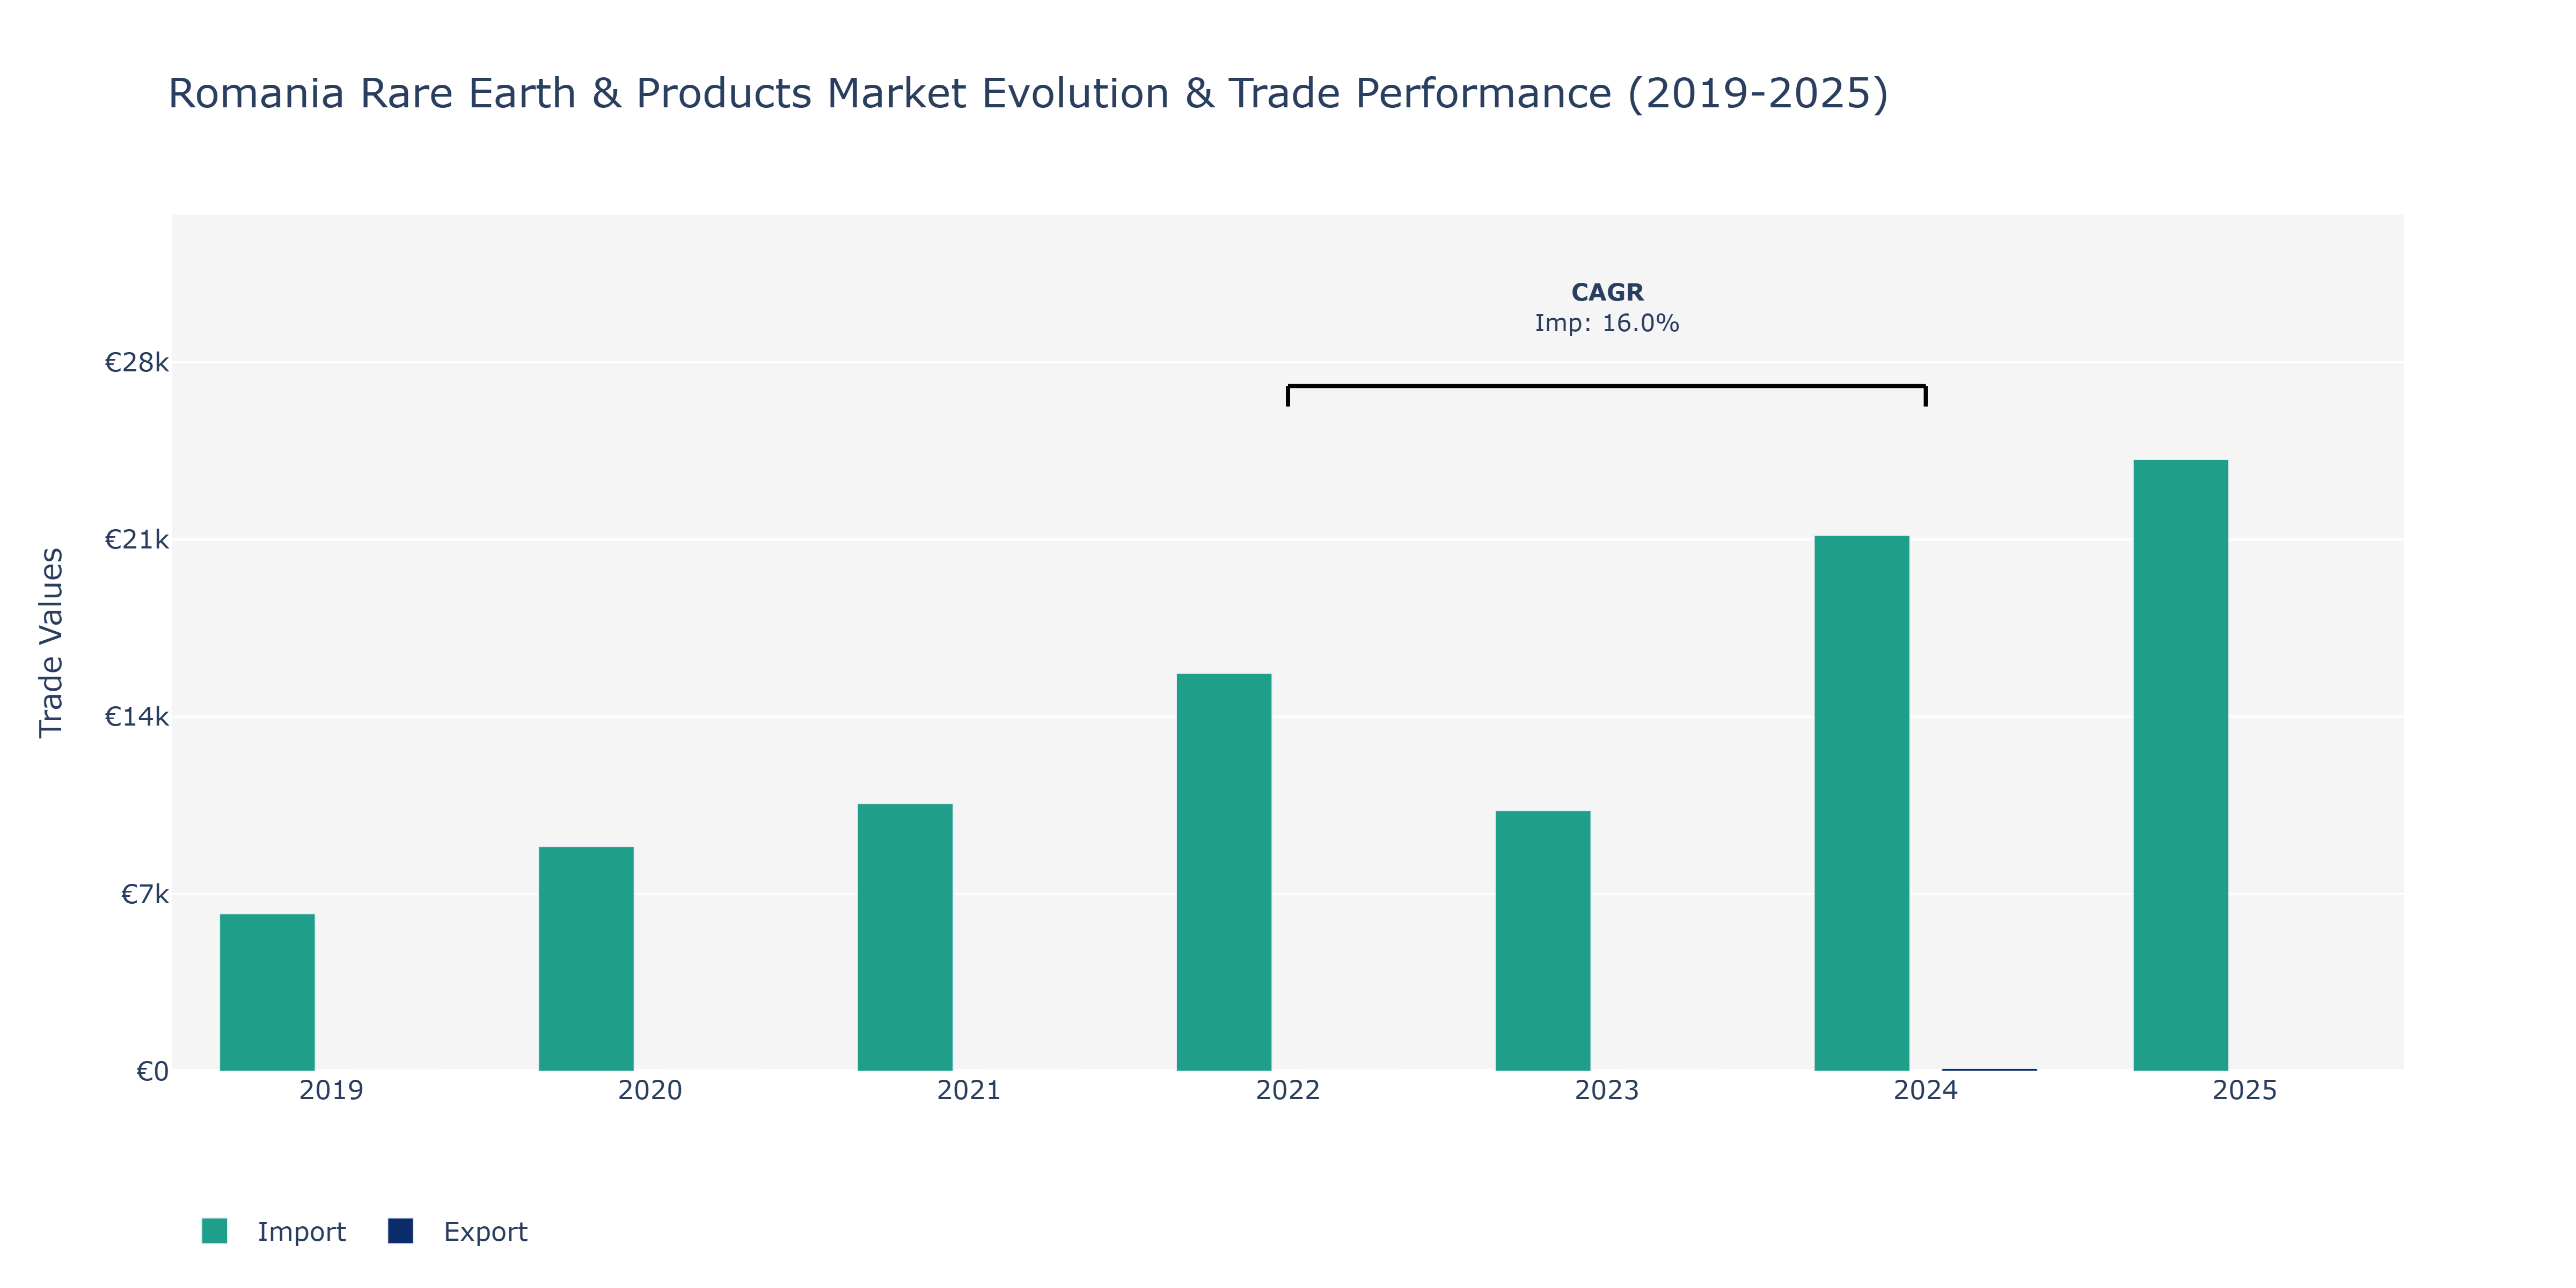
The Romania Rare Earth & Products Market witnessed notable fluctuations in Imports during the period under review. In 2019, Imports stood at €6.22 thousand, marking the starting point for a series of increases over the following years. The trend accelerated significantly in 2022, with Imports reaching €15.72 thousand, representing a peak point during the period. However, the market experienced a sharp downturn in 2023, dropping to €10.3 thousand before recovering slightly to €24.17 thousand in 2025. In contrast, Exports were relatively low, with only €0.11 billion reported in 2024. The substantial increase in Imports in 2022 can be attributed to growing demand for rare earth elements in various industries, such as electronics, renewable energy, and automotive sectors. The subsequent decline in 2023 may be linked to global economic uncertainties impacting trade flows. The resurgence in 2025 could indicate renewed market confidence and strategic initiatives to boost imports.
Key Highlights of the Report:
- Romania Rare Earth & Products Market Outlook
- Market Size of Romania Rare Earth & Products Market, 2025
- Forecast of Romania Rare Earth & Products Market, 2032
- Historical Data and Forecast of Romania Rare Earth & Products Revenues & Volume for the Period 2022-2032F
- Romania Rare Earth & Products Market Trend Evolution
- Romania Rare Earth & Products Market Drivers and Challenges
- Romania Rare Earth & Products Price Trends
- Romania Rare Earth & Products Porter's Five Forces
- Romania Rare Earth & Products Industry Life Cycle
- Historical Data and Forecast of Romania Rare Earth & Products Market Revenues & Volume By Product Types for the Period 2022-2032F
- Historical Data and Forecast of Romania Rare Earth & Products Market Revenues & Volume By Cerium for the Period 2022-2032F
- Historical Data and Forecast of Romania Rare Earth & Products Market Revenues & Volume By Dysprosium for the Period 2022-2032F
- Historical Data and Forecast of Romania Rare Earth & Products Market Revenues & Volume By Erbium for the Period 2022-2032F
- Historical Data and Forecast of Romania Rare Earth & Products Market Revenues & Volume By Europium for the Period 2022-2032F
- Historical Data and Forecast of Romania Rare Earth & Products Market Revenues & Volume By Gadolinium for the Period 2022-2032F
- Historical Data and Forecast of Romania Rare Earth & Products Market Revenues & Volume By Holmium for the Period 2022-2032F
- Historical Data and Forecast of Romania Rare Earth & Products Market Revenues & Volume By Lanthanum for the Period 2022-2032F
- Historical Data and Forecast of Romania Cerium Rare Earth & Products Market Revenues & Volume By Others for the Period 2022-2032F
- Historical Data and Forecast of Romania Rare Earth & Products Market Revenues & Volume By Applications for the Period 2022-2032F
- Historical Data and Forecast of Romania Rare Earth & Products Market Revenues & Volume By Magnets for the Period 2022-2032F
- Historical Data and Forecast of Romania Rare Earth & Products Market Revenues & Volume By Catalysts for the Period 2022-2032F
- Historical Data and Forecast of Romania Rare Earth & Products Market Revenues & Volume By Metallurgy for the Period 2022-2032F
- Historical Data and Forecast of Romania Rare Earth & Products Market Revenues & Volume By Polishing for the Period 2022-2032F
- Historical Data and Forecast of Romania Rare Earth & Products Market Revenues & Volume By Glass for the Period 2022-2032F
- Historical Data and Forecast of Romania Rare Earth & Products Market Revenues & Volume By Phosphors for the Period 2022-2032F
- Historical Data and Forecast of Romania Rare Earth & Products Market Revenues & Volume By Ceramics for the Period 2022-2032F
- Historical Data and Forecast of Romania Rare Earth & Products Market Revenues & Volume By Others for the Period 2022-2032F
- Romania Rare Earth & Products Import Export Trade Statistics
- Market Opportunity Assessment By Product Types
- Market Opportunity Assessment By Applications
- Romania Rare Earth & Products Top Companies Market Share
- Romania Rare Earth & Products Competitive Benchmarking By Technical and Operational Parameters
- Romania Rare Earth & Products Company Profiles
- Romania Rare Earth & Products Key Strategic Recommendations
Frequently Asked Questions About the Market Study (FAQs):
6Wresearch actively monitors the Romania Rare Earth & Products Market and publishes its comprehensive annual report, highlighting emerging trends, growth drivers, revenue analysis, and forecast outlook. Our insights help businesses to make data-backed strategic decisions with ongoing market dynamics. Our analysts track relevent industries related to the Romania Rare Earth & Products Market, allowing our clients with actionable intelligence and reliable forecasts tailored to emerging regional needs.
Yes, we provide customisation as per your requirements. To learn more, feel free to contact us on sales@6wresearch.com
1 Executive Summary |
2 Introduction |
2.1 Key Highlights of the Report |
2.2 Report Description |
2.3 Market Scope & Segmentation |
2.4 Research Methodology |
2.5 Assumptions |
3 Romania Rare Earth & Products Market Overview |
3.1 Romania Country Macro Economic Indicators |
3.2 Romania Rare Earth & Products Market Revenues & Volume, 2022 & 2032F |
3.3 Romania Rare Earth & Products Market - Industry Life Cycle |
3.4 Romania Rare Earth & Products Market - Porter's Five Forces |
3.5 Romania Rare Earth & Products Market Revenues & Volume Share, By Product Types, 2022 & 2032F |
3.6 Romania Rare Earth & Products Market Revenues & Volume Share, By Applications, 2022 & 2032F |
4 Romania Rare Earth & Products Market Dynamics |
4.1 Impact Analysis |
4.2 Market Drivers |
4.3 Market Restraints |
5 Romania Rare Earth & Products Market Trends |
6 Romania Rare Earth & Products Market, By Types |
6.1 Romania Rare Earth & Products Market, By Product Types |
6.1.1 Overview and Analysis |
6.1.2 Romania Rare Earth & Products Market Revenues & Volume, By Product Types, 2022 - 2032F |
6.1.3 Romania Rare Earth & Products Market Revenues & Volume, By Cerium, 2022 - 2032F |
6.1.4 Romania Rare Earth & Products Market Revenues & Volume, By Dysprosium, 2022 - 2032F |
6.1.5 Romania Rare Earth & Products Market Revenues & Volume, By Erbium, 2022 - 2032F |
6.1.6 Romania Rare Earth & Products Market Revenues & Volume, By Europium, 2022 - 2032F |
6.1.7 Romania Rare Earth & Products Market Revenues & Volume, By Gadolinium, 2022 - 2032F |
6.1.8 Romania Rare Earth & Products Market Revenues & Volume, By Holmium, 2022 - 2032F |
6.1.9 Romania Rare Earth & Products Market Revenues & Volume, By Others, 2022 - 2032F |
6.1.10 Romania Rare Earth & Products Market Revenues & Volume, By Others, 2022 - 2032F |
6.2 Romania Rare Earth & Products Market, By Applications |
6.2.1 Overview and Analysis |
6.2.2 Romania Rare Earth & Products Market Revenues & Volume, By Magnets, 2022 - 2032F |
6.2.3 Romania Rare Earth & Products Market Revenues & Volume, By Catalysts, 2022 - 2032F |
6.2.4 Romania Rare Earth & Products Market Revenues & Volume, By Metallurgy, 2022 - 2032F |
6.2.5 Romania Rare Earth & Products Market Revenues & Volume, By Polishing, 2022 - 2032F |
6.2.6 Romania Rare Earth & Products Market Revenues & Volume, By Glass, 2022 - 2032F |
6.2.7 Romania Rare Earth & Products Market Revenues & Volume, By Phosphors, 2022 - 2032F |
6.2.8 Romania Rare Earth & Products Market Revenues & Volume, By Others, 2022 - 2032F |
6.2.9 Romania Rare Earth & Products Market Revenues & Volume, By Others, 2022 - 2032F |
7 Romania Rare Earth & Products Market Import-Export Trade Statistics |
7.1 Romania Rare Earth & Products Market Export to Major Countries |
7.2 Romania Rare Earth & Products Market Imports from Major Countries |
8 Romania Rare Earth & Products Market Key Performance Indicators |
9 Romania Rare Earth & Products Market - Opportunity Assessment |
9.1 Romania Rare Earth & Products Market Opportunity Assessment, By Product Types, 2022 & 2032F |
9.2 Romania Rare Earth & Products Market Opportunity Assessment, By Applications, 2022 & 2032F |
10 Romania Rare Earth & Products Market - Competitive Landscape |
10.1 Romania Rare Earth & Products Market Revenue Share, By Companies, 2025 |
10.2 Romania Rare Earth & Products Market Competitive Benchmarking, By Operating and Technical Parameters |
11 Company Profiles |
12 Recommendations |
13 Disclaimer |
Global Go To Market Strategy - 2030
Export potential enables firms to identify high-growth global markets with greater confidence by combining advanced trade intelligence with a structured quantitative methodology. The framework analyzes emerging demand trends and country-level import patterns while integrating macroeconomic and trade datasets such as GDP and population forecasts, bilateral import–export flows, tariff structures, elasticity differentials between developed and developing economies, geographic distance, and import demand projections. Using weighted trade values from 2020–2024 as the base period to project country-to-country export potential for 2030, these inputs are operationalized through calculated drivers such as gravity model parameters, tariff impact factors, and projected GDP per-capita growth. Through an analysis of hidden potentials, demand hotspots, and market conditions that are most favorable to success, this method enables firms to focus on target countries, maximize returns, and global expansion with data, backed by accuracy.
By factoring in the projected importer demand gap that is currently unmet and could be potential opportunity, it identifies the potential for the Exporter (Country) among 190 countries, against the general trade analysis, which identifies the biggest importer or exporter.
To discover high-growth global markets and optimize your business strategy:
Click Here
Pricing
- Single User License$ 1,995
- Department License$ 2,400
- Site License$ 3,120
- Global License$ 3,795

Leadership Perspectives from Industry Events
Search
Thought Leadership and Analyst Meet


Our Clients
6WResearch In News
- India Air Conditioner Market Set for Strong Rebound in 2026 After Weather-Led Correction and GST-Driven Recovery: 6Wresearch
- ADAS in India: How Automatic Emergency Braking, Blind Spot Detection & Driver Monitoring are Transforming Road Safety
- Doha a strategic location for EV manufacturing hub: IPA Qatar
- Demand for luxury TVs surging in the GCC, says Samsung
- Empowering Growth: The Thriving Journey of Bangladesh’s Cable Industry
- Demand for luxury TVs surging in the GCC, says Samsung
Latest Reports
- Nicaragua RPG Gaming Market (2026-2032)
- New Zealand RPG Gaming Market (2026-2032)
- Netherlands RPG Gaming Market (2026-2032)
- Nauru RPG Gaming Market (2026-2032)
- Namibia RPG Gaming Market (2026-2032)
- Mozambique RPG Gaming Market (2026-2032)
- Montenegro RPG Gaming Market (2026-2032)
- Mongolia RPG Gaming Market (2026-2032)
- Monaco RPG Gaming Market (2026-2032)
- Micronesia RPG Gaming Market (2026-2032)
Industry Events and Analyst Meet

EV India Expo 2026

HIMTEX 2026

India Refining Summit 2026

India EV Show 2026

EV tech India Expo 2026
Whitepaper
- Middle East & Africa Commercial Security Market Click here to view more.
- Middle East & Africa Fire Safety Systems & Equipment Market Click here to view more.
- GCC Drone Market Click here to view more.
- Middle East Lighting Fixture Market Click here to view more.
- GCC Physical & Perimeter Security Market Click here to view more.