Romania Synthetic Tannins Market (2026-2032) | Value, Forecast, Competitive Landscape, Outlook, Industry, Growth, Companies, Trends, Size & Revenue, Share, Segmentation, Analysis
Market Forecast By Type (Hydrolyzable, Condensed), By Application (Pharmaceutical Industry, Food Industry, Paper Industry, Textile Industry, Others) And Competitive Landscape
| Product Code: ETC8982725 | Publication Date: Sep 2024 | Updated Date: Apr 2026 | Product Type: Market Research Report | |
| Publisher: 6Wresearch | Author: Dhaval Chaurasia | No. of Pages: 75 | No. of Figures: 35 | No. of Tables: 20 |
Romania Synthetic Tannins Market Size (2020-2030)
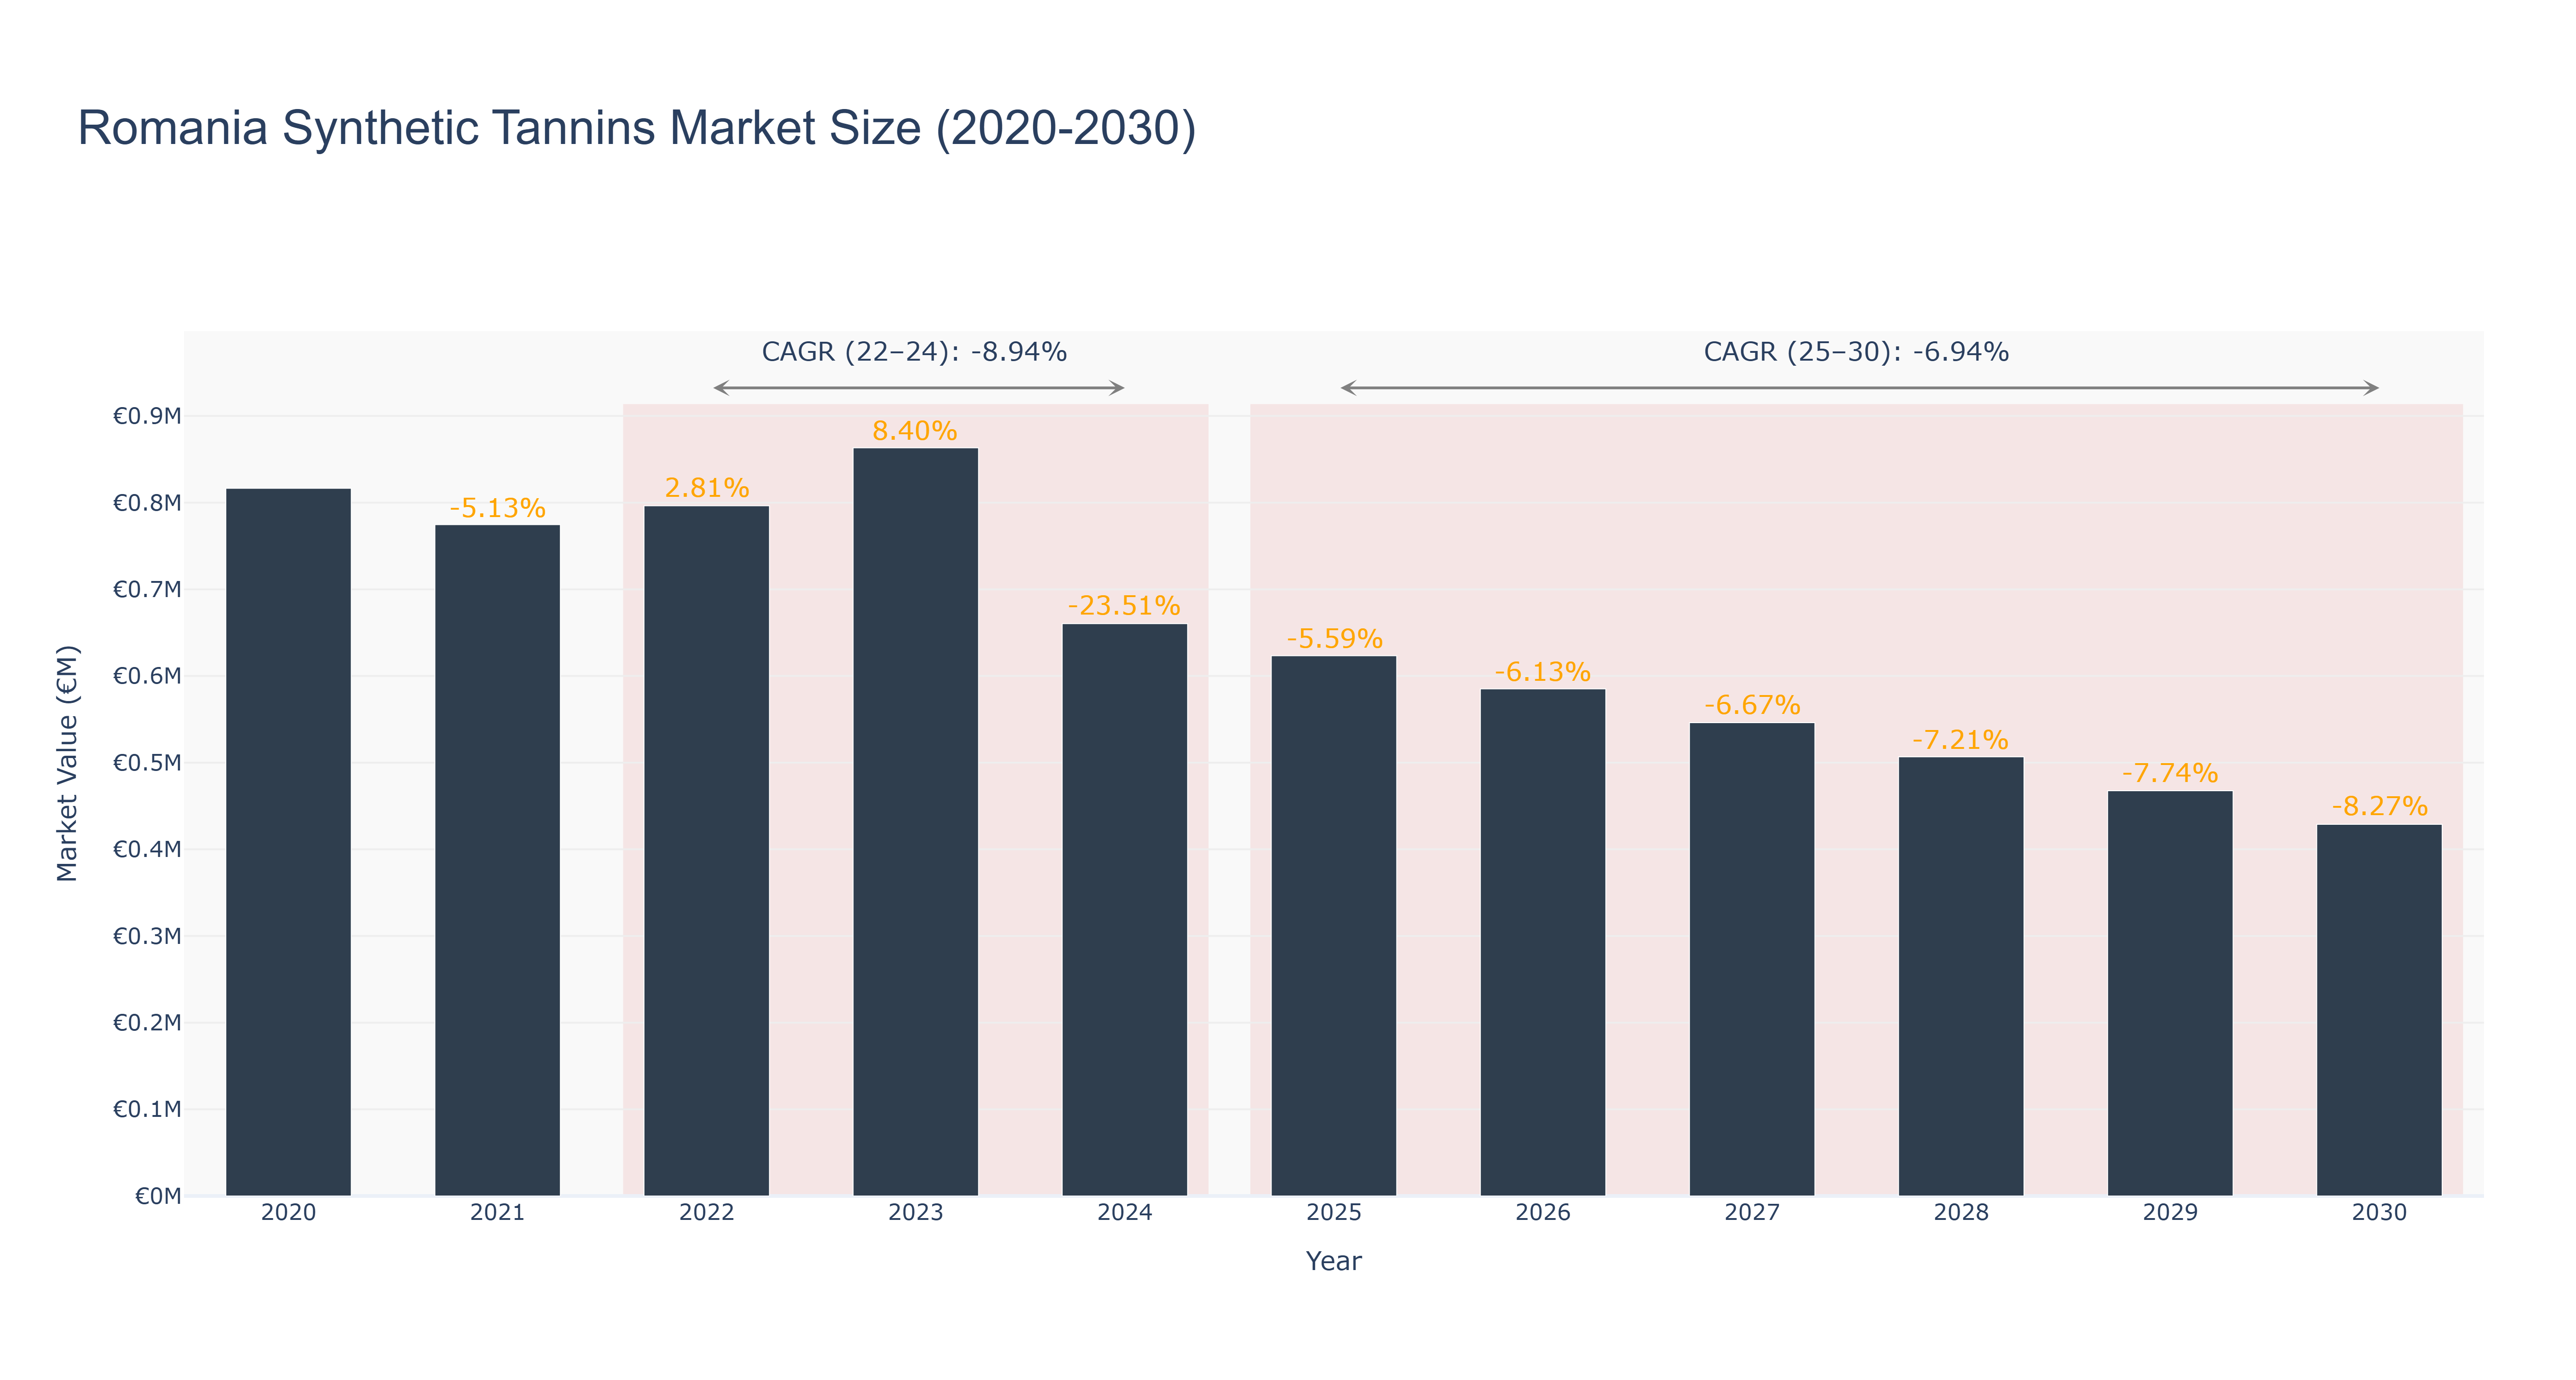
Romania Synthetic Tannins Market has seen fluctuations in recent years. The peak market size was €0.86 million in 2023, followed by a decline to €0.66 million in 2024. The forecasted market size is expected to continue decreasing from €0.62 million in 2025 to €0.43 million in 2030. The CAGR for the period 2022-24 was -8.94%, while for 2025-30, it is projected at -6.94%. The downward trend can be attributed to factors such as changing consumer preferences, economic uncertainties, and increased competition. Looking ahead, the market is likely to focus on product innovation, sustainability initiatives, and expanding into new application areas. Recent developments include partnerships with local suppliers for sourcing raw materials sustainably and investing in research and development for eco-friendly tannin production processes. These initiatives aim to drive growth and competitiveness in the market.
Romania Synthetic Tannins Market: Production & Trade Performance (2019-2025)
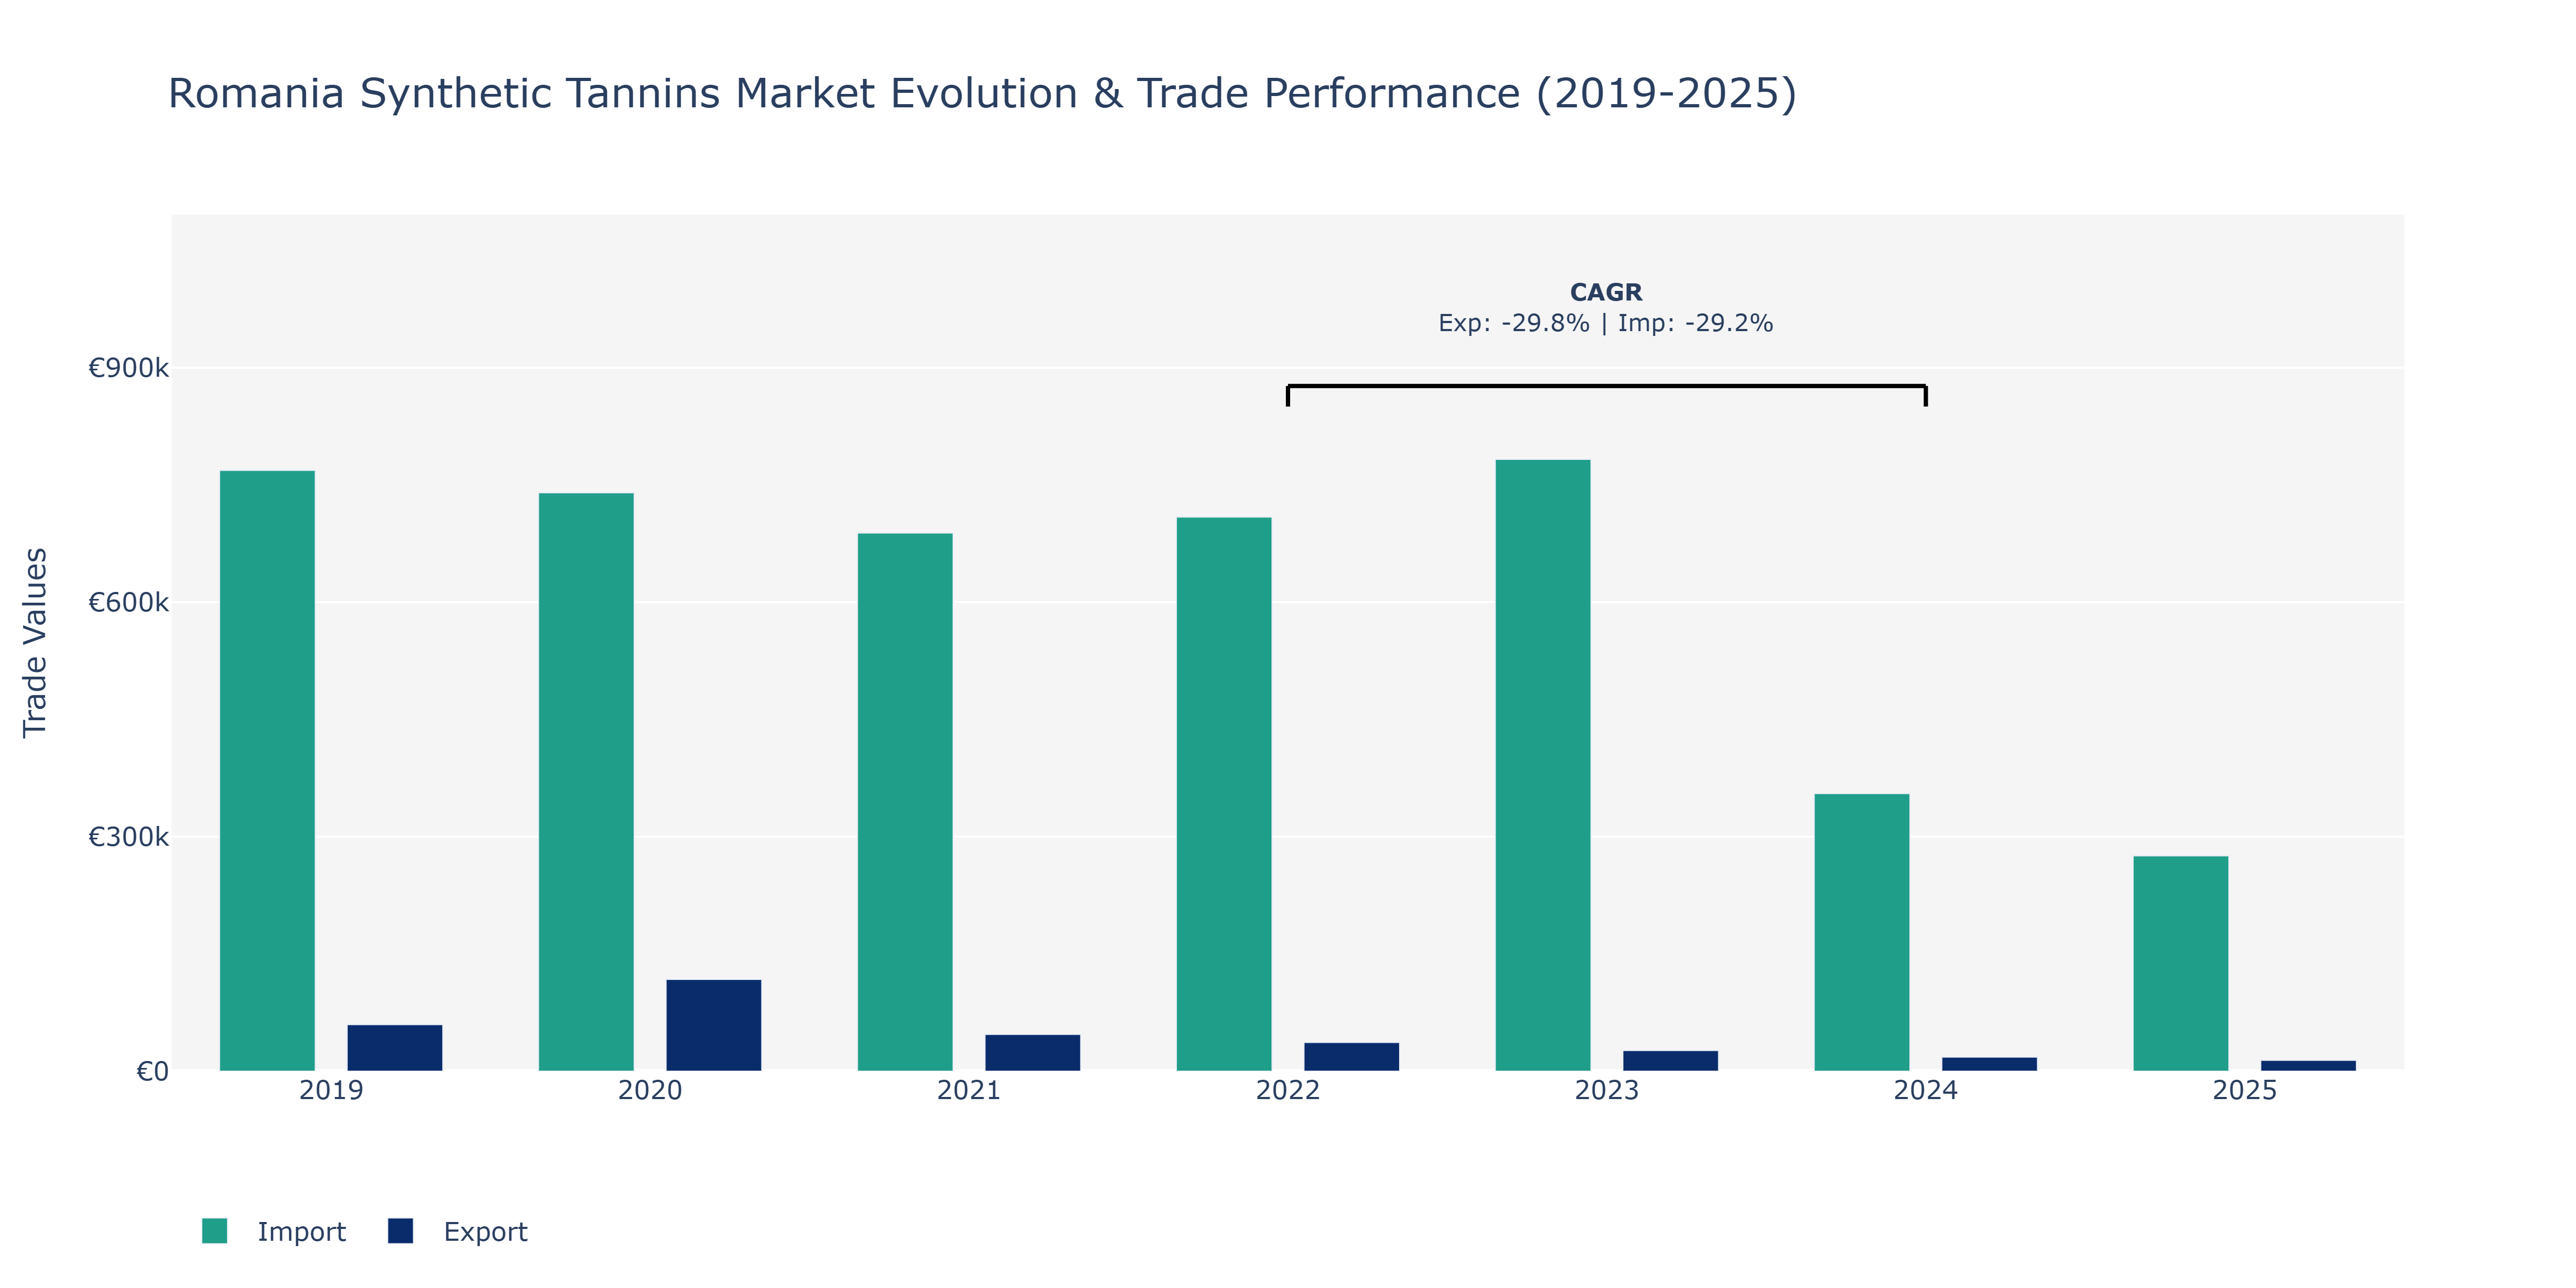
Between 2019 and 2025, the Romania Synthetic Tannins market witnessed fluctuations in both Exports and Imports. Exports peaked in 2020 at €117.38 thousand, then experienced a steady decline, hitting €13.94 thousand in 2025. This decline can be attributed to various factors such as changes in global demand patterns, evolving consumer preferences, and competitive pressures within the market. Conversely, Imports fluctuated, reaching their highest point in 2023 at €782.59 thousand before dropping to €275.39 thousand in 2025. This significant decrease could be due to shifts in supply chain dynamics, sourcing strategies, or regulatory changes impacting the import landscape. To sustain market growth, stakeholders may need to focus on enhancing competitiveness, exploring new market opportunities, and adapting to evolving trade dynamics in the synthetic tannins industry.
Key Highlights of the Report:
- Romania Synthetic Tannins Market Outlook
- Market Size of Romania Synthetic Tannins Market, 2025
- Forecast of Romania Synthetic Tannins Market, 2032
- Historical Data and Forecast of Romania Synthetic Tannins Revenues & Volume for the Period 2022-2032F
- Romania Synthetic Tannins Market Trend Evolution
- Romania Synthetic Tannins Market Drivers and Challenges
- Romania Synthetic Tannins Price Trends
- Romania Synthetic Tannins Porter's Five Forces
- Romania Synthetic Tannins Industry Life Cycle
- Historical Data and Forecast of Romania Synthetic Tannins Market Revenues & Volume By Type for the Period 2022-2032F
- Historical Data and Forecast of Romania Synthetic Tannins Market Revenues & Volume By Hydrolyzable for the Period 2022-2032F
- Historical Data and Forecast of Romania Synthetic Tannins Market Revenues & Volume By Condensed for the Period 2022-2032F
- Historical Data and Forecast of Romania Synthetic Tannins Market Revenues & Volume By Application for the Period 2022-2032F
- Historical Data and Forecast of Romania Synthetic Tannins Market Revenues & Volume By Pharmaceutical Industry for the Period 2022-2032F
- Historical Data and Forecast of Romania Synthetic Tannins Market Revenues & Volume By Food Industry for the Period 2022-2032F
- Historical Data and Forecast of Romania Synthetic Tannins Market Revenues & Volume By Paper Industry for the Period 2022-2032F
- Historical Data and Forecast of Romania Synthetic Tannins Market Revenues & Volume By Textile Industry for the Period 2022-2032F
- Historical Data and Forecast of Romania Synthetic Tannins Market Revenues & Volume By Others for the Period 2022-2032F
- Romania Synthetic Tannins Import Export Trade Statistics
- Market Opportunity Assessment By Type
- Market Opportunity Assessment By Application
- Romania Synthetic Tannins Top Companies Market Share
- Romania Synthetic Tannins Competitive Benchmarking By Technical and Operational Parameters
- Romania Synthetic Tannins Company Profiles
- Romania Synthetic Tannins Key Strategic Recommendations
Frequently Asked Questions About the Market Study (FAQs):
6Wresearch actively monitors the Romania Synthetic Tannins Market and publishes its comprehensive annual report, highlighting emerging trends, growth drivers, revenue analysis, and forecast outlook. Our insights help businesses to make data-backed strategic decisions with ongoing market dynamics. Our analysts track relevent industries related to the Romania Synthetic Tannins Market, allowing our clients with actionable intelligence and reliable forecasts tailored to emerging regional needs.
Yes, we provide customisation as per your requirements. To learn more, feel free to contact us on sales@6wresearch.com
1 Executive Summary |
2 Introduction |
2.1 Key Highlights of the Report |
2.2 Report Description |
2.3 Market Scope & Segmentation |
2.4 Research Methodology |
2.5 Assumptions |
3 Romania Synthetic Tannins Market Overview |
3.1 Romania Country Macro Economic Indicators |
3.2 Romania Synthetic Tannins Market Revenues & Volume, 2022 & 2032F |
3.3 Romania Synthetic Tannins Market - Industry Life Cycle |
3.4 Romania Synthetic Tannins Market - Porter's Five Forces |
3.5 Romania Synthetic Tannins Market Revenues & Volume Share, By Type, 2022 & 2032F |
3.6 Romania Synthetic Tannins Market Revenues & Volume Share, By Application, 2022 & 2032F |
4 Romania Synthetic Tannins Market Dynamics |
4.1 Impact Analysis |
4.2 Market Drivers |
4.2.1 Growing demand for eco-friendly tanning solutions |
4.2.2 Rising awareness about the benefits of synthetic tannins in leather production |
4.2.3 Increasing investments in research and development for innovative tanning technologies |
4.3 Market Restraints |
4.3.1 Fluctuating prices of raw materials used in synthetic tannins production |
4.3.2 Stringent regulations related to chemical usage in the tanning industry |
4.3.3 Limited availability of skilled workforce in the synthetic tannins sector |
5 Romania Synthetic Tannins Market Trends |
6 Romania Synthetic Tannins Market, By Types |
6.1 Romania Synthetic Tannins Market, By Type |
6.1.1 Overview and Analysis |
6.1.2 Romania Synthetic Tannins Market Revenues & Volume, By Type, 2022-2032F |
6.1.3 Romania Synthetic Tannins Market Revenues & Volume, By Hydrolyzable, 2022-2032F |
6.1.4 Romania Synthetic Tannins Market Revenues & Volume, By Condensed, 2022-2032F |
6.2 Romania Synthetic Tannins Market, By Application |
6.2.1 Overview and Analysis |
6.2.2 Romania Synthetic Tannins Market Revenues & Volume, By Pharmaceutical Industry, 2022-2032F |
6.2.3 Romania Synthetic Tannins Market Revenues & Volume, By Food Industry, 2022-2032F |
6.2.4 Romania Synthetic Tannins Market Revenues & Volume, By Paper Industry, 2022-2032F |
6.2.5 Romania Synthetic Tannins Market Revenues & Volume, By Textile Industry, 2022-2032F |
6.2.6 Romania Synthetic Tannins Market Revenues & Volume, By Others, 2022-2032F |
7 Romania Synthetic Tannins Market Import-Export Trade Statistics |
7.1 Romania Synthetic Tannins Market Export to Major Countries |
7.2 Romania Synthetic Tannins Market Imports from Major Countries |
8 Romania Synthetic Tannins Market Key Performance Indicators |
8.1 Environmental impact assessment of synthetic tannins production processes |
8.2 Adoption rate of advanced synthetic tanning techniques in the Romanian leather industry |
8.3 Research and development expenditure on sustainable synthetic tannins formulations |
8.4 Percentage of tanneries in Romania using synthetic tannins in their production processes |
9 Romania Synthetic Tannins Market - Opportunity Assessment |
9.1 Romania Synthetic Tannins Market Opportunity Assessment, By Type, 2022 & 2032F |
9.2 Romania Synthetic Tannins Market Opportunity Assessment, By Application, 2022 & 2032F |
10 Romania Synthetic Tannins Market - Competitive Landscape |
10.1 Romania Synthetic Tannins Market Revenue Share, By Companies, 2025 |
10.2 Romania Synthetic Tannins Market Competitive Benchmarking, By Operating and Technical Parameters |
11 Company Profiles |
12 Recommendations |
13 Disclaimer |
Export potential assessment - trade Analytics for 2030
Export potential enables firms to identify high-growth global markets with greater confidence by combining advanced trade intelligence with a structured quantitative methodology. The framework analyzes emerging demand trends and country-level import patterns while integrating macroeconomic and trade datasets such as GDP and population forecasts, bilateral import–export flows, tariff structures, elasticity differentials between developed and developing economies, geographic distance, and import demand projections. Using weighted trade values from 2020–2024 as the base period to project country-to-country export potential for 2030, these inputs are operationalized through calculated drivers such as gravity model parameters, tariff impact factors, and projected GDP per-capita growth. Through an analysis of hidden potentials, demand hotspots, and market conditions that are most favorable to success, this method enables firms to focus on target countries, maximize returns, and global expansion with data, backed by accuracy.
By factoring in the projected importer demand gap that is currently unmet and could be potential opportunity, it identifies the potential for the Exporter (Country) among 190 countries, against the general trade analysis, which identifies the biggest importer or exporter.
To discover high-growth global markets and optimize your business strategy:
Click Here
Pricing
- Single User License$ 1,995
- Department License$ 2,400
- Site License$ 3,120
- Global License$ 3,795

Search
Thought Leadership and Analyst Meet


Our Clients
Latest Reports
- United Kingdom (UK) Outdoor Cooking Equipment Market (2026-2032) | Investment Opportunities, Outlook, Growth, Competition, Trends, Pricing, Demand, Insights, Challenges, Drivers, Size, Restraints, segmentation, Value, Share, Forecast, Companies, Analysis, Revenue, Strategy
- United Arab Emirates (UAE) Outdoor Cooking Equipment Market (2026-2032) | Challenges, Value, Restraints, Growth, Competition, Revenue, Trends, Outlook, Analysis, Drivers, Share, Investment Opportunities, Strategy, Demand, Companies, Forecast, Pricing, segmentation, Size, Insights
- Vietnam Outdoor Cooking Equipment Market (2026-2032) | Demand, Investment Opportunities, Growth, Pricing, Trends, Restraints, Competition, Outlook, Drivers, Strategy, Challenges, Revenue, Analysis, segmentation, Value, Size, Share, Insights, Companies, Forecast
- Venezuela Outdoor Cooking Equipment Market (2026-2032) | Challenges, Revenue, Demand, Value, Pricing, Strategy, Competition, Analysis, Companies, Insights, Growth, Outlook, Forecast, Size, Restraints, segmentation, Drivers, Trends, Investment Opportunities, Share
- Uganda Outdoor Cooking Equipment Market (2026-2032) | Drivers, Pricing, Challenges, Value, Growth, Companies, segmentation, Strategy, Analysis, Demand, Outlook, Size, Competition, Restraints, Revenue, Forecast, Investment Opportunities, Insights, Trends, Share
- Turkey Outdoor Cooking Equipment Market (2026-2032) | Size, Competition, Outlook, Strategy, Forecast, Drivers, Trends, Companies, Revenue, Growth, Analysis, segmentation, Insights, Pricing, Restraints, Demand, Investment Opportunities, Value, Share, Challenges
- Tunisia Outdoor Cooking Equipment Market (2026-2032) | Analysis, Share, Pricing, Trends, Size, Outlook, Revenue, segmentation, Demand, Insights, Investment Opportunities, Restraints, Growth, Forecast, Competition, Drivers, Challenges, Companies, Strategy, Value
- Thailand Outdoor Cooking Equipment Market (2026-2032) | Growth, Revenue, Insights, Companies, Drivers, Strategy, Forecast, Size, Analysis, segmentation, Trends, Challenges, Competition, Share, Investment Opportunities, Demand, Pricing, Value, Restraints, Outlook
- Tanzania Outdoor Cooking Equipment Market (2026-2032) | Share, Drivers, Forecast, Revenue, Growth, Outlook, Analysis, Investment Opportunities, Restraints, segmentation, Demand, Pricing, Size, Insights, Challenges, Competition, Companies, Value, Trends, Strategy
- Tajikistan Outdoor Cooking Equipment Market (2026-2032) | Value, Pricing, Companies, Share, Strategy, Revenue, Investment Opportunities, Demand, Forecast, Size, Competition, Challenges, Growth, Insights, Restraints, segmentation, Analysis, Trends, Drivers, Outlook
Industry Events and Analyst Meet

HIMTEX 2026

India Refining Summit 2026

India EV Show 2026

EV tech India Expo 2026

Auto Tech Asia 2026
Whitepaper
- Middle East & Africa Commercial Security Market Click here to view more.
- Middle East & Africa Fire Safety Systems & Equipment Market Click here to view more.
- GCC Drone Market Click here to view more.
- Middle East Lighting Fixture Market Click here to view more.
- GCC Physical & Perimeter Security Market Click here to view more.
6WResearch In News
- Doha a strategic location for EV manufacturing hub: IPA Qatar
- Demand for luxury TVs surging in the GCC, says Samsung
- Empowering Growth: The Thriving Journey of Bangladesh’s Cable Industry
- Demand for luxury TVs surging in the GCC, says Samsung
- Video call with a traditional healer? Once unthinkable, it’s now common in South Africa
- Intelligent Buildings To Smooth GCC’s Path To Net Zero