Saudi Arabia Industrial Silica Sand Market (2026-2032) | Forecast, Share, Companies, Trends, Growth, Revenue, Size, Analysis, Industry & Value
Market Forecast By Classification (Less Than 40 Mesh, 40-70 Mesh, More Than 70 Mesh), By Application (Hydraulic Fracturing, Glassmaking, Foundry, Ceramics and Refractories, Others) And Competitive Landscape
| Product Code: ETC084358 | Publication Date: Jun 2021 | Updated Date: May 2026 | Product Type: Report | |
| Publisher: 6Wresearch | Author: Ravi Bhandari | No. of Pages: 70 | No. of Figures: 35 | No. of Tables: 5 |
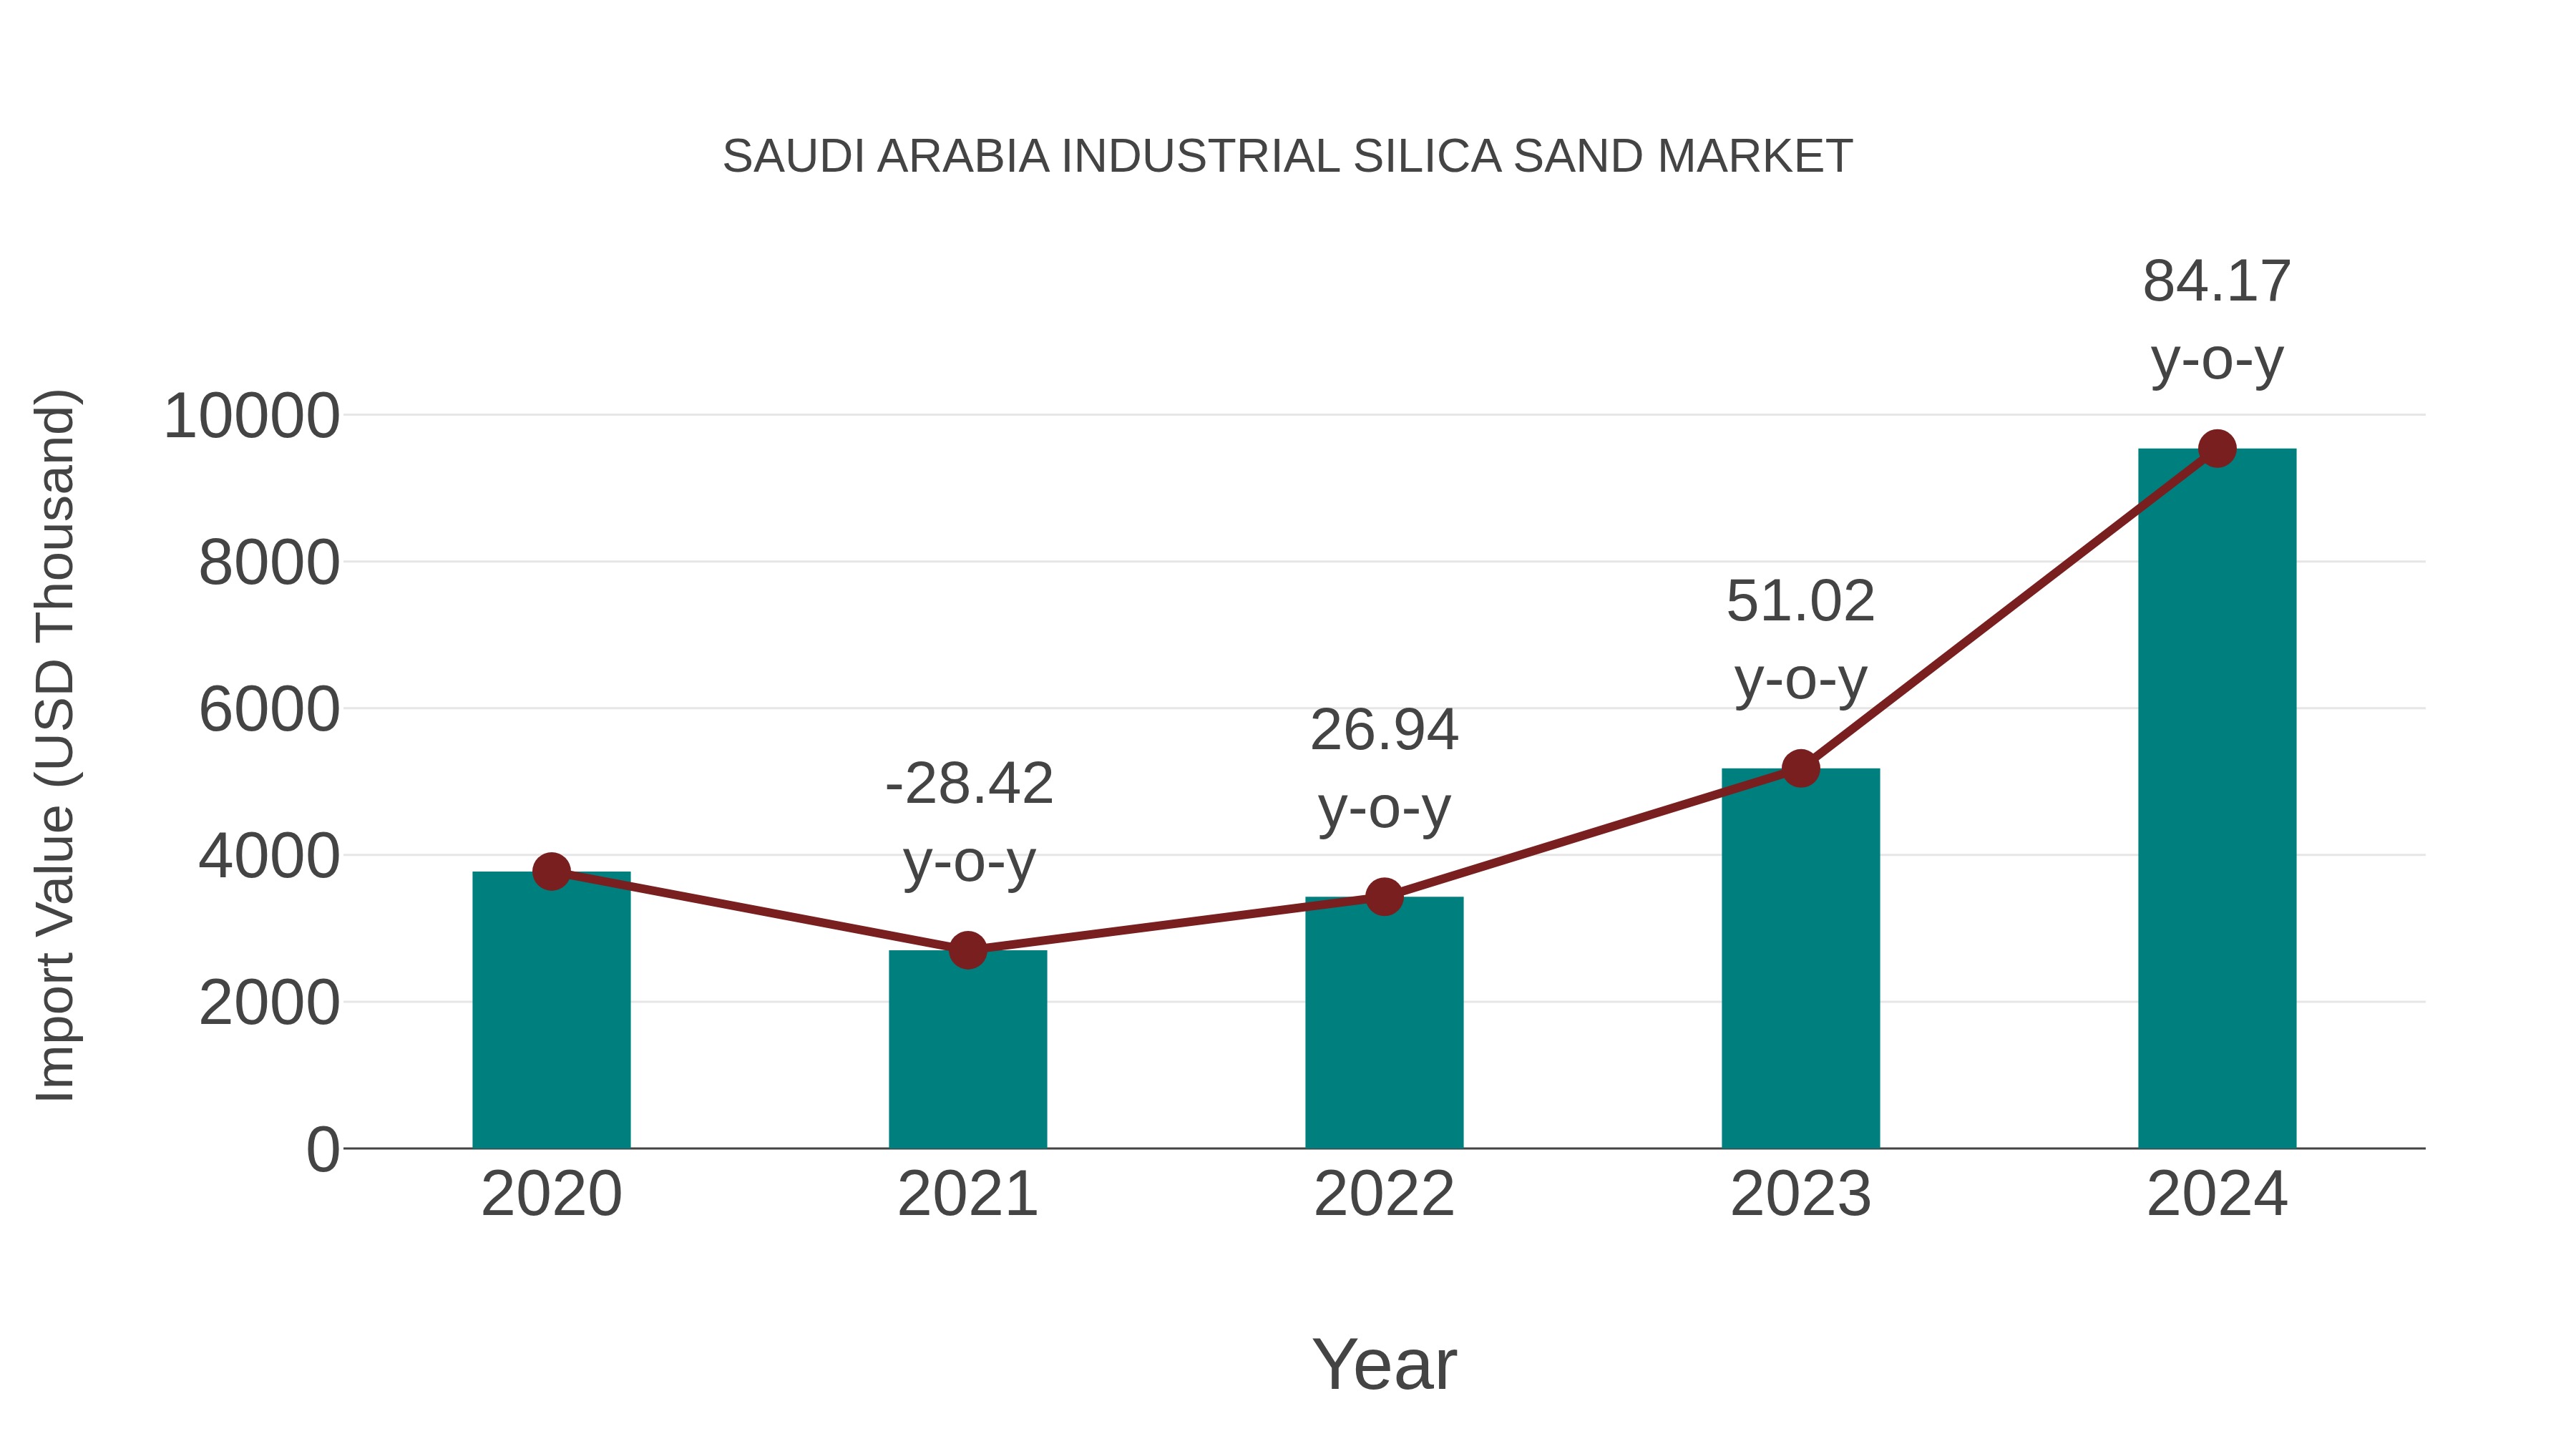
Saudi Arabia Industrial Silica Sand Market: Import Trend Analysis
In the Saudi Arabia industrial silica sand market, the import trend exhibited significant growth from 2023 to 2024, with a notable 84.17% increase. The compound annual growth rate (CAGR) for the period 2020-2024 stood at 26.08%. This surge in imports can be attributed to a robust demand shift towards high-quality silica sand for industrial applications, indicating a positive import momentum in the market.
Saudi Arabia Industrial Silica Sand Market Growth Rate
According to 6Wresearch internal database and industry insights, the Saudi Arabia Industrial Silica Sand Market is projected to grow at a compound annual growth rate (CAGR) of 5.9% during the forecast period (2026-2032).
Topics Covered in the Saudi Arabia Industrial Silica Sand Market Report
The Saudi Arabia Industrial Silica Sand Market report thoroughly covers the market by Classification and Application. The market report provides an unbiased and detailed analysis of ongoing market trends, opportunities/high growth areas, and market drivers, which help stakeholders devise and align their market strategies according to the current and future market dynamics.
Saudi Arabia Industrial Silica Sand Market Highlights
| Report Name |
Saudi Arabia Industrial Silica Sand Market |
| Forecast period | 2026-2032 |
| CAGR | 5.9% |
| Growing Sector | Glassmaking & Hydraulic Fracturing |
Saudi Arabia Industrial Silica Sand Market Synopsis
The Saudi Arabia Industrial Silica Sand Market Growth is being fuelled by the growing need for silica sand in industrial applications including glass manufacturing, hydraulic fracturing, and foundries. The construction boom taking place within the country, which requires good quality silica sand, is another factor that is driving the market forward. In addition to that, efforts by the government to increase mining production in the country are helping to propel the growth of the market.
Evaluation of Growth Drivers in the Saudi Arabia Industrial Silica Sand Market
Below mentioned are some prominent drivers and their influence on the market dynamics:
| Drivers | Primary Segments Affected | Why it Matters (Evidence) |
| Increased Construction Activities | Glassmaking, Hydraulic Fracturing, Foundry | High demand for silica sand due to urbanization and infrastructure projects boosting market growth. |
| Government Support for Mining | All Segments | Policies promoting mining activities and export potential positively affect silica sand availability. |
| Rising Demand for Hydraulic Fracturing | Hydraulic Fracturing, Foundry | Growing oil & gas exploration activities necessitate the need for high-quality sand in fracking processes. |
| Glassmaking and Foundry Industry Expansion | Glassmaking, Foundry, Ceramics | The increased demand for silica sand used in industry applications. |
| Refractory and Ceramics Industry Development | Ceramics, Refractory Materials | The growth in manufacturing processes and industries increases the demand for silica sand |
The Saudi Arabia Industrial Silica Sand Market is expected to grow at a CAGR of 5.9% during the forecast period of 2026-2032. This growth is driven by the rising demand for silica sand in multiple industries such as glassmaking, hydraulic fracturing, and construction. Increased government investment in mining infrastructure, as well as the growth in industrial sectors, continues to drive the market forward.
Evaluation of Restraints in the Saudi Arabia Industrial Silica Sand Market
Below mentioned are some major restraints and their influence on the market dynamics:
| Restraints | Primary Segments Affected | What This Means (Evidence) |
| Limited Local Supply of High-Grade Silica Sand | All Segments | Import reliance increases costs and affects the ability to meet rising demand for specialized sand types. |
| Environmental Regulations | Glassmaking, Foundry, Hydraulic Fracturing | Stricter mining and environmental regulations may slow down production rates and increase costs. |
| Logistical Challenges | All Segments | Difficulties in transportation and supply chain issues hinder the efficient delivery of silica sand. |
| High Production Costs | All Segments | Increased production and transportation costs impact the profitability and pricing structures for local manufacturers. |
| Shortage of Skilled Labor | All Segments | A lack of skilled workers in mining and industrial processes slows down operations and impacts efficiency. |
Saudi Arabia Industrial Silica Sand Market Challenges
Although there are plenty of opportunities for growth, the Saudi Arabia Industrial Silica Sand Market Share encounters several issues, such as high production costs, environmental restrictions, and logistic problems that hinder the smooth functioning of the supply chain. The dependency on the import of quality silica sand and the lack of skilled workers in the mining sector are some other important issues faced by the industry.
Saudi Arabia Industrial Silica Sand Market Trends
Emerging trends in analyzing the current scenario in Saudi Arabia’s industrial silica sand market include:
- Mining Technologies: Smart and automated mining techniques are being used to boost production and cut costs of production.
- Rise in Application of Silica Sand in Construction: Rise in urbanization is increasing the application of silica sand in concrete and mortar.
- Mining Sustainability: Sustainable mining practices that involve mining responsibly are increasingly becoming a trend.
- Localized Production: Increasing trend of localized production of silica sand in light of efforts to minimize reliance on silica sand imports.
Investment Opportunities in the Saudi Arabia Industrial Silica Sand Market
The following are some of the noteworthy investments in the Saudi Arabia Industrial Silica Sand Market:
- Investments in the Development of Very Sophisticated Silica Sand Processing Units: Using sophisticated technologies for processing the silica sand and reducing its dependency on external sources.
- Investments in the Increase in Hydraulic Fracturing Activities: Supplying premium quality silica sand for hydraulic fracturing by using advanced extraction techniques.
- Government-Supported Mining Projects: Implementing government projects aimed at setting up mining units for higher silica sand production and supply.
- Investment in Innovative Glassmaking Sand Production Technologies: Innovation in the production of high-quality glassmaking sand, which is an essential part of the industrial market segment.
Top 5 Leading Players in the Saudi Arabia Industrial Silica Sand Market
Some leading players operating in the Saudi Arabia Industrial Silica Sand Market include:
1. Qatar Industrial Silica Sand Co.
| Company Name | Qatar Industrial Silica Sand Co. |
|---|---|
| Established Year | 2010 |
| Headquarters | Doha, Qatar |
| Official Website | - |
Qatar Industrial Silica Sand Co. produces high-quality silica sand for use in hydraulic fracturing and foundries, enhancing the regional supply chain.
2. Saudi Silica Sand Co.
| Company Name | Saudi Silica Sand Co. |
|---|---|
| Established Year | 2015 |
| Headquarters | Riyadh, Saudi Arabia |
| Official Website | - |
Saudi Silica Sand Co. specializes in providing high-grade silica sand for use in construction, ceramics, and glassmaking industries.
3. National Silica Products
| Company Name | National Silica Products |
|---|---|
| Established Year | 2008 |
| Headquarters | Jeddah, Saudi Arabia |
| Official Website | - |
National Silica Products is a leading manufacturer of industrial silica sand, supplying the Saudi market with high-quality materials for various industrial applications.
4. AlRashid Group
| Company Name | AlRashid Group |
|---|---|
| Established Year | 1976 |
| Headquarters | Al Khobar, Saudi Arabia |
| Official Website | - |
AlRashid Group manufactures silica sand products for use in the foundry, construction, and glassmaking industries, playing a major role in the local market.
5. SABIC
| Company Name | SABIC |
|---|---|
| Established Year | 1976 |
| Headquarters | Riyadh, Saudi Arabia |
| Official Website | Click Here |
SABIC produces specialized silica sand used in the production of various industrial applications, contributing significantly to the regional economy.
Government Regulations Introduced in the Saudi Arabia Industrial Silica Sand Market
According to Saudi Government Data, a number of interventions have been undertaken with regard to the industrial silica sand market. One such intervention involves simplifying the licensing process for mining firms to help provide more efficiency in silica sand supply for the booming construction sector. Moreover, the government is encouraging the local manufacture of silica sand by offering various incentives and subsidies, as well as making sure that any hurdles involved in importing specific types of silica sand are removed.
Future Insights of the Saudi Arabia Industrial Silica Sand Market
The outlook for the Saudi Arabia Industrial Silica Sand Industry is optimistic, driven by continuous demand from key industries such as construction, glassmaking, and hydraulic fracturing. As the country further develops its mining infrastructure and reduces reliance on imports, domestic production of high-quality silica sand is expected to increase. The government’s ongoing support for the mining sector, coupled with R&D investments, will boost growth and create more investment opportunities, strengthening the market in the years to come.
Market Segmentation Analysis
The report offers a comprehensive study of the subsequent market segments and their leading categories:
Less Than 40 Mesh to dominate the Market- By Classification
According to Sahil, Senior Research Analyst, 6Wresearch, this classification is widely used in hydraulic fracturing due to its fine particles, which provide excellent conductivity and permeability, making it ideal for oil and gas extraction processes, enhancing the efficiency of fracking operations.
Glassmaking to dominate the Market- By Application
The second use of silica sand relates to the making of glass, where silica sand acts as an important raw material in creating excellent glass products. This material's resistance to heat makes it important when producing glass containers and flat glass.
Key Attractiveness of the Report
- 10 Years of Market Numbers.
- Historical Data Starting from 2022 to 2025.
- Base Year: 2025.
- Forecast Data until 2032.
- Key Performance Indicators Impacting the Market.
- Major Upcoming Developments and Projects.
Key Highlights of the Report:
- Saudi Arabia Industrial Silica Sand Market Outlook
- Market Size of Saudi Arabia Industrial Silica Sand Market, 2025
- Forecast of Saudi Arabia Industrial Silica Sand Market, 2032
- Historical Data and Forecast of Saudi Arabia Industrial Silica Sand Revenues & Volume for the Period 2022-2032F
- Saudi Arabia Industrial Silica Sand Market Trend Evolution
- Saudi Arabia Industrial Silica Sand Market Drivers and Challenges
- Saudi Arabia Industrial Silica Sand Price Trends
- Saudi Arabia Industrial Silica Sand Porter's Five Forces
- Saudi Arabia Industrial Silica Sand Industry Life Cycle
- Historical Data and Forecast of Saudi Arabia Industrial Silica Sand Market Revenues & Volume By Classification for the Period 2022-2032F
- Historical Data and Forecast of Saudi Arabia Industrial Silica Sand Market Revenues & Volume By Less Than 40 Mesh for the Period 2022-2032F
- Historical Data and Forecast of Saudi Arabia Industrial Silica Sand Market Revenues & Volume By 40-70 Mesh for the Period 2022-2032F
- Historical Data and Forecast of Saudi Arabia Industrial Silica Sand Market Revenues & Volume By More Than 70 Mesh for the Period 2022-2032F
- Historical Data and Forecast of Saudi Arabia Industrial Silica Sand Market Revenues & Volume By Application for the Period 2022-2032F
- Historical Data and Forecast of Saudi Arabia Industrial Silica Sand Market Revenues & Volume By Hydraulic Fracturing for the Period 2022-2032F
- Historical Data and Forecast of Saudi Arabia Industrial Silica Sand Market Revenues & Volume By Glassmaking for the Period 2022-2032F
- Historical Data and Forecast of Saudi Arabia Industrial Silica Sand Market Revenues & Volume By Foundry for the Period 2022-2032F
- Historical Data and Forecast of Saudi Arabia Industrial Silica Sand Market Revenues & Volume By Ceramics and Refractories for the Period 2022-2032F
- Historical Data and Forecast of Saudi Arabia Industrial Silica Sand Market Revenues & Volume By Others for the Period 2022-2032F
- Saudi Arabia Industrial Silica Sand Import Export Trade Statistics
- Market Opportunity Assessment By Classification
- Market Opportunity Assessment By Application
- Saudi Arabia Industrial Silica Sand Top Companies Market Share
- Saudi Arabia Industrial Silica Sand Competitive Benchmarking By Technical and Operational Parameters
- Saudi Arabia Industrial Silica Sand Company Profiles
- Saudi Arabia Industrial Silica Sand Key Strategic Recommendations
Market Covered
The report offers a comprehensive study of the subsequent market segments:
By Classification
- Less Than 40 Mesh
- 40-70 Mesh
- More Than 70 Mesh
By Application
- Hydraulic Fracturing
- Glassmaking
- Foundry
- Ceramics and Refractories
- Others (such as construction, water filtration)
Saudi Arabia Industrial Silica Sand Market (2026-2032): FAQs
The growth rate of the Saudi Arabia Industrial Silica Sand Market would be 5.9% during the period from 2026 to 2032.
Booming construction industry, rising hydraulic fracturing, and supportive government policies for the mining industry have been identified as the contributing factors to market growth.
Environmental regulations, high cost of production, and logistic complications are the key challenges facing this market.
Important trends affecting the Saudi Arabia Industrial Silica Sand Market include sustainable mining operations, rise in applications of silica sand in construction, and supportive government policies.
6Wresearch actively monitors the Saudi Arabia Industrial Silica Sand Market and publishes its comprehensive annual report, highlighting emerging trends, growth drivers, revenue analysis, and forecast outlook. Our insights help businesses to make data-backed strategic decisions with ongoing market dynamics. Our analysts track relevent industries related to the Saudi Arabia Industrial Silica Sand Market, allowing our clients with actionable intelligence and reliable forecasts tailored to emerging regional needs.
Yes, we provide customisation as per your requirements. To learn more, feel free to contact us on sales@6wresearch.com
| 1 Executive Summary |
| 2 Introduction |
| 2.1 Key Highlights of the Report |
| 2.2 Report Description |
| 2.3 Market Scope & Segmentation |
| 2.4 Research Methodology |
| 2.5 Assumptions |
| 3 Saudi Arabia Industrial Silica Sand Market Overview |
| 3.1 Saudi Arabia Country Macro Economic Indicators |
| 3.2 Saudi Arabia Industrial Silica Sand Market Revenues & Volume, 2022 & 2032F |
| 3.3 Saudi Arabia Industrial Silica Sand Market - Industry Life Cycle |
| 3.4 Saudi Arabia Industrial Silica Sand Market - Porter's Five Forces |
| 3.5 Saudi Arabia Industrial Silica Sand Market Revenues & Volume Share, By Classification, 2022 & 2032F |
| 3.6 Saudi Arabia Industrial Silica Sand Market Revenues & Volume Share, By Application, 2022 & 2032F |
| 4 Saudi Arabia Industrial Silica Sand Market Dynamics |
| 4.1 Impact Analysis |
| 4.2 Market Drivers |
| 4.2.1 Growth in the construction industry in Saudi Arabia leading to increased demand for industrial silica sand. |
| 4.2.2 Expansion of the oil and gas sector in the region, driving the need for silica sand in hydraulic fracturing activities. |
| 4.2.3 Increasing use of silica sand in the manufacturing of glass, ceramics, and foundry industries. |
| 4.3 Market Restraints |
| 4.3.1 Environmental regulations and concerns regarding the extraction and processing of silica sand. |
| 4.3.2 Fluctuations in global oil prices impacting the demand for industrial silica sand in the oil and gas sector. |
| 5 Saudi Arabia Industrial Silica Sand Market Trends |
| 6 Saudi Arabia Industrial Silica Sand Market, By Types |
| 6.1 Saudi Arabia Industrial Silica Sand Market, By Classification |
| 6.1.1 Overview and Analysis |
| 6.1.2 Saudi Arabia Industrial Silica Sand Market Revenues & Volume, By Classification, 2022-2032F |
| 6.1.3 Saudi Arabia Industrial Silica Sand Market Revenues & Volume, By Less Than 40 Mesh, 2022-2032F |
| 6.1.4 Saudi Arabia Industrial Silica Sand Market Revenues & Volume, By 40-70 Mesh, 2022-2032F |
| 6.1.5 Saudi Arabia Industrial Silica Sand Market Revenues & Volume, By More Than 70 Mesh, 2022-2032F |
| 6.2 Saudi Arabia Industrial Silica Sand Market, By Application |
| 6.2.1 Overview and Analysis |
| 6.2.2 Saudi Arabia Industrial Silica Sand Market Revenues & Volume, By Hydraulic Fracturing, 2022-2032F |
| 6.2.3 Saudi Arabia Industrial Silica Sand Market Revenues & Volume, By Glassmaking, 2022-2032F |
| 6.2.4 Saudi Arabia Industrial Silica Sand Market Revenues & Volume, By Foundry, 2022-2032F |
| 6.2.5 Saudi Arabia Industrial Silica Sand Market Revenues & Volume, By Ceramics and Refractories, 2022-2032F |
| 6.2.6 Saudi Arabia Industrial Silica Sand Market Revenues & Volume, By Others, 2022-2032F |
| 7 Saudi Arabia Industrial Silica Sand Market Import-Export Trade Statistics |
| 7.1 Saudi Arabia Industrial Silica Sand Market Export to Major Countries |
| 7.2 Saudi Arabia Industrial Silica Sand Market Imports from Major Countries |
| 8 Saudi Arabia Industrial Silica Sand Market Key Performance Indicators |
| 8.1 Average selling price of industrial silica sand in Saudi Arabia. |
| 8.2 Volume of industrial silica sand imports and exports in the region. |
| 8.3 Number of new construction projects and industrial developments in Saudi Arabia that require silica sand. |
| 9 Saudi Arabia Industrial Silica Sand Market - Opportunity Assessment |
| 9.1 Saudi Arabia Industrial Silica Sand Market Opportunity Assessment, By Classification, 2022 & 2032F |
| 9.2 Saudi Arabia Industrial Silica Sand Market Opportunity Assessment, By Application, 2022 & 2032F |
| 10 Saudi Arabia Industrial Silica Sand Market - Competitive Landscape |
| 10.1 Saudi Arabia Industrial Silica Sand Market Revenue Share, By Companies, 2025 |
| 10.2 Saudi Arabia Industrial Silica Sand Market Competitive Benchmarking, By Operating and Technical Parameters |
| 11 Company Profiles |
| 12 Recommendations |
| 13 Disclaimer |
Global Go To Market Strategy - 2030
Export potential enables firms to identify high-growth global markets with greater confidence by combining advanced trade intelligence with a structured quantitative methodology. The framework analyzes emerging demand trends and country-level import patterns while integrating macroeconomic and trade datasets such as GDP and population forecasts, bilateral import–export flows, tariff structures, elasticity differentials between developed and developing economies, geographic distance, and import demand projections. Using weighted trade values from 2020–2024 as the base period to project country-to-country export potential for 2030, these inputs are operationalized through calculated drivers such as gravity model parameters, tariff impact factors, and projected GDP per-capita growth. Through an analysis of hidden potentials, demand hotspots, and market conditions that are most favorable to success, this method enables firms to focus on target countries, maximize returns, and global expansion with data, backed by accuracy.
By factoring in the projected importer demand gap that is currently unmet and could be potential opportunity, it identifies the potential for the Exporter (Country) among 190 countries, against the general trade analysis, which identifies the biggest importer or exporter.
To discover high-growth global markets and optimize your business strategy:
Click Here
Pricing
- Single User License$ 1,995
- Department License$ 2,400
- Site License$ 3,120
- Global License$ 3,795

Leadership Perspectives from Industry Events
Search
Thought Leadership and Analyst Meet


Our Clients
6WResearch In News
- India Air Conditioner Market Set for Strong Rebound in 2026 After Weather-Led Correction and GST-Driven Recovery: 6Wresearch
- ADAS in India: How Automatic Emergency Braking, Blind Spot Detection & Driver Monitoring are Transforming Road Safety
- Doha a strategic location for EV manufacturing hub: IPA Qatar
- Demand for luxury TVs surging in the GCC, says Samsung
- Empowering Growth: The Thriving Journey of Bangladesh’s Cable Industry
- Demand for luxury TVs surging in the GCC, says Samsung
Latest Reports
- Nicaragua RPG Gaming Market (2026-2032)
- New Zealand RPG Gaming Market (2026-2032)
- Netherlands RPG Gaming Market (2026-2032)
- Nauru RPG Gaming Market (2026-2032)
- Namibia RPG Gaming Market (2026-2032)
- Mozambique RPG Gaming Market (2026-2032)
- Montenegro RPG Gaming Market (2026-2032)
- Mongolia RPG Gaming Market (2026-2032)
- Monaco RPG Gaming Market (2026-2032)
- Micronesia RPG Gaming Market (2026-2032)
Industry Events and Analyst Meet

EV India Expo 2026

HIMTEX 2026

India Refining Summit 2026

India EV Show 2026

EV tech India Expo 2026
Whitepaper
- Middle East & Africa Commercial Security Market Click here to view more.
- Middle East & Africa Fire Safety Systems & Equipment Market Click here to view more.
- GCC Drone Market Click here to view more.
- Middle East Lighting Fixture Market Click here to view more.
- GCC Physical & Perimeter Security Market Click here to view more.