Seychelles Limb Prosthetics Market (2026-2032) | Revenue, Industry, Growth, Companies, Investment Trends, Demand, Value, Share, Opportunities, Segments, Competitive, Challenges, Segmentation, Strategic Insights, Size, Supply, Analysis, Trends, Strategy, Restraints, Competition, Consumer Insights, Forecast, Drivers, Outlook, Pricing Analysis
Market Forecast By Technology Type (Myoelectric, Microprocessor-Controlled, Cosmetic), By Application (Upper Limb Replacement, Lower Limb Replacement, Aesthetic Restoration, Pediatric Prosthetics), By End User (Amputees, Elderly Patients, Individuals with Limb Loss, Children), By Product Type (Bionic Arms, Prosthetic Knees, Silicone Hands, Modular Limbs) And Competitive Landscape
| Product Code: ETC12536098 | Publication Date: Apr 2025 | Updated Date: Apr 2026 | Product Type: Market Research Report | |
| Publisher: 6Wresearch | Author: Sachin Kumar Rai | No. of Pages: 65 | No. of Figures: 34 | No. of Tables: 19 |
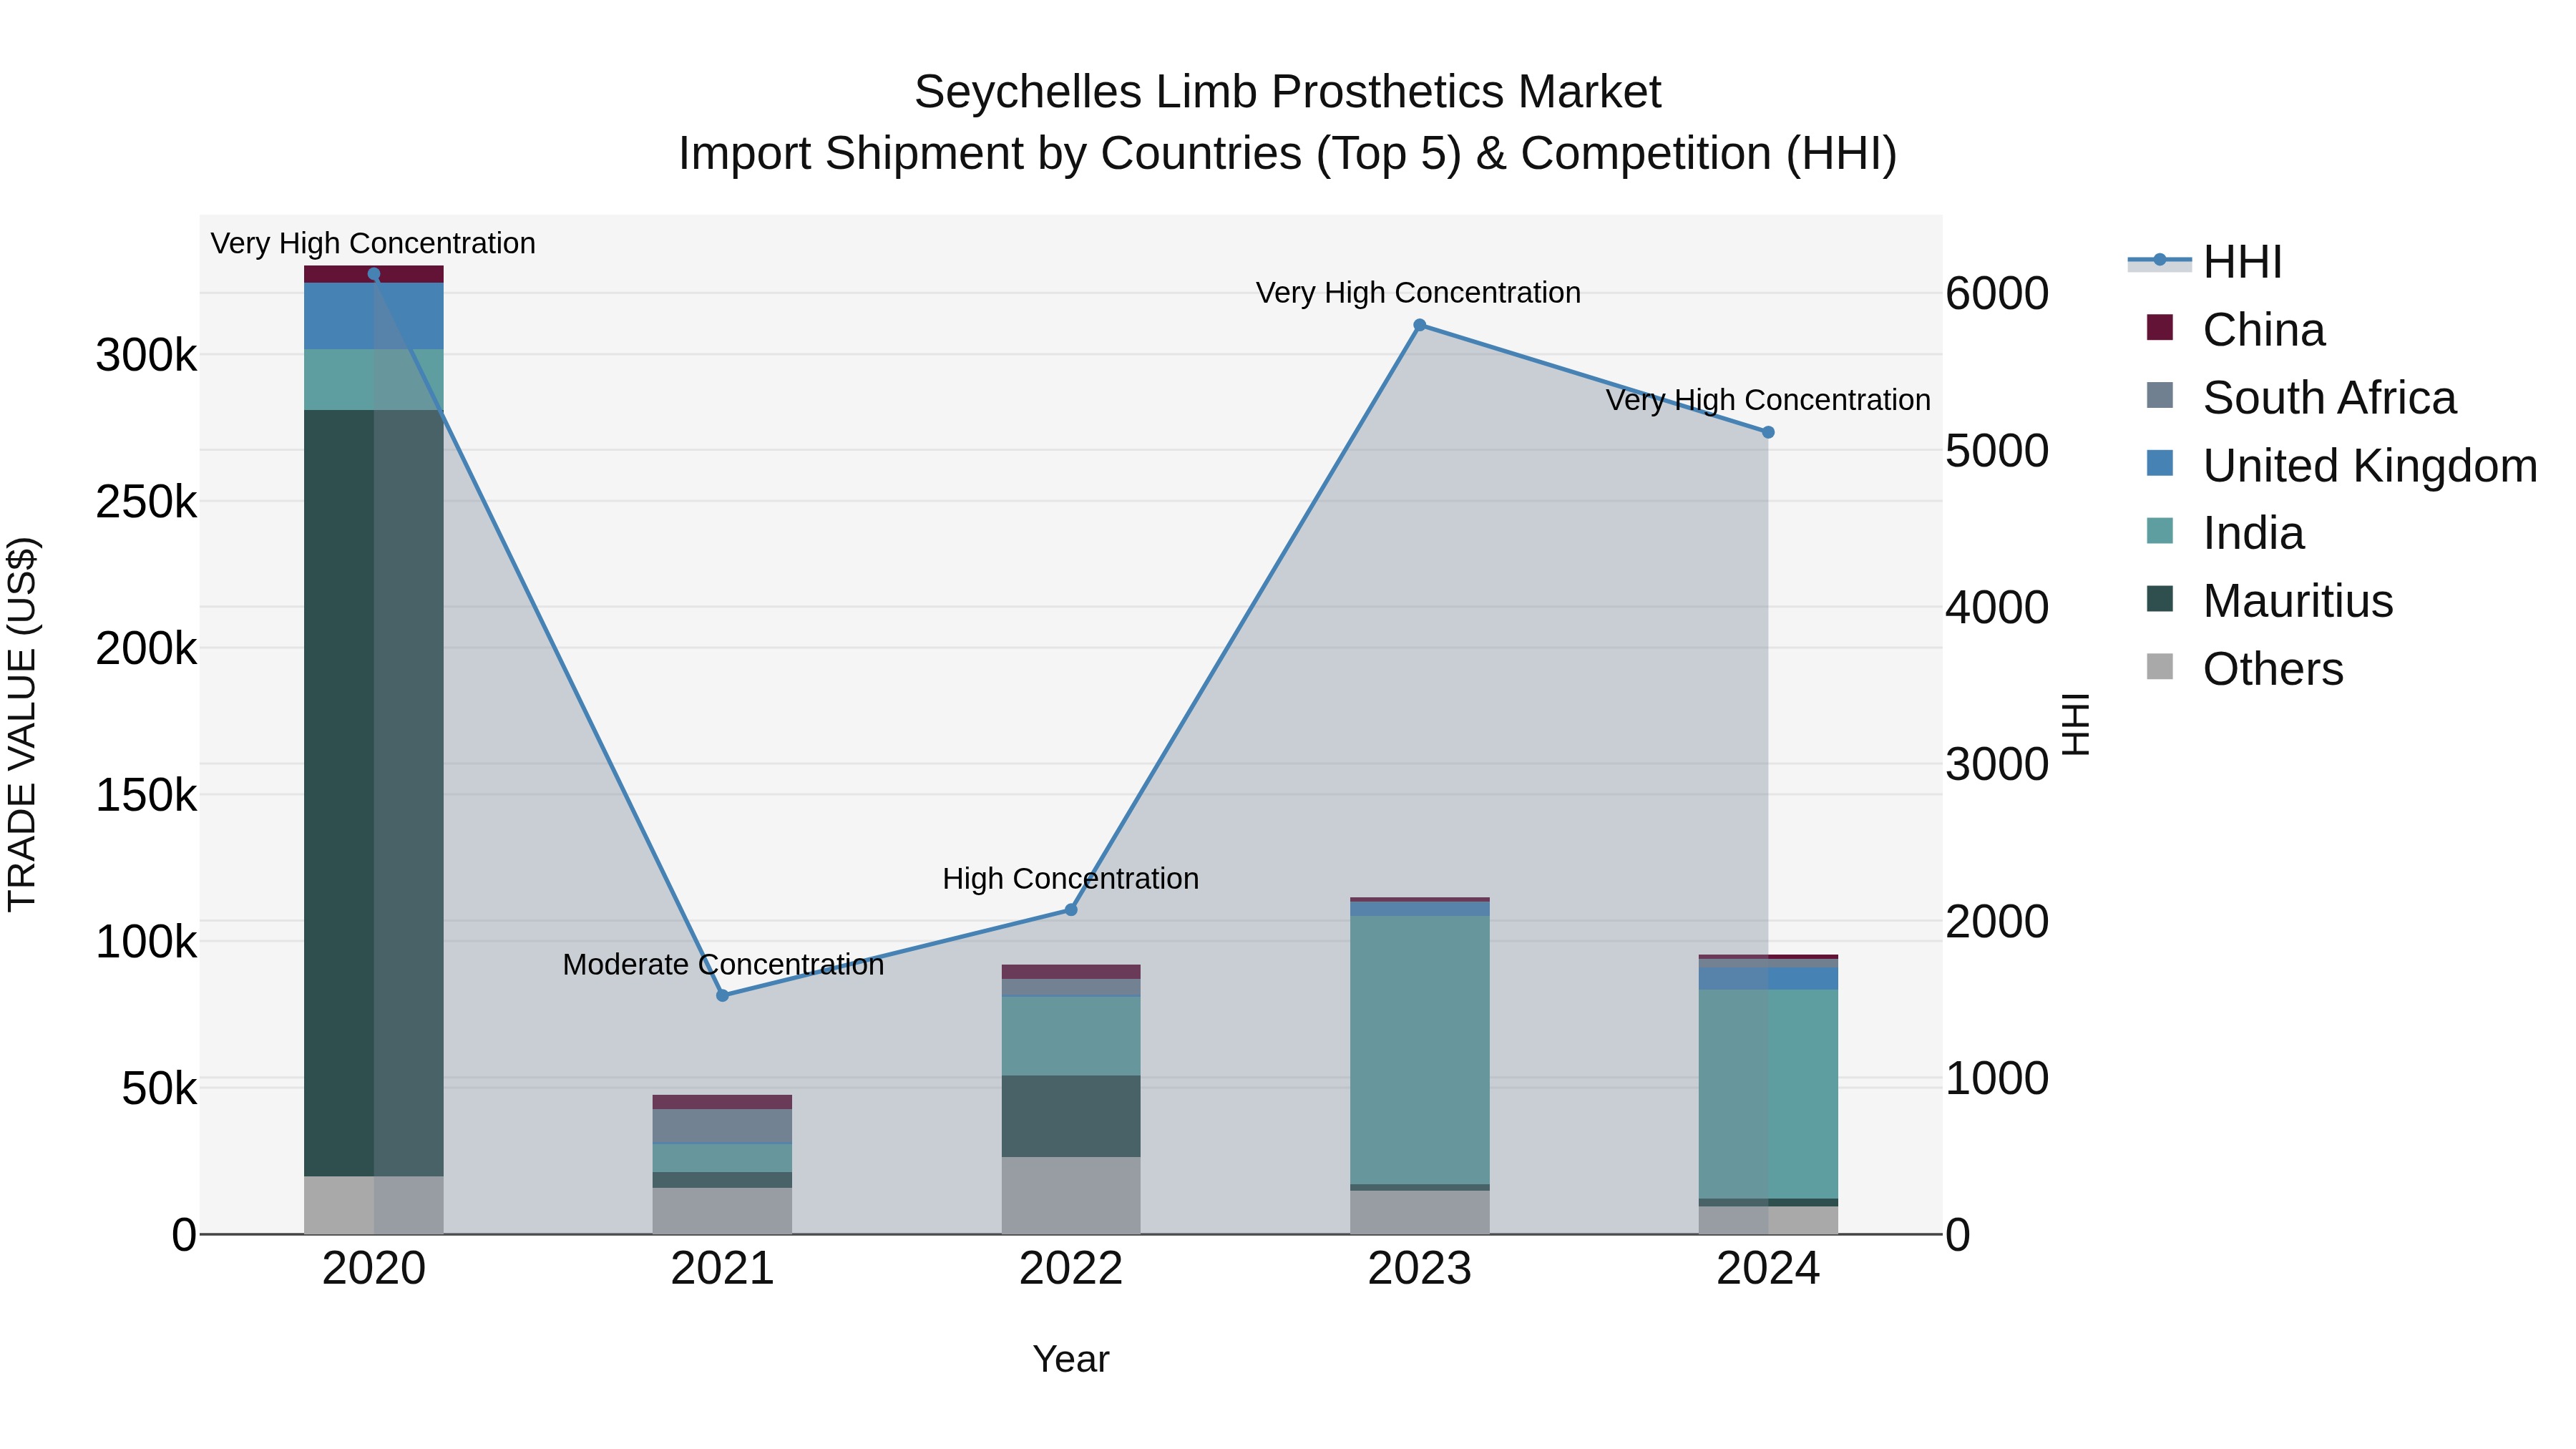
Seychelles Limb Prosthetics Market: Top 5 Importing Countries and Market Competition (HHI) Analysis
Despite the high Herfindahl-Hirschman Index indicating market concentration, the Seychelles limb prosthetics import market in 2024 continued to be dominated by India, United Kingdom, United Arab Emirates, South Africa, and Mauritius. However, the overall market experienced a significant decline with a negative Compound Annual Growth Rate (CAGR) of -26.69% from 2020 to 2024 and a growth rate drop of -17.03% from 2023 to 2024. This suggests a challenging environment for importers and manufacturers in the limb prosthetics industry in Seychelles, requiring strategic considerations for future market participation.
Key Highlights of the Report:
- Seychelles Limb Prosthetics Market Outlook
- Market Size of Seychelles Limb Prosthetics Market, 2025
- Forecast of Seychelles Limb Prosthetics Market, 2032
- Historical Data and Forecast of Seychelles Limb Prosthetics Revenues & Volume for the Period 2022 - 2032F
- Seychelles Limb Prosthetics Market Trend Evolution
- Seychelles Limb Prosthetics Market Drivers and Challenges
- Seychelles Limb Prosthetics Price Trends
- Seychelles Limb Prosthetics Porter's Five Forces
- Seychelles Limb Prosthetics Industry Life Cycle
- Historical Data and Forecast of Seychelles Limb Prosthetics Market Revenues & Volume By Technology Type for the Period 2022 - 2032F
- Historical Data and Forecast of Seychelles Limb Prosthetics Market Revenues & Volume By Myoelectric for the Period 2022 - 2032F
- Historical Data and Forecast of Seychelles Limb Prosthetics Market Revenues & Volume By Microprocessor-Controlled for the Period 2022 - 2032F
- Historical Data and Forecast of Seychelles Limb Prosthetics Market Revenues & Volume By Cosmetic for the Period 2022 - 2032F
- Historical Data and Forecast of Seychelles Limb Prosthetics Market Revenues & Volume By Application for the Period 2022 - 2032F
- Historical Data and Forecast of Seychelles Limb Prosthetics Market Revenues & Volume By Upper Limb Replacement for the Period 2022 - 2032F
- Historical Data and Forecast of Seychelles Limb Prosthetics Market Revenues & Volume By Lower Limb Replacement for the Period 2022 - 2032F
- Historical Data and Forecast of Seychelles Limb Prosthetics Market Revenues & Volume By Aesthetic Restoration for the Period 2022 - 2032F
- Historical Data and Forecast of Seychelles Limb Prosthetics Market Revenues & Volume By Pediatric Prosthetics for the Period 2022 - 2032F
- Historical Data and Forecast of Seychelles Limb Prosthetics Market Revenues & Volume By End User for the Period 2022 - 2032F
- Historical Data and Forecast of Seychelles Limb Prosthetics Market Revenues & Volume By Amputees for the Period 2022 - 2032F
- Historical Data and Forecast of Seychelles Limb Prosthetics Market Revenues & Volume By Elderly Patients for the Period 2022 - 2032F
- Historical Data and Forecast of Seychelles Limb Prosthetics Market Revenues & Volume By Individuals with Limb Loss for the Period 2022 - 2032F
- Historical Data and Forecast of Seychelles Limb Prosthetics Market Revenues & Volume By Children for the Period 2022 - 2032F
- Historical Data and Forecast of Seychelles Limb Prosthetics Market Revenues & Volume By Product Type for the Period 2022 - 2032F
- Historical Data and Forecast of Seychelles Limb Prosthetics Market Revenues & Volume By Bionic Arms for the Period 2022 - 2032F
- Historical Data and Forecast of Seychelles Limb Prosthetics Market Revenues & Volume By Prosthetic Knees for the Period 2022 - 2032F
- Historical Data and Forecast of Seychelles Limb Prosthetics Market Revenues & Volume By Silicone Hands for the Period 2022 - 2032F
- Historical Data and Forecast of Seychelles Limb Prosthetics Market Revenues & Volume By Modular Limbs for the Period 2022 - 2032F
- Seychelles Limb Prosthetics Import Export Trade Statistics
- Market Opportunity Assessment By Technology Type
- Market Opportunity Assessment By Application
- Market Opportunity Assessment By End User
- Market Opportunity Assessment By Product Type
- Seychelles Limb Prosthetics Top Companies Market Share
- Seychelles Limb Prosthetics Competitive Benchmarking By Technical and Operational Parameters
- Seychelles Limb Prosthetics Company Profiles
- Seychelles Limb Prosthetics Key Strategic Recommendations
Frequently Asked Questions About the Market Study (FAQs):
6Wresearch actively monitors the Seychelles Limb Prosthetics Market and publishes its comprehensive annual report, highlighting emerging trends, growth drivers, revenue analysis, and forecast outlook. Our insights help businesses to make data-backed strategic decisions with ongoing market dynamics. Our analysts track relevent industries related to the Seychelles Limb Prosthetics Market, allowing our clients with actionable intelligence and reliable forecasts tailored to emerging regional needs.
Yes, we provide customisation as per your requirements. To learn more, feel free to contact us on sales@6wresearch.com
1 Executive Summary |
2 Introduction |
2.1 Key Highlights of the Report |
2.2 Report Description |
2.3 Market Scope & Segmentation |
2.4 Research Methodology |
2.5 Assumptions |
3 Seychelles Limb Prosthetics Market Overview |
3.1 Seychelles Country Macro Economic Indicators |
3.2 Seychelles Limb Prosthetics Market Revenues & Volume, 2022 & 2032F |
3.3 Seychelles Limb Prosthetics Market - Industry Life Cycle |
3.4 Seychelles Limb Prosthetics Market - Porter's Five Forces |
3.5 Seychelles Limb Prosthetics Market Revenues & Volume Share, By Technology Type, 2022 & 2032F |
3.6 Seychelles Limb Prosthetics Market Revenues & Volume Share, By Application, 2022 & 2032F |
3.7 Seychelles Limb Prosthetics Market Revenues & Volume Share, By End User, 2022 & 2032F |
3.8 Seychelles Limb Prosthetics Market Revenues & Volume Share, By Product Type, 2022 & 2032F |
4 Seychelles Limb Prosthetics Market Dynamics |
4.1 Impact Analysis |
4.2 Market Drivers |
4.2.1 Increasing incidence of limb amputations due to factors such as accidents, diabetes, and vascular diseases. |
4.2.2 Technological advancements leading to the development of more advanced and efficient limb prosthetics. |
4.2.3 Growing awareness about the benefits of using limb prosthetics for improving mobility and quality of life. |
4.3 Market Restraints |
4.3.1 High cost associated with limb prosthetics, limiting access for a significant portion of the population. |
4.3.2 Limited reimbursement policies and insurance coverage for limb prosthetics. |
4.3.3 Lack of skilled professionals and infrastructure for prosthetic fitting and rehabilitation services in Seychelles. |
5 Seychelles Limb Prosthetics Market Trends |
6 Seychelles Limb Prosthetics Market, By Types |
6.1 Seychelles Limb Prosthetics Market, By Technology Type |
6.1.1 Overview and Analysis |
6.1.2 Seychelles Limb Prosthetics Market Revenues & Volume, By Technology Type, 2022 - 2032F |
6.1.3 Seychelles Limb Prosthetics Market Revenues & Volume, By Myoelectric, 2022 - 2032F |
6.1.4 Seychelles Limb Prosthetics Market Revenues & Volume, By Microprocessor-Controlled, 2022 - 2032F |
6.1.5 Seychelles Limb Prosthetics Market Revenues & Volume, By Cosmetic, 2022 - 2032F |
6.2 Seychelles Limb Prosthetics Market, By Application |
6.2.1 Overview and Analysis |
6.2.2 Seychelles Limb Prosthetics Market Revenues & Volume, By Upper Limb Replacement, 2022 - 2032F |
6.2.3 Seychelles Limb Prosthetics Market Revenues & Volume, By Lower Limb Replacement, 2022 - 2032F |
6.2.4 Seychelles Limb Prosthetics Market Revenues & Volume, By Aesthetic Restoration, 2022 - 2032F |
6.2.5 Seychelles Limb Prosthetics Market Revenues & Volume, By Pediatric Prosthetics, 2022 - 2032F |
6.3 Seychelles Limb Prosthetics Market, By End User |
6.3.1 Overview and Analysis |
6.3.2 Seychelles Limb Prosthetics Market Revenues & Volume, By Amputees, 2022 - 2032F |
6.3.3 Seychelles Limb Prosthetics Market Revenues & Volume, By Elderly Patients, 2022 - 2032F |
6.3.4 Seychelles Limb Prosthetics Market Revenues & Volume, By Individuals with Limb Loss, 2022 - 2032F |
6.3.5 Seychelles Limb Prosthetics Market Revenues & Volume, By Children, 2022 - 2032F |
6.4 Seychelles Limb Prosthetics Market, By Product Type |
6.4.1 Overview and Analysis |
6.4.2 Seychelles Limb Prosthetics Market Revenues & Volume, By Bionic Arms, 2022 - 2032F |
6.4.3 Seychelles Limb Prosthetics Market Revenues & Volume, By Prosthetic Knees, 2022 - 2032F |
6.4.4 Seychelles Limb Prosthetics Market Revenues & Volume, By Silicone Hands, 2022 - 2032F |
6.4.5 Seychelles Limb Prosthetics Market Revenues & Volume, By Modular Limbs, 2022 - 2032F |
7 Seychelles Limb Prosthetics Market Import-Export Trade Statistics |
7.1 Seychelles Limb Prosthetics Market Export to Major Countries |
7.2 Seychelles Limb Prosthetics Market Imports from Major Countries |
8 Seychelles Limb Prosthetics Market Key Performance Indicators |
8.1 Average waiting time for prosthetic fitting and rehabilitation services. |
8.2 Number of new amputations recorded annually in Seychelles. |
8.3 Percentage of population with access to affordable and quality prosthetic devices. |
8.4 Patient satisfaction rates with prosthetic devices and services received. |
8.5 Rate of technological adoption in the Seychelles limb prosthetics market. |
9 Seychelles Limb Prosthetics Market - Opportunity Assessment |
9.1 Seychelles Limb Prosthetics Market Opportunity Assessment, By Technology Type, 2022 & 2032F |
9.2 Seychelles Limb Prosthetics Market Opportunity Assessment, By Application, 2022 & 2032F |
9.3 Seychelles Limb Prosthetics Market Opportunity Assessment, By End User, 2022 & 2032F |
9.4 Seychelles Limb Prosthetics Market Opportunity Assessment, By Product Type, 2022 & 2032F |
10 Seychelles Limb Prosthetics Market - Competitive Landscape |
10.1 Seychelles Limb Prosthetics Market Revenue Share, By Companies, 2025 |
10.2 Seychelles Limb Prosthetics Market Competitive Benchmarking, By Operating and Technical Parameters |
11 Company Profiles |
12 Recommendations |
13 Disclaimer |
Global Go To Market Strategy - 2030
Export potential enables firms to identify high-growth global markets with greater confidence by combining advanced trade intelligence with a structured quantitative methodology. The framework analyzes emerging demand trends and country-level import patterns while integrating macroeconomic and trade datasets such as GDP and population forecasts, bilateral import–export flows, tariff structures, elasticity differentials between developed and developing economies, geographic distance, and import demand projections. Using weighted trade values from 2020–2024 as the base period to project country-to-country export potential for 2030, these inputs are operationalized through calculated drivers such as gravity model parameters, tariff impact factors, and projected GDP per-capita growth. Through an analysis of hidden potentials, demand hotspots, and market conditions that are most favorable to success, this method enables firms to focus on target countries, maximize returns, and global expansion with data, backed by accuracy.
By factoring in the projected importer demand gap that is currently unmet and could be potential opportunity, it identifies the potential for the Exporter (Country) among 190 countries, against the general trade analysis, which identifies the biggest importer or exporter.
To discover high-growth global markets and optimize your business strategy:
Click Here
Pricing
- Single User License$ 1,995
- Department License$ 2,400
- Site License$ 3,120
- Global License$ 3,795

Leadership Perspectives from Industry Events
Search
Thought Leadership and Analyst Meet


Our Clients
6WResearch In News
- Doha a strategic location for EV manufacturing hub: IPA Qatar
- Demand for luxury TVs surging in the GCC, says Samsung
- Empowering Growth: The Thriving Journey of Bangladesh’s Cable Industry
- Demand for luxury TVs surging in the GCC, says Samsung
- Video call with a traditional healer? Once unthinkable, it’s now common in South Africa
- Intelligent Buildings To Smooth GCC’s Path To Net Zero
Latest Reports
- New Zealand Aseptic Manufacturing Market (2026-2032)
- Netherlands Aseptic Manufacturing Market (2026-2032)
- Nauru Aseptic Manufacturing Market (2026-2032)
- Namibia Aseptic Manufacturing Market (2026-2032)
- Mozambique Aseptic Manufacturing Market (2026-2032)
- Montenegro Aseptic Manufacturing Market (2026-2032)
- Mongolia Aseptic Manufacturing Market (2026-2032)
- Monaco Aseptic Manufacturing Market (2026-2032)
- Micronesia Aseptic Manufacturing Market (2026-2032)
- Mauritius Aseptic Manufacturing Market (2026-2032)
Industry Events and Analyst Meet

HIMTEX 2026

India Refining Summit 2026

India EV Show 2026

EV tech India Expo 2026

Auto Tech Asia 2026
Whitepaper
- Middle East & Africa Commercial Security Market Click here to view more.
- Middle East & Africa Fire Safety Systems & Equipment Market Click here to view more.
- GCC Drone Market Click here to view more.
- Middle East Lighting Fixture Market Click here to view more.
- GCC Physical & Perimeter Security Market Click here to view more.