Sierra Leone Pillow Market (2025-2031) | Segmentation, Revenue, Size, Growth, Trends, Outlook, Analysis, Value, Industry, Forecast, Share & Companies
Market Forecast By Material (100% Cotton, 100% Bamboo Fiber, 100% Silk, 100% Polyester, Others), By Filling Material (Memory Foam, Hollow Fibre, Latex, Microfiber, Others), By Shape (Square, U-Shape, Rectangle, Wave, Round, Convex, Others), By Feature (Therapy, Cooling, Anit-Static, Anti-Bacteria, Others) And Competitive Landscape
| Product Code: ETC5522374 | Publication Date: Nov 2023 | Updated Date: Oct 2025 | Product Type: Market Research Report | |
| Publisher: 6Wresearch | Author: Ravi Bhandari | No. of Pages: 60 | No. of Figures: 30 | No. of Tables: 5 |
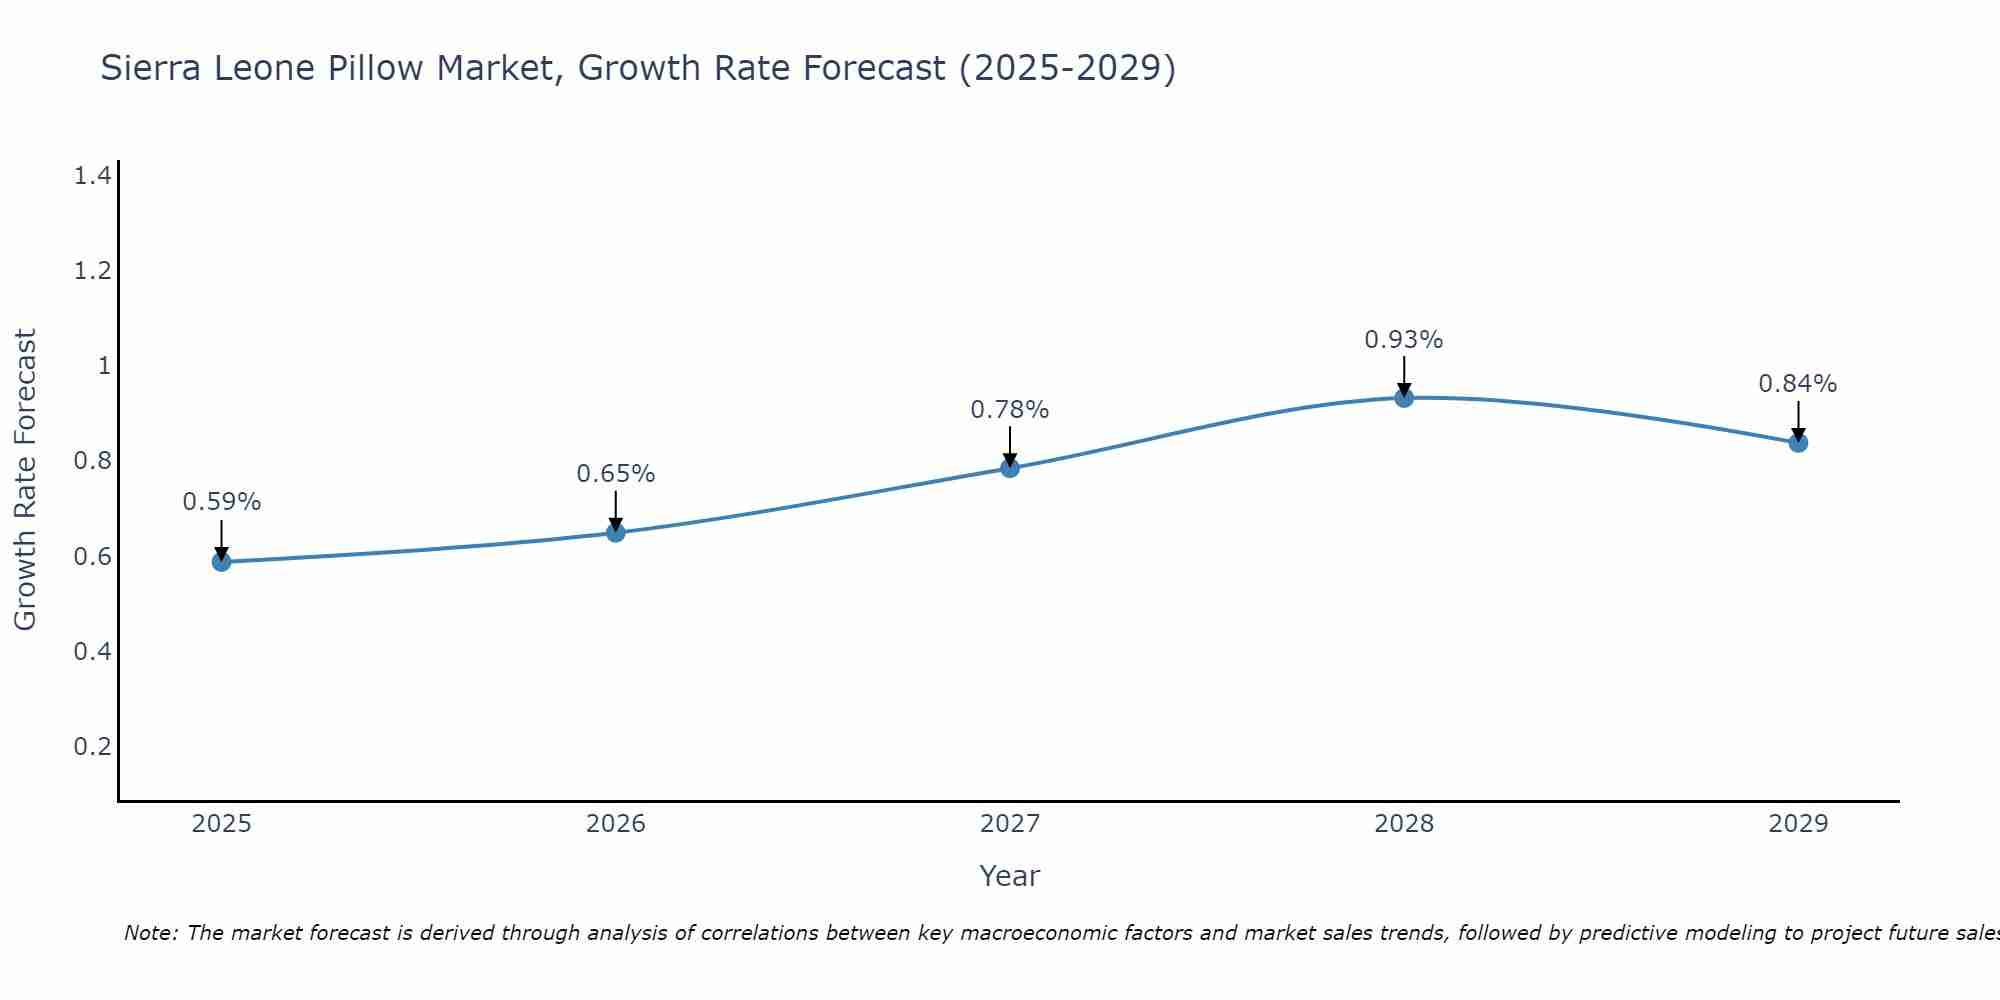
Sierra Leone Pillow Market Size Growth Rate
The Sierra Leone Pillow Market is projected to witness mixed growth rate patterns during 2025 to 2029. Growth accelerates to 0.93% in 2028, following an initial rate of 0.59%, before easing to 0.84% at the end of the period.
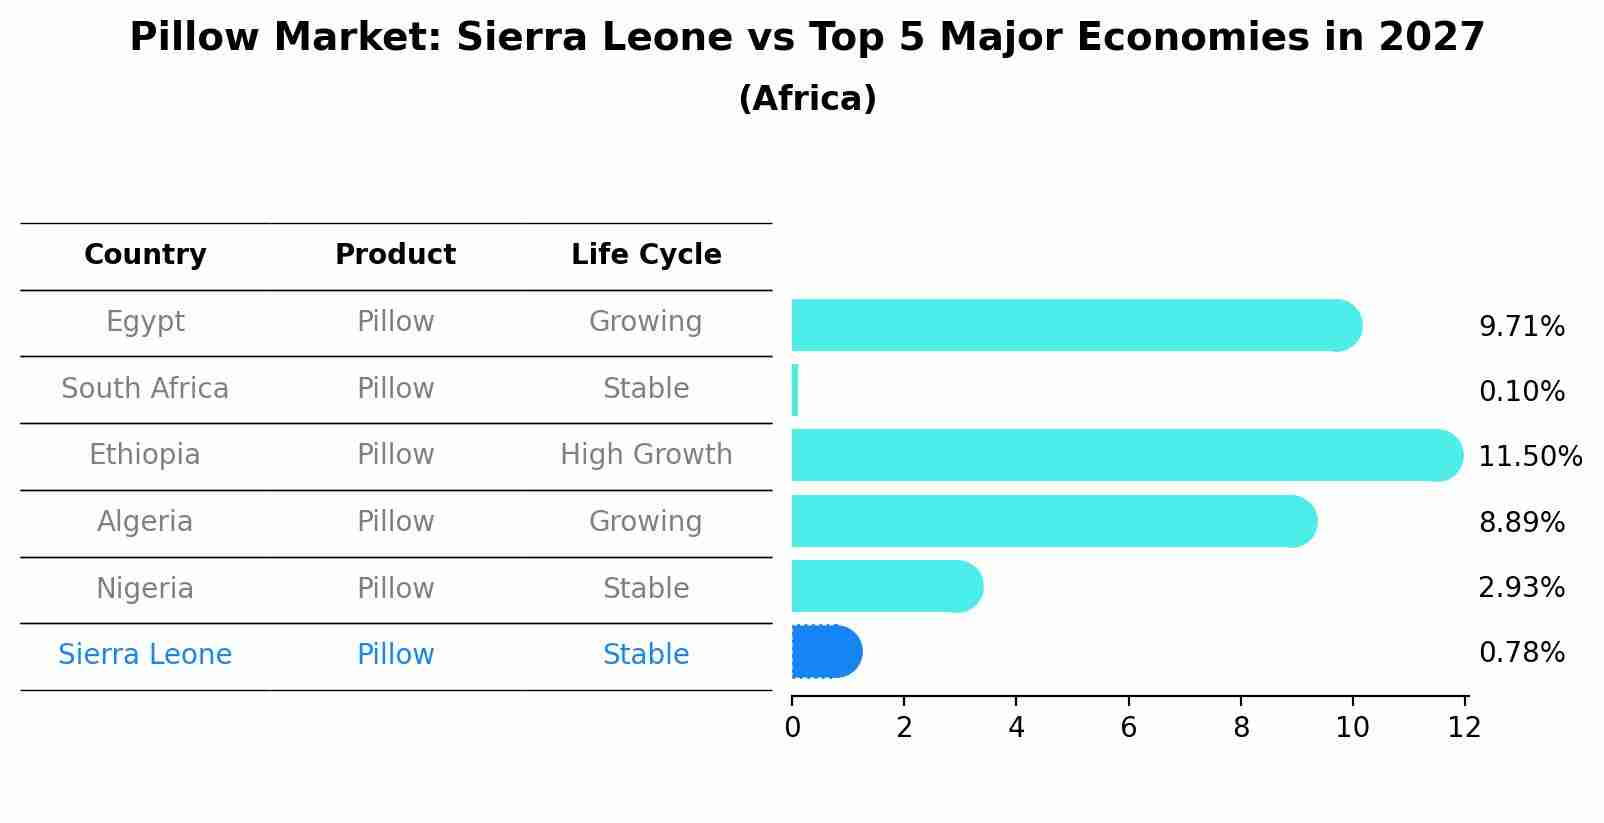
Pillow Market: Sierra Leone vs Top 5 Major Economies in 2027 (Africa)
In the Africa region, the Pillow market in Sierra Leone is projected to expand at a stable growth rate of 0.78% by 2027. The largest economy is Egypt, followed by South Africa, Ethiopia, Algeria and Nigeria.
Key Highlights of the Report:
- Sierra Leone Pillow Market Outlook
- Market Size of Sierra Leone Pillow Market, 2024
- Forecast of Sierra Leone Pillow Market, 2031
- Historical Data and Forecast of Sierra Leone Pillow Revenues & Volume for the Period 2021-2031
- Sierra Leone Pillow Market Trend Evolution
- Sierra Leone Pillow Market Drivers and Challenges
- Sierra Leone Pillow Price Trends
- Sierra Leone Pillow Porter`s Five Forces
- Sierra Leone Pillow Industry Life Cycle
- Historical Data and Forecast of Sierra Leone Pillow Market Revenues & Volume By Material for the Period 2021-2031
- Historical Data and Forecast of Sierra Leone Pillow Market Revenues & Volume By 100% Cotton for the Period 2021-2031
- Historical Data and Forecast of Sierra Leone Pillow Market Revenues & Volume By 100% Bamboo Fiber for the Period 2021-2031
- Historical Data and Forecast of Sierra Leone Pillow Market Revenues & Volume By 100% Silk for the Period 2021-2031
- Historical Data and Forecast of Sierra Leone Pillow Market Revenues & Volume By 100% Polyester for the Period 2021-2031
- Historical Data and Forecast of Sierra Leone Pillow Market Revenues & Volume By Others for the Period 2021-2031
- Historical Data and Forecast of Sierra Leone Pillow Market Revenues & Volume By Filling Material for the Period 2021-2031
- Historical Data and Forecast of Sierra Leone Pillow Market Revenues & Volume By Memory Foam for the Period 2021-2031
- Historical Data and Forecast of Sierra Leone Pillow Market Revenues & Volume By Hollow Fibre for the Period 2021-2031
- Historical Data and Forecast of Sierra Leone Pillow Market Revenues & Volume By Latex for the Period 2021-2031
- Historical Data and Forecast of Sierra Leone Pillow Market Revenues & Volume By Microfiber for the Period 2021-2031
- Historical Data and Forecast of Sierra Leone Pillow Market Revenues & Volume By Others for the Period 2021-2031
- Historical Data and Forecast of Sierra Leone Pillow Market Revenues & Volume By Shape for the Period 2021-2031
- Historical Data and Forecast of Sierra Leone Pillow Market Revenues & Volume By Square for the Period 2021-2031
- Historical Data and Forecast of Sierra Leone Pillow Market Revenues & Volume By U-Shape for the Period 2021-2031
- Historical Data and Forecast of Sierra Leone Pillow Market Revenues & Volume By Rectangle for the Period 2021-2031
- Historical Data and Forecast of Sierra Leone Pillow Market Revenues & Volume By Wave for the Period 2021-2031
- Historical Data and Forecast of Sierra Leone Pillow Market Revenues & Volume By Round for the Period 2021-2031
- Historical Data and Forecast of Sierra Leone Pillow Market Revenues & Volume By Convex for the Period 2021-2031
- Historical Data and Forecast of Sierra Leone Pillow Market Revenues & Volume By Others for the Period 2021-2031
- Historical Data and Forecast of Sierra Leone Pillow Market Revenues & Volume By Feature for the Period 2021-2031
- Historical Data and Forecast of Sierra Leone Pillow Market Revenues & Volume By Therapy for the Period 2021-2031
- Historical Data and Forecast of Sierra Leone Pillow Market Revenues & Volume By Cooling for the Period 2021-2031
- Historical Data and Forecast of Sierra Leone Pillow Market Revenues & Volume By Anit-Static for the Period 2021-2031
- Historical Data and Forecast of Sierra Leone Pillow Market Revenues & Volume By Anti-Bacteria for the Period 2021-2031
- Historical Data and Forecast of Sierra Leone Pillow Market Revenues & Volume By Others for the Period 2021-2031
- Sierra Leone Pillow Import Export Trade Statistics
- Market Opportunity Assessment By Material
- Market Opportunity Assessment By Filling Material
- Market Opportunity Assessment By Shape
- Market Opportunity Assessment By Feature
- Sierra Leone Pillow Top Companies Market Share
- Sierra Leone Pillow Competitive Benchmarking By Technical and Operational Parameters
- Sierra Leone Pillow Company Profiles
- Sierra Leone Pillow Key Strategic Recommendations
Frequently Asked Questions About the Market Study (FAQs):
6Wresearch actively monitors the Sierra Leone Pillow Market and publishes its comprehensive annual report, highlighting emerging trends, growth drivers, revenue analysis, and forecast outlook. Our insights help businesses to make data-backed strategic decisions with ongoing market dynamics. Our analysts track relevent industries related to the Sierra Leone Pillow Market, allowing our clients with actionable intelligence and reliable forecasts tailored to emerging regional needs.
Yes, we provide customisation as per your requirements. To learn more, feel free to contact us on sales@6wresearch.com
1 Executive Summary |
2 Introduction |
2.1 Key Highlights of the Report |
2.2 Report Description |
2.3 Market Scope & Segmentation |
2.4 Research Methodology |
2.5 Assumptions |
3 Sierra Leone Pillow Market Overview |
3.1 Sierra Leone Country Macro Economic Indicators |
3.2 Sierra Leone Pillow Market Revenues & Volume, 2021 & 2031F |
3.3 Sierra Leone Pillow Market - Industry Life Cycle |
3.4 Sierra Leone Pillow Market - Porter's Five Forces |
3.5 Sierra Leone Pillow Market Revenues & Volume Share, By Material, 2021 & 2031F |
3.6 Sierra Leone Pillow Market Revenues & Volume Share, By Filling Material, 2021 & 2031F |
3.7 Sierra Leone Pillow Market Revenues & Volume Share, By Shape, 2021 & 2031F |
3.8 Sierra Leone Pillow Market Revenues & Volume Share, By Feature, 2021 & 2031F |
4 Sierra Leone Pillow Market Dynamics |
4.1 Impact Analysis |
4.2 Market Drivers |
4.2.1 Increasing urbanization and rising disposable income in Sierra Leone leading to higher demand for home decor and comfort products like pillows. |
4.2.2 Growing awareness about the importance of good quality sleep and the role of pillows in enhancing sleep quality. |
4.2.3 Expansion of retail channels and e-commerce platforms increasing the accessibility of pillows to a wider consumer base in Sierra Leone. |
4.3 Market Restraints |
4.3.1 Price sensitivity among consumers in Sierra Leone, limiting the adoption of higher-priced premium pillows. |
4.3.2 Limited availability of locally produced high-quality pillows, leading to dependence on imports which can be affected by currency fluctuations and supply chain disruptions. |
5 Sierra Leone Pillow Market Trends |
6 Sierra Leone Pillow Market Segmentations |
6.1 Sierra Leone Pillow Market, By Material |
6.1.1 Overview and Analysis |
6.1.2 Sierra Leone Pillow Market Revenues & Volume, By 100% Cotton, 2021-2031F |
6.1.3 Sierra Leone Pillow Market Revenues & Volume, By 100% Bamboo Fiber, 2021-2031F |
6.1.4 Sierra Leone Pillow Market Revenues & Volume, By 100% Silk, 2021-2031F |
6.1.5 Sierra Leone Pillow Market Revenues & Volume, By 100% Polyester, 2021-2031F |
6.1.6 Sierra Leone Pillow Market Revenues & Volume, By Others, 2021-2031F |
6.2 Sierra Leone Pillow Market, By Filling Material |
6.2.1 Overview and Analysis |
6.2.2 Sierra Leone Pillow Market Revenues & Volume, By Memory Foam, 2021-2031F |
6.2.3 Sierra Leone Pillow Market Revenues & Volume, By Hollow Fibre, 2021-2031F |
6.2.4 Sierra Leone Pillow Market Revenues & Volume, By Latex, 2021-2031F |
6.2.5 Sierra Leone Pillow Market Revenues & Volume, By Microfiber, 2021-2031F |
6.2.6 Sierra Leone Pillow Market Revenues & Volume, By Others, 2021-2031F |
6.3 Sierra Leone Pillow Market, By Shape |
6.3.1 Overview and Analysis |
6.3.2 Sierra Leone Pillow Market Revenues & Volume, By Square, 2021-2031F |
6.3.3 Sierra Leone Pillow Market Revenues & Volume, By U-Shape, 2021-2031F |
6.3.4 Sierra Leone Pillow Market Revenues & Volume, By Rectangle, 2021-2031F |
6.3.5 Sierra Leone Pillow Market Revenues & Volume, By Wave, 2021-2031F |
6.3.6 Sierra Leone Pillow Market Revenues & Volume, By Round, 2021-2031F |
6.3.7 Sierra Leone Pillow Market Revenues & Volume, By Convex, 2021-2031F |
6.4 Sierra Leone Pillow Market, By Feature |
6.4.1 Overview and Analysis |
6.4.2 Sierra Leone Pillow Market Revenues & Volume, By Therapy, 2021-2031F |
6.4.3 Sierra Leone Pillow Market Revenues & Volume, By Cooling, 2021-2031F |
6.4.4 Sierra Leone Pillow Market Revenues & Volume, By Anit-Static, 2021-2031F |
6.4.5 Sierra Leone Pillow Market Revenues & Volume, By Anti-Bacteria, 2021-2031F |
6.4.6 Sierra Leone Pillow Market Revenues & Volume, By Others, 2021-2031F |
7 Sierra Leone Pillow Market Import-Export Trade Statistics |
7.1 Sierra Leone Pillow Market Export to Major Countries |
7.2 Sierra Leone Pillow Market Imports from Major Countries |
8 Sierra Leone Pillow Market Key Performance Indicators |
8.1 Average order value (AOV) of pillow purchases in Sierra Leone, indicating the willingness of consumers to spend on pillows. |
8.2 Percentage of repeat customers buying pillows, showing customer satisfaction and loyalty towards pillow brands. |
8.3 Number of new pillow designs or materials introduced in the market, reflecting innovation and diversification within the Sierra Leone pillow market. |
8.4 Customer satisfaction ratings and reviews for pillow products, indicating the perceived quality and performance of pillows in the market. |
8.5 Growth in the number of retail outlets or e-commerce platforms selling pillows in Sierra Leone, demonstrating market expansion and accessibility. |
9 Sierra Leone Pillow Market - Opportunity Assessment |
9.1 Sierra Leone Pillow Market Opportunity Assessment, By Material, 2021 & 2031F |
9.2 Sierra Leone Pillow Market Opportunity Assessment, By Filling Material, 2021 & 2031F |
9.3 Sierra Leone Pillow Market Opportunity Assessment, By Shape, 2021 & 2031F |
9.4 Sierra Leone Pillow Market Opportunity Assessment, By Feature, 2021 & 2031F |
10 Sierra Leone Pillow Market - Competitive Landscape |
10.1 Sierra Leone Pillow Market Revenue Share, By Companies, 2024 |
10.2 Sierra Leone Pillow Market Competitive Benchmarking, By Operating and Technical Parameters |
11 Company Profiles |
12 Recommendations | 13 Disclaimer |
Export potential assessment - trade Analytics for 2030
Export potential enables firms to identify high-growth global markets with greater confidence by combining advanced trade intelligence with a structured quantitative methodology. The framework analyzes emerging demand trends and country-level import patterns while integrating macroeconomic and trade datasets such as GDP and population forecasts, bilateral import–export flows, tariff structures, elasticity differentials between developed and developing economies, geographic distance, and import demand projections. Using weighted trade values from 2020–2024 as the base period to project country-to-country export potential for 2030, these inputs are operationalized through calculated drivers such as gravity model parameters, tariff impact factors, and projected GDP per-capita growth. Through an analysis of hidden potentials, demand hotspots, and market conditions that are most favorable to success, this method enables firms to focus on target countries, maximize returns, and global expansion with data, backed by accuracy.
By factoring in the projected importer demand gap that is currently unmet and could be potential opportunity, it identifies the potential for the Exporter (Country) among 190 countries, against the general trade analysis, which identifies the biggest importer or exporter.
To discover high-growth global markets and optimize your business strategy:
Click Here
Pricing
- Single User License$ 1,995
- Department License$ 2,400
- Site License$ 3,120
- Global License$ 3,795

Search
Thought Leadership and Analyst Meet


Our Clients
Latest Reports
- India Ultrasonic Smart Water Meter Market (2026-2032) | Outlook, Competition, Drivers, Trends, Demand, Competitive, Strategic Insights, Companies, Challenges, Strategy, Consumer Insights, Analysis, Opportunities, Growth, Size, Share, Industry, Revenue, Segments, Value, Segmentation, Supply, Forecast, Restraints,
- India Electromagnetic Bulk Flow Meter Market (2026-2032) | Analysis, Challenges, Strategic Insights, Supply, Forecast, Growth, Share, Consumer Insights, Competitive, Value, Outlook, Size & Demand,
- India Battery Powered Bulk Flow Meter Market (2026-2032) | Outlook, Analysis, Competitive Landscape, Growth, Size, Trends, Value, Revenue, Companies, Segmentation, Share & Forecast
- Bosnia and Herzegovina Fuel-Efficient Winglets Market (2026-2032) | Growth, Competition, Strategy, Restraints, Trends, Challenges, segmentation, Value, Outlook, Investment Opportunities, Analysis, Revenue, Companies, Insights, Pricing, Size, Drivers, Demand, Share, Forecast
- Canada Cloud CFD Market (2026-2032) | Size & Revenue, Industry, Growth, Competitive Landscape, Forecast, Segmentation, Value, Outlook, Trends, Share, Analysis, Companies
- Taiwan Food Delivery Platform Market (2026-2032) | Companies, Outlook, Analysis, Trends, Value, Revenue, Segmentation, Share, Forecast, Competitive Landscape, Growth, Size & Forecast
- United Kingdom (UK) Long-term Care Insurance Market (2026-2032) | Growth, Share, Consumer Insights, Drivers, Opportunities, Competition, Pricing Analysis, Segments, Restraints, Companies, Competitive, Value, Outlook, Size, Demand, Analysis, Challenges, Strategic Insights, Investment Trends, Revenue, Trends, Supply, Forecast
- United Kingdom (UK) Long Term Care Market (2026-2032) | Companies, Outlook, Analysis, Trends, Value, Revenue, Segmentation, Share, Forecast, Competitive Landscape, Growth, Size & Forecast
- Iraq Insulation and Waterproofing Market (2026-2032) | Outlook, Drivers, Growth, Size, Share, Industry, Revenue, Trends, Demand, Competitive, Strategic Insights, Opportunities, Segments, Companies, Challenges, Strategy, Consumer Insights, Analysis, Investment Trends, Value, Segmentation, Forecast, Restraints
- India Switchgear Market Outlook (2026-2032) | Size, Share, Trends, Growth, Revenue, Forecast, Analysis, Value, Outlook
Industry Events and Analyst Meet

India EV Show 2026

EV tech India Expo 2026

Auto Tech Asia 2026

Battery Tech India 2026

Smart Production Solutions Guangzhou 2026
Whitepaper
- Middle East & Africa Commercial Security Market Click here to view more.
- Middle East & Africa Fire Safety Systems & Equipment Market Click here to view more.
- GCC Drone Market Click here to view more.
- Middle East Lighting Fixture Market Click here to view more.
- GCC Physical & Perimeter Security Market Click here to view more.
6WResearch In News
- Doha a strategic location for EV manufacturing hub: IPA Qatar
- Demand for luxury TVs surging in the GCC, says Samsung
- Empowering Growth: The Thriving Journey of Bangladesh’s Cable Industry
- Demand for luxury TVs surging in the GCC, says Samsung
- Video call with a traditional healer? Once unthinkable, it’s now common in South Africa
- Intelligent Buildings To Smooth GCC’s Path To Net Zero