Singapore Amplifier Market (2024-2030) | Forecast, Outlook, Trends, Industry, Revenue, Share, Analysis, Companies, Size, Growth & Value
Market Forecast By Type (Class-A, Class-B, Class-A/B, Class-G&H, Class-D), By ???l???t??n (??n?um?r ?ud??, ?ut?m?t?v? ?ud??, ??m?ut?r ?ud??, ?nt?r?r??? ?ud??) And Competitive Landscape
| Product Code: ETC028427 | Publication Date: Jul 2023 | Updated Date: Feb 2026 | Product Type: Report | |
| Publisher: 6Wresearch | Author: Ravi Bhandari | No. of Pages: 70 | No. of Figures: 35 | No. of Tables: 5 |
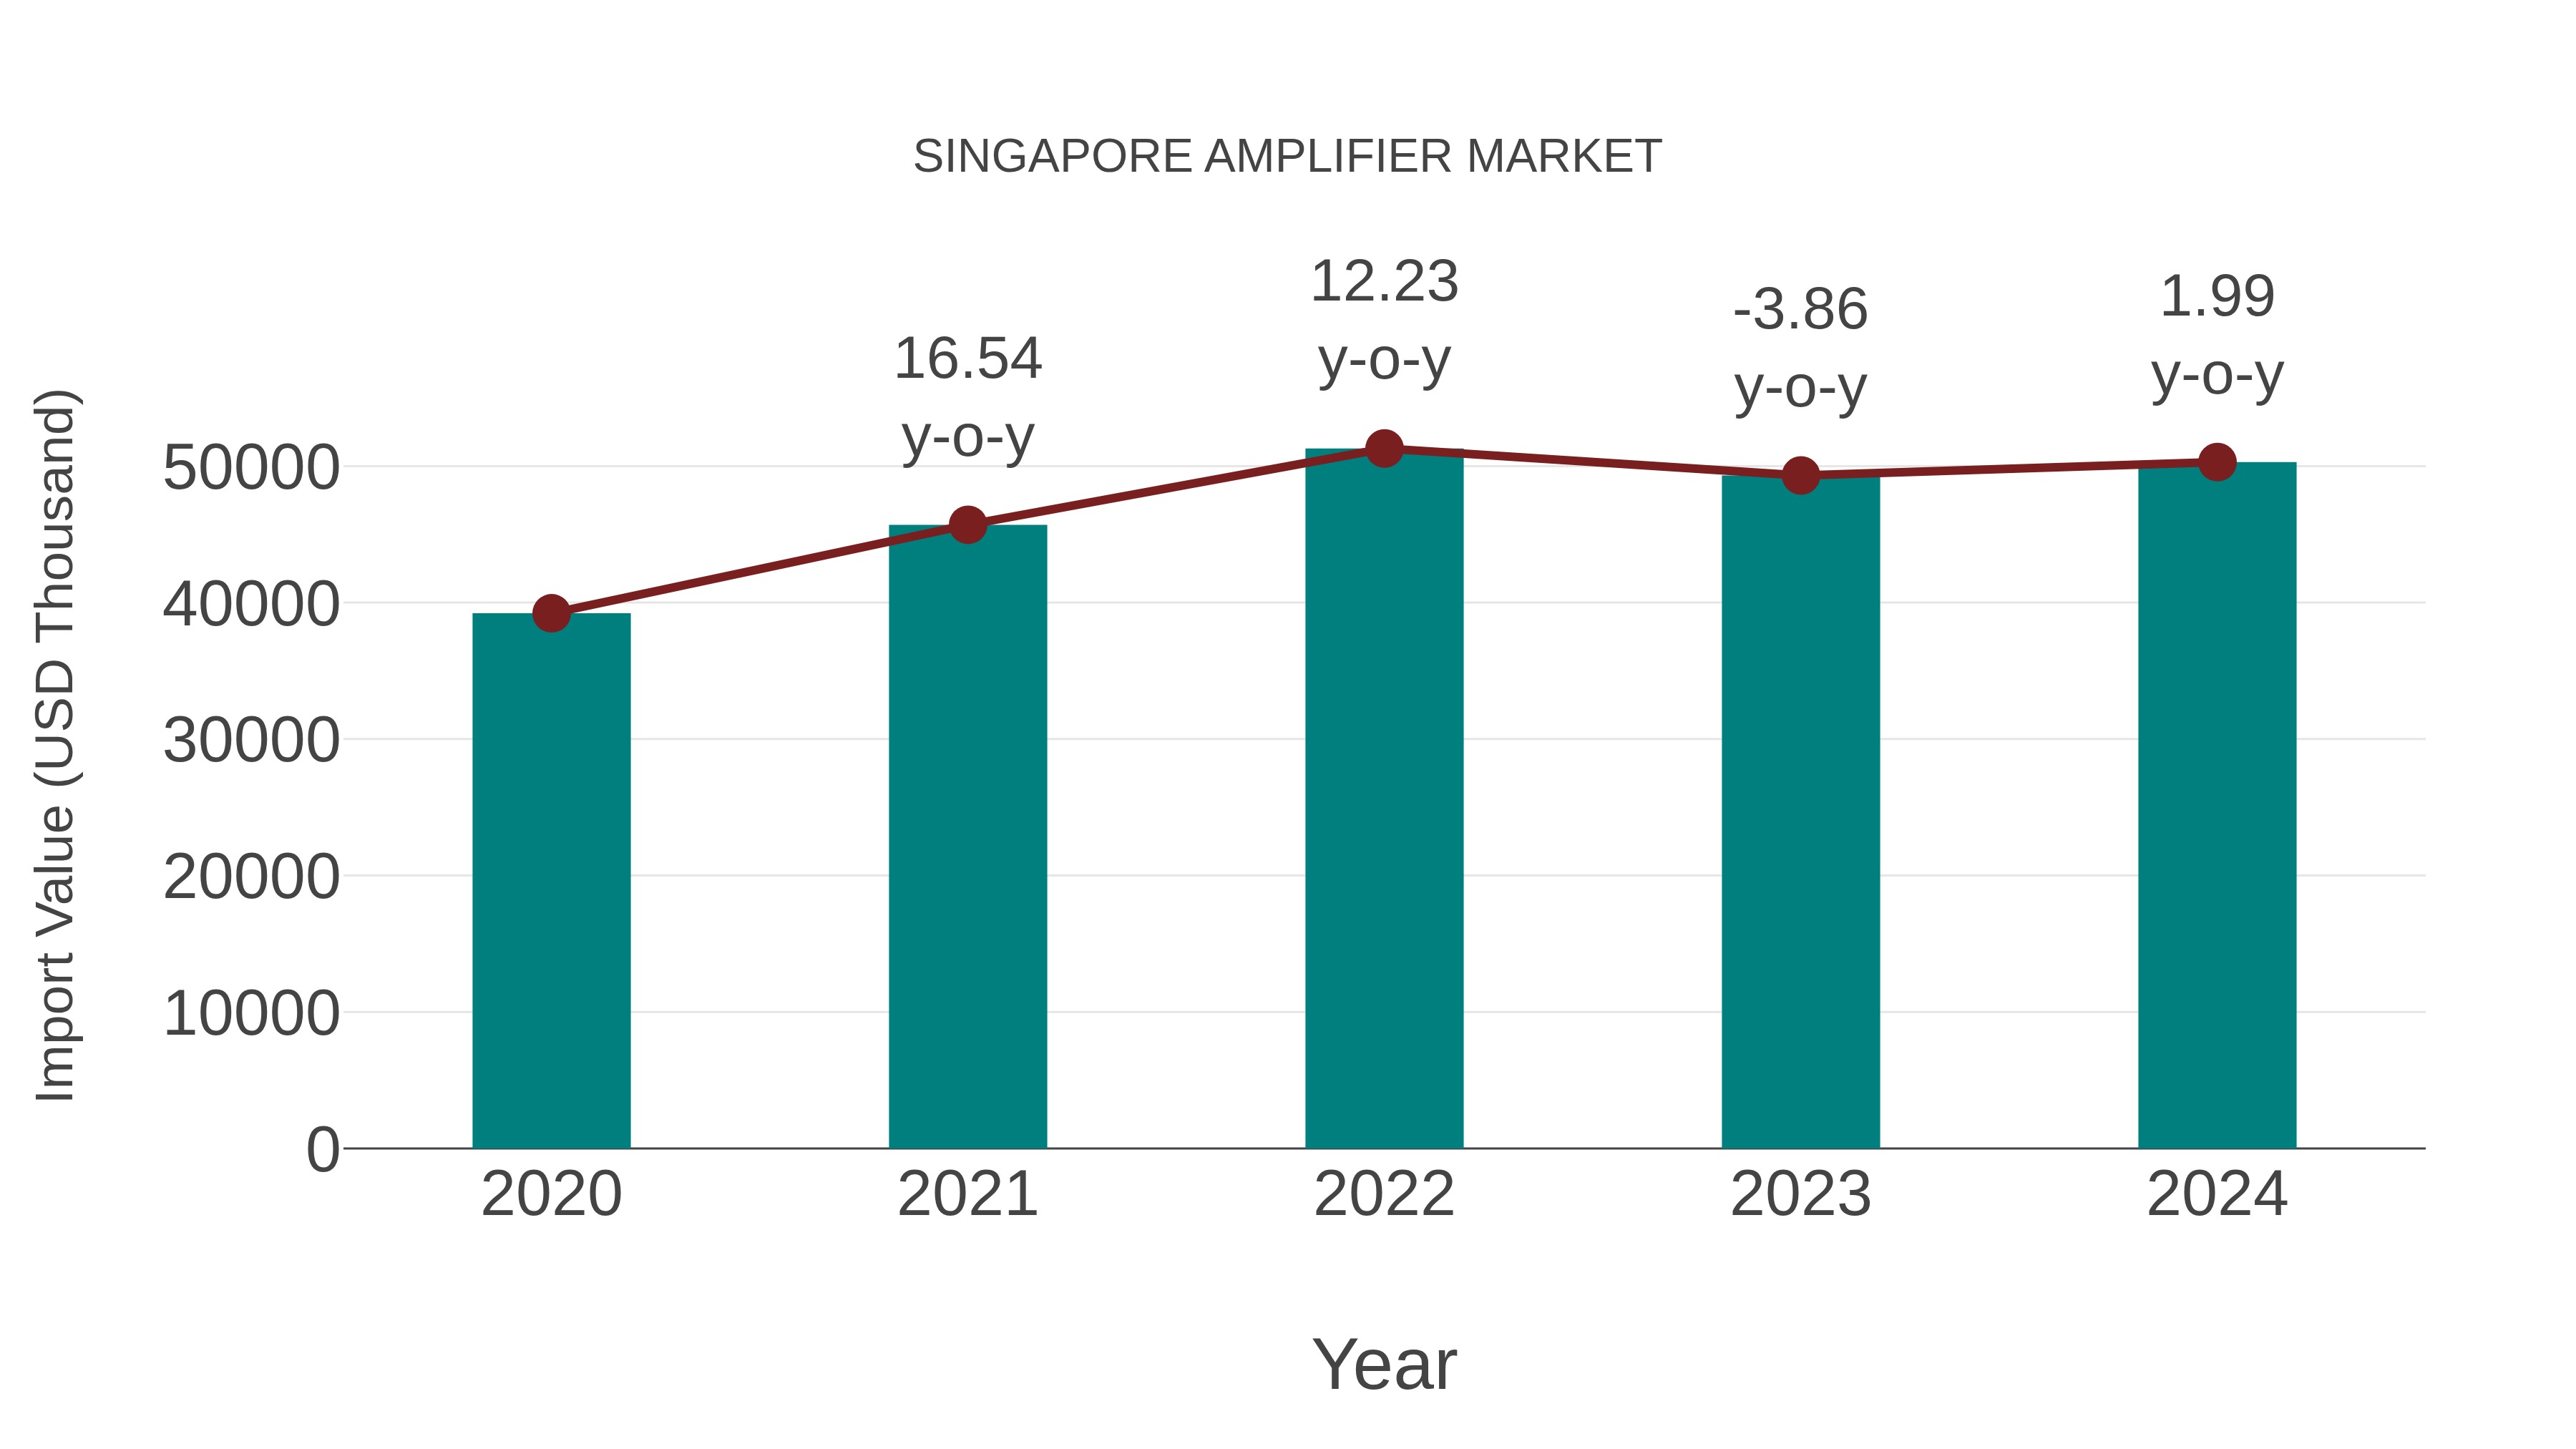
Singapore Amplifier Market: Import Trend Analysis
In the Singapore amplifier market, the import trend showed a growth rate of 1.99% from 2023 to 2024, with a compound annual growth rate (CAGR) of 6.42% from 2020 to 2024. This indicates a stable import momentum in the market, likely influenced by consistent demand for amplifier products and a steady trade policy environment during this period.
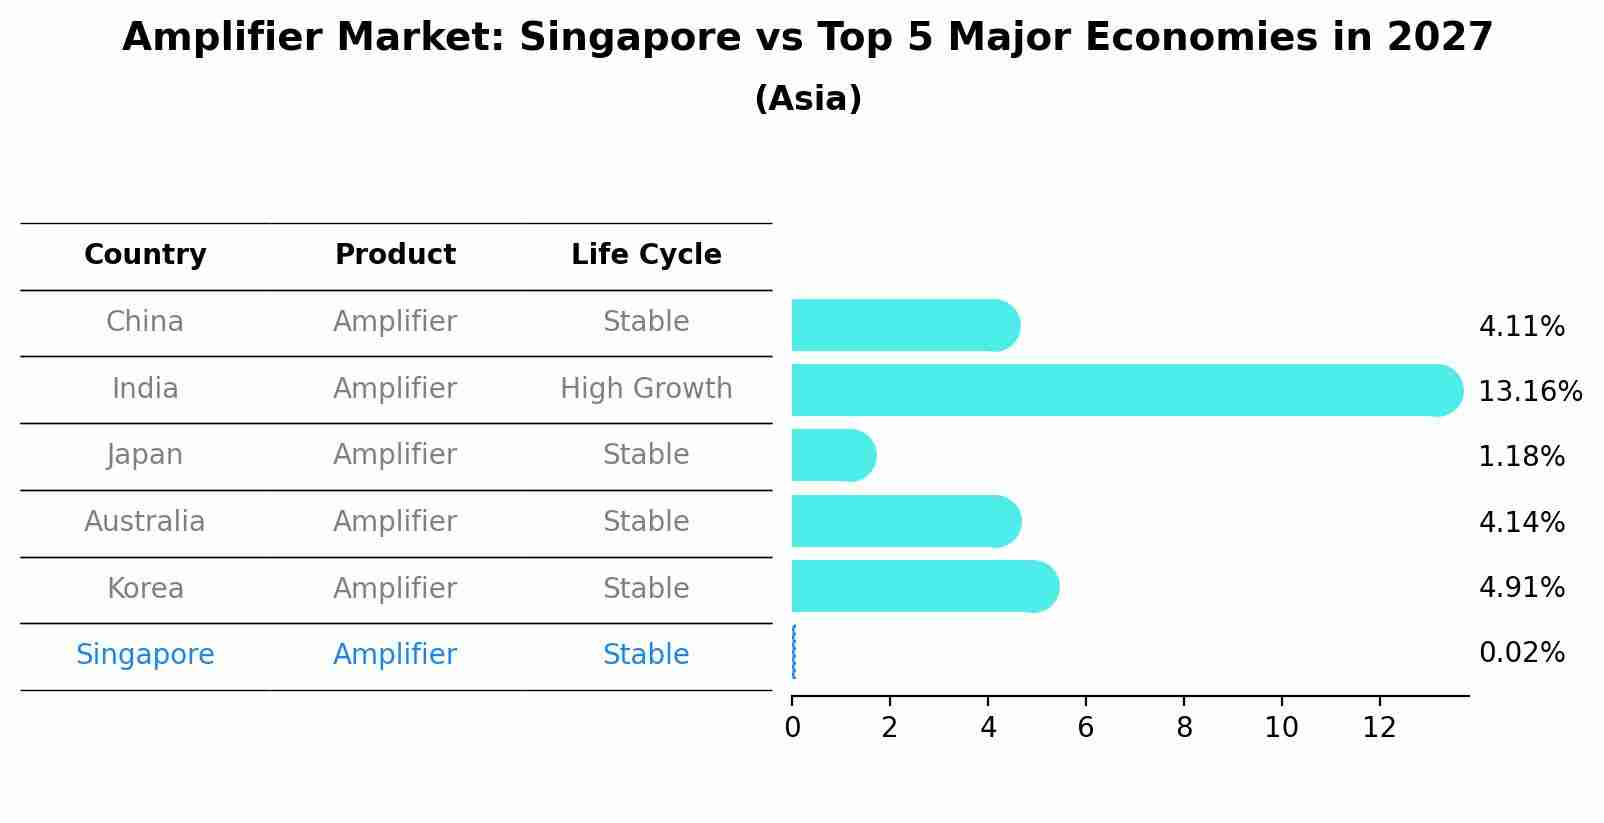
Amplifier Market: Singapore vs Top 5 Major Economies in 2027 (Asia)
By 2027, the Amplifier market in Singapore is anticipated to reach a growth rate of 0.02%, as part of an increasingly competitive Asia region, where China remains at the forefront, supported by India, Japan, Australia and South Korea, driving innovations and market adoption across sectors.
Singapore Amplifier Market Synopsis
The Singapore amplifier market is forecasted to grow at a CAGR of 8.10% during the forecast period 2020-2026. This growth can be attributed to factors such as growing demand for high quality audio equipment, rising disposable income and increasing technological advancements in amplifiers. Additionally, increasing awareness about consumer electronics products among consumers has increased the adoption of amplifiers in Singapore.
Market Drivers
Growing demand for high quality audio equipment: The rising availability of various types of sophisticated sound systems have driven the demand for higher quality amplifiers amongst consumers in Singapore.Increasing disposable incomes: Rising disposable incomes have enabled people to afford more expensive amplifiers with better features which ultimately drive up sales volumes in this market.Rapid technological advancements : With rapid advances in technology, manufacturers are able to offer innovative solutions that help improve audio output from amps while reducing their size and power consumption resulting into further surge in sales.Increasing awareness about consumer electronics products : In recent years there has been an increase in awareness about consumer electronic products due to introduction of new product launches by leading brands like Bose, Sony & Yamaha ETC, thus propelling the growth of amplifier market in Singapore over past few years.
Market challenges
The cost associated with purchasing an amplifier may inhibit its adoption among budget conscious customers who may opt for cheaper alternatives or second hand models instead which can limit potential profits earned by manufactures and retailers. Also it is important that these devices meet safety standards before being sold so stringent regulations coupled with lacklustre after-sale support services can create challenges for manufacturers operating within this space. Additionally counterfeited goods flooding markets also create unfair competition amongst legitimate players since customers find it difficult to differentiate between genuine vs fake ones further hurting profit margins as well as brand image/loyalty
Key players
Some major keyplayers operating within this space include Samsung Electronics Co., Ltd., Panasonic Corporation, Harman International Industries Incorporated, Bose Corporation, Yamaha Corporation Of America ETC
Covid-19 Impact
During COVID pandemic period, most companies had faced challenge related disruption supply chain network and decline customer spending on nonessential items like entertainment equipments including amplifiers consequently impacting overall revenue generated by industry players however post lockdown government initiatives were taken across countries worldwide helping business activities resume back gradually but still its far behind expected level prior covid 19 situation.
Key Highlights of the Report:
- Singapore Amplifier Market Outlook
- Market Size of Singapore Amplifier Market, 2023
- Forecast of Singapore Amplifier Market, 2030
- Historical Data and Forecast of Singapore Amplifier Revenues & Volume for the Period 2020-2030
- Singapore Amplifier Market Trend Evolution
- Singapore Amplifier Market Drivers and Challenges
- Singapore Amplifier Price Trends
- Singapore Amplifier Porter's Five Forces
- Singapore Amplifier Industry Life Cycle
- Historical Data and Forecast of Singapore Amplifier Market Revenues & Volume By Type for the Period 2020-2030
- Historical Data and Forecast of Singapore Amplifier Market Revenues & Volume By Class-A for the Period 2020-2030
- Historical Data and Forecast of Singapore Amplifier Market Revenues & Volume By Class-B for the Period 2020-2030
- Historical Data and Forecast of Singapore Amplifier Market Revenues & Volume By Class-A/B for the Period 2020-2030
- Historical Data and Forecast of Singapore Amplifier Market Revenues & Volume By Class-G&H for the Period 2020-2030
- Historical Data and Forecast of Singapore Amplifier Market Revenues & Volume By Class-D for the Period 2020-2030
- Historical Data and Forecast of Singapore Amplifier Market Revenues & Volume By l t n for the Period 2020-2030
- Historical Data and Forecast of Singapore Amplifier Market Revenues & Volume By n um r ud for the Period 2020-2030
- Historical Data and Forecast of Singapore Amplifier Market Revenues & Volume By ut m t v ud for the Period 2020-2030
- Historical Data and Forecast of Singapore Amplifier Market Revenues & Volume By m ut r ud for the Period 2020-2030
- Historical Data and Forecast of Singapore Amplifier Market Revenues & Volume By nt r r ud for the Period 2020-2030
- Singapore Amplifier Import Export Trade Statistics
- Market Opportunity Assessment By Type
- Market Opportunity Assessment By l t n
- Singapore Amplifier Top Companies Market Share
- Singapore Amplifier Competitive Benchmarking By Technical and Operational Parameters
- Singapore Amplifier Company Profiles
- Singapore Amplifier Key Strategic Recommendations
Frequently Asked Questions About the Market Study (FAQs):
6Wresearch actively monitors the Singapore Amplifier Market and publishes its comprehensive annual report, highlighting emerging trends, growth drivers, revenue analysis, and forecast outlook. Our insights help businesses to make data-backed strategic decisions with ongoing market dynamics. Our analysts track relevent industries related to the Singapore Amplifier Market, allowing our clients with actionable intelligence and reliable forecasts tailored to emerging regional needs.
Yes, we provide customisation as per your requirements. To learn more, feel free to contact us on sales@6wresearch.com
1 Executive Summary |
2 Introduction |
2.1 Key Highlights of the Report |
2.2 Report Description |
2.3 Market Scope & Segmentation |
2.4 Research Methodology |
2.5 Assumptions |
3 Singapore Amplifier Market Overview |
3.1 Singapore Country Macro Economic Indicators |
3.2 Singapore Amplifier Market Revenues & Volume, 2020 & 2030F |
3.3 Singapore Amplifier Market - Industry Life Cycle |
3.4 Singapore Amplifier Market - Porter's Five Forces |
3.5 Singapore Amplifier Market Revenues & Volume Share, By Type, 2020 & 2030F |
3.6 Singapore Amplifier Market Revenues & Volume Share, By ???l???t??n, 2020 & 2030F |
4 Singapore Amplifier Market Dynamics |
4.1 Impact Analysis |
4.2 Market Drivers |
4.3 Market Restraints |
5 Singapore Amplifier Market Trends |
6 Singapore Amplifier Market, By Types |
6.1 Singapore Amplifier Market, By Type |
6.1.1 Overview and Analysis |
6.1.2 Singapore Amplifier Market Revenues & Volume, By Type, 2020-2030F |
6.1.3 Singapore Amplifier Market Revenues & Volume, By Class-A, 2020-2030F |
6.1.4 Singapore Amplifier Market Revenues & Volume, By Class-B, 2020-2030F |
6.1.5 Singapore Amplifier Market Revenues & Volume, By Class-A/B, 2020-2030F |
6.1.6 Singapore Amplifier Market Revenues & Volume, By Class-G&H, 2020-2030F |
6.1.7 Singapore Amplifier Market Revenues & Volume, By Class-D, 2020-2030F |
6.2 Singapore Amplifier Market, By ???l???t??n |
6.2.1 Overview and Analysis |
6.2.2 Singapore Amplifier Market Revenues & Volume, By ??n?um?r ?ud??, 2020-2030F |
6.2.3 Singapore Amplifier Market Revenues & Volume, By ?ut?m?t?v? ?ud??, 2020-2030F |
6.2.4 Singapore Amplifier Market Revenues & Volume, By ??m?ut?r ?ud??, 2020-2030F |
6.2.5 Singapore Amplifier Market Revenues & Volume, By ?nt?r?r??? ?ud??, 2020-2030F |
7 Singapore Amplifier Market Import-Export Trade Statistics |
7.1 Singapore Amplifier Market Export to Major Countries |
7.2 Singapore Amplifier Market Imports from Major Countries |
8 Singapore Amplifier Market Key Performance Indicators |
9 Singapore Amplifier Market - Opportunity Assessment |
9.1 Singapore Amplifier Market Opportunity Assessment, By Type, 2020 & 2030F |
9.2 Singapore Amplifier Market Opportunity Assessment, By ???l???t??n, 2020 & 2030F |
10 Singapore Amplifier Market - Competitive Landscape |
10.1 Singapore Amplifier Market Revenue Share, By Companies, 2023 |
10.2 Singapore Amplifier Market Competitive Benchmarking, By Operating and Technical Parameters |
11 Company Profiles |
12 Recommendations |
13 Disclaimer |
Global Go To Market Strategy - 2030
Export potential enables firms to identify high-growth global markets with greater confidence by combining advanced trade intelligence with a structured quantitative methodology. The framework analyzes emerging demand trends and country-level import patterns while integrating macroeconomic and trade datasets such as GDP and population forecasts, bilateral import–export flows, tariff structures, elasticity differentials between developed and developing economies, geographic distance, and import demand projections. Using weighted trade values from 2020–2024 as the base period to project country-to-country export potential for 2030, these inputs are operationalized through calculated drivers such as gravity model parameters, tariff impact factors, and projected GDP per-capita growth. Through an analysis of hidden potentials, demand hotspots, and market conditions that are most favorable to success, this method enables firms to focus on target countries, maximize returns, and global expansion with data, backed by accuracy.
By factoring in the projected importer demand gap that is currently unmet and could be potential opportunity, it identifies the potential for the Exporter (Country) among 190 countries, against the general trade analysis, which identifies the biggest importer or exporter.
To discover high-growth global markets and optimize your business strategy:
Click Here
Pricing
- Single User License$ 1,995
- Department License$ 2,400
- Site License$ 3,120
- Global License$ 3,795

Leadership Perspectives from Industry Events
Search
Thought Leadership and Analyst Meet


Our Clients
6WResearch In News
- India Air Conditioner Market Set for Strong Rebound in 2026 After Weather-Led Correction and GST-Driven Recovery: 6Wresearch
- ADAS in India: How Automatic Emergency Braking, Blind Spot Detection & Driver Monitoring are Transforming Road Safety
- Doha a strategic location for EV manufacturing hub: IPA Qatar
- Demand for luxury TVs surging in the GCC, says Samsung
- Empowering Growth: The Thriving Journey of Bangladesh’s Cable Industry
- Demand for luxury TVs surging in the GCC, says Samsung
Latest Reports
- Poland Fire Protection Systems Market (2026-2032)
- Cape Verde Portable Hand-Thrown Extinguisher Market (2026-2032)
- Canada Portable Hand-Thrown Extinguisher Market (2026-2032)
- Cameroon Portable Hand-Thrown Extinguisher Market (2026-2032)
- Burundi Portable Hand-Thrown Extinguisher Market (2026-2032)
- Burkina Faso Portable Hand-Thrown Extinguisher Market (2026-2032)
- Bulgaria Portable Hand-Thrown Extinguisher Market (2026-2032)
- Brunei Portable Hand-Thrown Extinguisher Market (2026-2032)
- Botswana Portable Hand-Thrown Extinguisher Market (2026-2032)
- Bosnia and Herzegovina Portable Hand-Thrown Extinguisher Market (2026-2032)
Industry Events and Analyst Meet

HIMTEX 2026

India Refining Summit 2026

India EV Show 2026

EV tech India Expo 2026

Auto Tech Asia 2026
Whitepaper
- Middle East & Africa Commercial Security Market Click here to view more.
- Middle East & Africa Fire Safety Systems & Equipment Market Click here to view more.
- GCC Drone Market Click here to view more.
- Middle East Lighting Fixture Market Click here to view more.
- GCC Physical & Perimeter Security Market Click here to view more.