Singapore Converted Paper Products Market (2026-2032) | Revenue, Size, Growth, Forecast, Companies, Outlook, Share, Industry, Value, Trends & Analysis
Market Forecast By Type (Paperboard Container, Sanitary Paper Product, Stationery Product, Paper Bag And Coated And Treated Paper, Other), By End-Users (Packaging & Wrapping, Food Service, Printing, Others) And Competitive Landscape
| Product Code: ETC039128 | Publication Date: Jul 2023 | Updated Date: Jun 2026 | Product Type: Report | |
| Publisher: 6Wresearch | Author: Ravi Bhandari | No. of Pages: 70 | No. of Figures: 35 | No. of Tables: 5 |
Singapore Converted Paper Products Market Summary
The singapore converted paper products market was estimated at USD 1413 Million in 2025 and is projected to reach USD 2016 Million by 2032, growing at a CAGR of 5.9% from 2026 to 2032.
Singapore Converted Paper Products Market Year-wise Growth Rate and Key Drivers
This graph highlights how the Singapore Converted Paper Products Market has steadily grown over the past five years, supported by major growth factors.
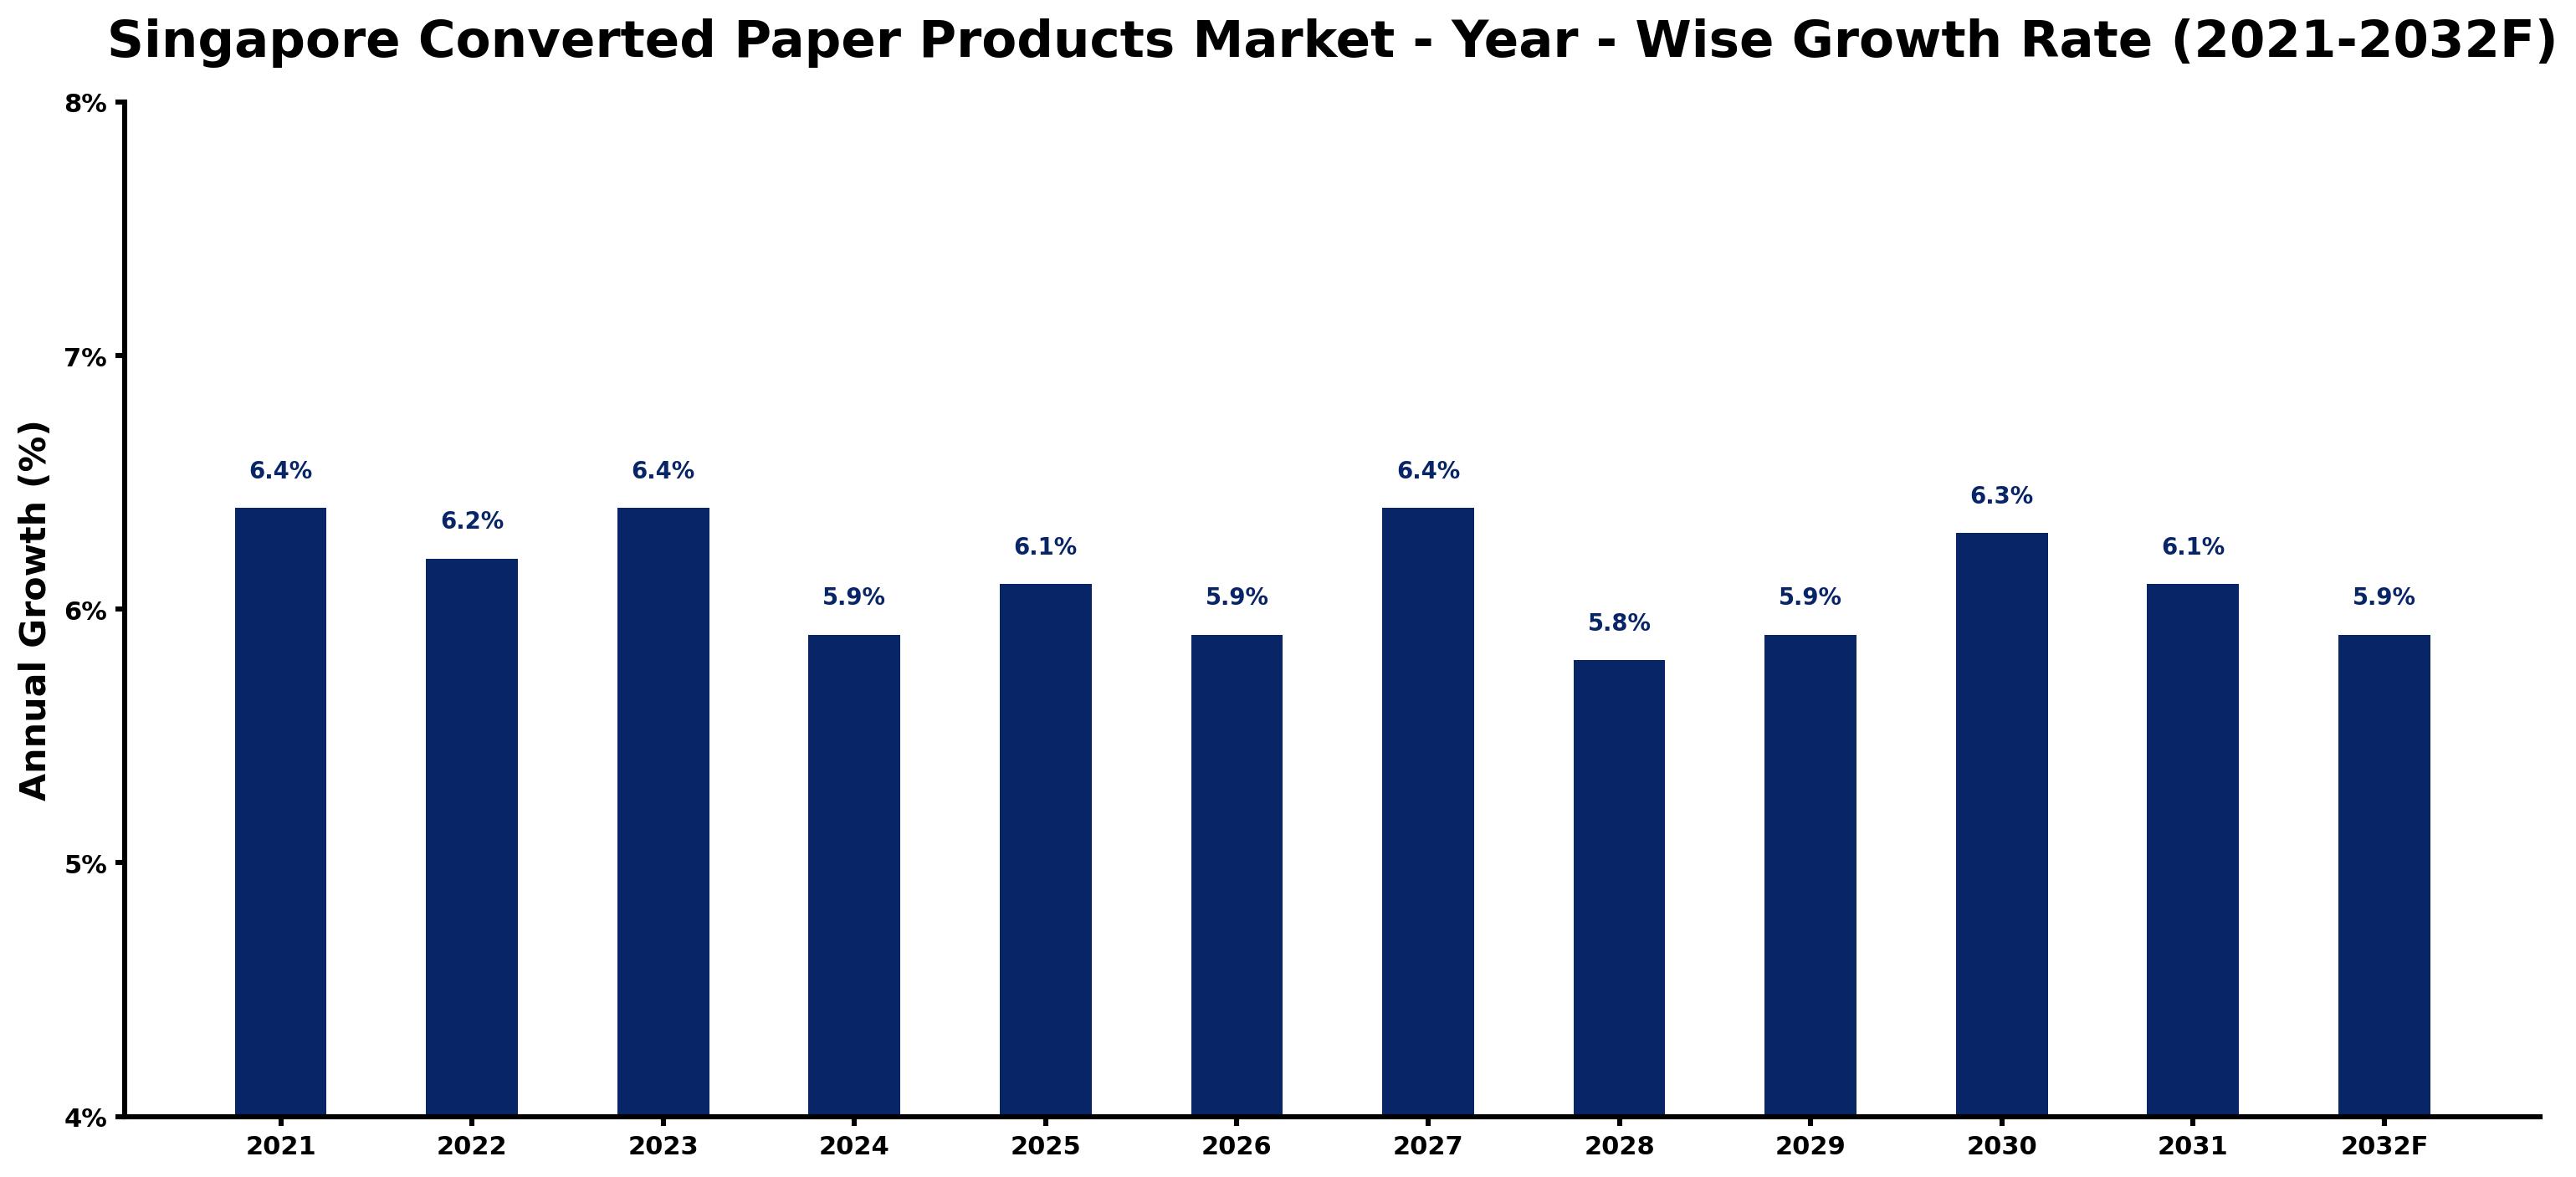
The table below presents the year wise growth rates along with the key drivers influencing the market
| Year | Growth Rate | Major Drivers |
| 2021 | 6.4% | Post-lockdown retail projects spark renewed interest in sustainable packaging solutions. |
| 2022 | 6.2% | Global brands increasingly prioritize eco-friendly practices, enhancing market competitiveness. |
| 2023 | 6.4% | Consumer awareness about environmental issues drives preferences for recycled paper products. |
| 2024 | 5.9% | Reduction in plastic usage regulations influences innovation in paper product designs. |
| 2025 | 6.1% | Corporate sustainability commitments become crucial for brand reputation in Singapore's market. |
| 2026 | 5.9% | Technological advancements in paper recycling open new avenues for product development. |
| 2027 | 6.4% | Collaboration between local producers and global firms strengthens supply chain dynamics. |
| 2028 | 5.8% | E-commerce expansion leads to higher demand for versatile packaging solutions. |
| 2029 | 5.9% | Emerging trends in minimalism encourage consumers to choose simpler paper products. |
| 2030 | 6.3% | Investment in green technologies supports the long-term viability of the paper sector. |
| 2031 | 6.1% | Youth-driven environmental movements increasingly influence corporate policies and practices. |
| 2032 | 5.9% | Market consolidation among manufacturers enhances production efficiencies and product diversity. |
Note - Market size estimations and growth projections presented in this report are based on 6Wresearch's advanced forecasting approach, validated with industry datasets as of June 2026.
Singapore Converted Paper Products Market Synopsis
The Singapore Converted Paper Products Market is projected to reach 5.9% and witness significant growth during the forecast period (2026-2032). This market comprises a variety of finished goods, including packaging materials and stationery items, derived from raw pulp. The rise in demand for sustainable and eco-friendly products has been a major driving force behind the growth in Singapore's converted paper products sector.
Singapore Converted Paper Products Market Growth Drivers
Several factors are contributing to the expansion of the Singapore Converted Paper Products Market. The primary drivers include:
- The heightened consumer awareness surrounding environmental sustainability is pushing businesses to seek eco-friendly alternatives, leading to increased demand for converted paper products that can be readily recycled.
- Innovation in production techniques has allowed manufacturers to enhance the quality and variety of converted paper products, making them more appealing to both consumers and businesses.
- End-use sectors such as food & beverages, healthcare, and personal care are increasingly adopting converted paper products due to their superior properties including printability, durability, and flexibility.
- Government policies aimed at promoting sustainability and reducing plastic waste have encouraged manufacturers to invest in the production of greener packaging solutions.
- The growing e-commerce sector in Singapore has led to a surge in demand for packaging materials, further boosting the converted paper products market.
Singapore Converted Paper Products Market Challenges and Restraints
Despite its promising growth trajectory, the Singapore Converted Paper Products Market faces several challenges that could impede its development:
- High production costs associated with converting raw pulp into finished products can create barriers for smaller players in the market, limiting competition.
- The complexity of manufacturing processes often requires significant investment in technology and machinery, which may deter new entrants from participating in the market.
- Variability in raw material prices can affect production costs and profit margins, creating unpredictability for manufacturers.
- Changing consumer preferences towards alternative materials may pose a risk to the sustained demand for paper products.
- Regulatory compliance regarding waste management and sustainability poses challenges for manufacturers, particularly smaller firms that may lack the resources to adapt.
Singapore Converted Paper Products Market Trends and Opportunities
The Singapore Converted Paper Products Market is witnessing several trends that indicate future opportunities:
- The increasing adoption of digital solutions in sectors such as education and corporate environments is driving demand for specialized stationery products.
- With a growing emphasis on personalization, manufacturers are creating customized converted paper products to cater to diverse consumer preferences.
- Collaboration between companies and environmental organizations is leading to innovative approaches in sustainable packaging, offering new avenues for growth.
- Emerging technologies such as biodegradable materials and smart packaging are gaining traction, presenting opportunities for companies focused on research and development.
- The rise of online shopping is continuously increasing demand for innovative packaging solutions, further enhancing the market potential for converted paper products.
Singapore Converted Paper Products Market Government Investment and Initiatives
The Singaporean government has recognized the importance of sustainable development and is actively investing in initiatives that affect the converted paper products market. Key investments and policies include:
- Support for sustainable packaging initiatives through grants and funding programs aimed at innovation in the packaging sector.
- Regulatory frameworks to encourage the reduction of single-use plastics, pushing industries to seek viable alternatives such as paper products.
- The establishment of partnerships with private sectors to foster research and development in eco-friendly packaging technologies.
- Public awareness campaigns promoting recycling and sustainable consumption practices, which align with the goals of the converted paper products market.
- Investment in infrastructure to facilitate efficient waste management and recycling systems, thus supporting the entire lifecycle of paper products.
Singapore Converted Paper Products Market Latest Developments (May 2025 - June 2026)
During the period from May 2025 to June 2026, the Singapore Converted Paper Products Market has experienced noteworthy developments, reflecting ongoing shifts in the industry landscape. Key highlights include:
- Increased collaboration between companies and research institutions to develop new types of biodegradable paper products aimed at further reducing environmental impact.
- The introduction of new regulations focused on enhancing recycling rates and minimizing waste in the packaging sector.
- Notable advancements in digital printing technologies have enabled manufacturers to offer innovative and customizable options in converted paper products.
- Emerging players entering the market are challenging established firms by providing eco-friendly alternatives and innovative product designs.
- The community has witnessed various sustainability-focused initiatives, including educational campaigns aimed at fostering greater consumer responsibility regarding paper usage.
Singapore Converted Paper Products Market - Key Attractiveness of the Report
- 10 Years of Market Numbers
- Historical Data Starting from 2022 to 2025
- Base Year: 2025
- Forecast Data until 2032
- Key Performance Indicators Impacting the Market
- Major Upcoming Developments and Projects
Key Highlights of the Report:
- Singapore Converted Paper Products Market Outlook
- Market Size of Singapore Converted Paper Products Market, 2025
- Forecast of Singapore Converted Paper Products Market, 2032F
- Historical Data and Forecast of Singapore Converted Paper Products Revenues & Volume for the Period 2022-2032F
- Singapore Converted Paper Products Market Trend Evolution
- Singapore Converted Paper Products Market Drivers and Challenges
- Singapore Converted Paper Products Price Trends
- Singapore Converted Paper Products Porter's Five Forces
- Singapore Converted Paper Products Industry Life Cycle
- Historical Data and Forecast of Singapore Converted Paper Products Market Revenues & Volume By Type for the Period 2022-2032F
- Historical Data and Forecast of Singapore Converted Paper Products Market Revenues & Volume By Paperboard Container for the Period 2022-2032F
- Historical Data and Forecast of Singapore Converted Paper Products Market Revenues & Volume By Sanitary Paper Product for the Period 2022-2032F
- Historical Data and Forecast of Singapore Converted Paper Products Market Revenues & Volume By Stationery Product for the Period 2022-2032F
- Historical Data and Forecast of Singapore Converted Paper Products Market Revenues & Volume By Paper Bag And Coated And Treated Paper for the Period 2022-2032F
- Historical Data and Forecast of Singapore Converted Paper Products Market Revenues & Volume By Other for the Period 2022-2032F
- Historical Data and Forecast of Singapore Converted Paper Products Market Revenues & Volume By End-Users for the Period 2022-2032F
- Historical Data and Forecast of Singapore Converted Paper Products Market Revenues & Volume By Packaging & Wrapping for the Period 2022-2032F
- Historical Data and Forecast of Singapore Converted Paper Products Market Revenues & Volume By Food Service for the Period 2022-2032F
- Historical Data and Forecast of Singapore Converted Paper Products Market Revenues & Volume By Printing for the Period 2022-2032F
- Historical Data and Forecast of Singapore Converted Paper Products Market Revenues & Volume By Others for the Period 2022-2032F
- Singapore Converted Paper Products Import Export Trade Statistics
- Market Opportunity Assessment By Type
- Market Opportunity Assessment By End-Users
- Singapore Converted Paper Products Top Companies Market Share
- Singapore Converted Paper Products Competitive Benchmarking By Technical and Operational Parameters
- Singapore Converted Paper Products Company Profiles
- Singapore Converted Paper Products Key Strategic Recommendations
Frequently Asked Questions About the Market Study (FAQs):
The growth rate is projected to be robust as the market adapts to increasing demand and innovations in sustainable materials.
Government policies aimed at sustainability and waste reduction heavily influence market dynamics, promoting the use of eco-friendly paper products.
Challenges include high production costs, regulatory compliance, and competition from alternative materials.
Key trends include an emphasis on customization, innovation in eco-friendly materials, and a shift towards digital solutions in stationery.
6Wresearch actively monitors the Singapore Converted Paper Products Market and publishes its comprehensive annual report, highlighting emerging trends, growth drivers, revenue analysis, and forecast outlook. Our insights help businesses to make data-backed strategic decisions with ongoing market dynamics. Our analysts track relevent industries related to the Singapore Converted Paper Products Market, allowing our clients with actionable intelligence and reliable forecasts tailored to emerging regional needs.
Yes, we provide customisation as per your requirements. To learn more, feel free to contact us on sales@6wresearch.com
1 Executive Summary |
2 Introduction |
2.1 Key Highlights of the Report |
2.2 Report Description |
2.3 Market Scope & Segmentation |
2.4 Research Methodology |
2.5 Assumptions |
3 Singapore Converted Paper Products Market Overview |
3.1 Singapore Country Macro Economic Indicators |
3.2 Singapore Converted Paper Products Market Revenues & Volume, 2022 & 2032F |
3.3 Singapore Converted Paper Products Market - Industry Life Cycle |
3.4 Singapore Converted Paper Products Market - Porter's Five Forces |
3.5 Singapore Converted Paper Products Market Revenues & Volume Share, By Type, 2022 & 2032F |
3.6 Singapore Converted Paper Products Market Revenues & Volume Share, By End-Users, 2022 & 2032F |
4 Singapore Converted Paper Products Market Dynamics |
4.1 Impact Analysis |
4.2 Market Drivers |
4.3 Market Restraints |
5 Singapore Converted Paper Products Market Trends |
6 Singapore Converted Paper Products Market, By Types |
6.1 Singapore Converted Paper Products Market, By Type |
6.1.1 Overview and Analysis |
6.1.2 Singapore Converted Paper Products Market Revenues & Volume, By Type, 2022-2032F |
6.1.3 Singapore Converted Paper Products Market Revenues & Volume, By Paperboard Container, 2022-2032F |
6.1.4 Singapore Converted Paper Products Market Revenues & Volume, By Sanitary Paper Product, 2022-2032F |
6.1.5 Singapore Converted Paper Products Market Revenues & Volume, By Stationery Product, 2022-2032F |
6.1.6 Singapore Converted Paper Products Market Revenues & Volume, By Paper Bag And Coated And Treated Paper, 2022-2032F |
6.1.7 Singapore Converted Paper Products Market Revenues & Volume, By Other, 2022-2032F |
6.2 Singapore Converted Paper Products Market, By End-Users |
6.2.1 Overview and Analysis |
6.2.2 Singapore Converted Paper Products Market Revenues & Volume, By Packaging & Wrapping, 2022-2032F |
6.2.3 Singapore Converted Paper Products Market Revenues & Volume, By Food Service, 2022-2032F |
6.2.4 Singapore Converted Paper Products Market Revenues & Volume, By Printing, 2022-2032F |
6.2.5 Singapore Converted Paper Products Market Revenues & Volume, By Others, 2022-2032F |
7 Singapore Converted Paper Products Market Import-Export Trade Statistics |
7.1 Singapore Converted Paper Products Market Export to Major Countries |
7.2 Singapore Converted Paper Products Market Imports from Major Countries |
8 Singapore Converted Paper Products Market Key Performance Indicators |
9 Singapore Converted Paper Products Market - Opportunity Assessment |
9.1 Singapore Converted Paper Products Market Opportunity Assessment, By Type, 2022 & 2032F |
9.2 Singapore Converted Paper Products Market Opportunity Assessment, By End-Users, 2022 & 2032F |
10 Singapore Converted Paper Products Market - Competitive Landscape |
10.1 Singapore Converted Paper Products Market Revenue Share, By Companies, 2025 |
10.2 Singapore Converted Paper Products Market Competitive Benchmarking, By Operating and Technical Parameters |
11 Company Profiles |
12 Recommendations |
13 Disclaimer |
Global Go To Market Strategy - 2030
Export potential enables firms to identify high-growth global markets with greater confidence by combining advanced trade intelligence with a structured quantitative methodology. The framework analyzes emerging demand trends and country-level import patterns while integrating macroeconomic and trade datasets such as GDP and population forecasts, bilateral import–export flows, tariff structures, elasticity differentials between developed and developing economies, geographic distance, and import demand projections. Using weighted trade values from 2020–2024 as the base period to project country-to-country export potential for 2030, these inputs are operationalized through calculated drivers such as gravity model parameters, tariff impact factors, and projected GDP per-capita growth. Through an analysis of hidden potentials, demand hotspots, and market conditions that are most favorable to success, this method enables firms to focus on target countries, maximize returns, and global expansion with data, backed by accuracy.
By factoring in the projected importer demand gap that is currently unmet and could be potential opportunity, it identifies the potential for the Exporter (Country) among 190 countries, against the general trade analysis, which identifies the biggest importer or exporter.
To discover high-growth global markets and optimize your business strategy:
Click Here
Pricing
- Single User License$ 1,995
- Department License$ 2,400
- Site License$ 3,120
- Global License$ 3,795

Leadership Perspectives from Industry Events
Search
Thought Leadership and Analyst Meet


Our Clients
6WResearch In News
- India Air Conditioner Market Set for Strong Rebound in 2026 After Weather-Led Correction and GST-Driven Recovery: 6Wresearch
- ADAS in India: How Automatic Emergency Braking, Blind Spot Detection & Driver Monitoring are Transforming Road Safety
- Doha a strategic location for EV manufacturing hub: IPA Qatar
- Demand for luxury TVs surging in the GCC, says Samsung
- Empowering Growth: The Thriving Journey of Bangladesh’s Cable Industry
- Demand for luxury TVs surging in the GCC, says Samsung
Latest Reports
- Nicaragua RPG Gaming Market (2026-2032)
- New Zealand RPG Gaming Market (2026-2032)
- Netherlands RPG Gaming Market (2026-2032)
- Nauru RPG Gaming Market (2026-2032)
- Namibia RPG Gaming Market (2026-2032)
- Mozambique RPG Gaming Market (2026-2032)
- Montenegro RPG Gaming Market (2026-2032)
- Mongolia RPG Gaming Market (2026-2032)
- Monaco RPG Gaming Market (2026-2032)
- Micronesia RPG Gaming Market (2026-2032)
Industry Events and Analyst Meet

EV India Expo 2026

HIMTEX 2026

India Refining Summit 2026

India EV Show 2026

EV tech India Expo 2026
Whitepaper
- Middle East & Africa Commercial Security Market Click here to view more.
- Middle East & Africa Fire Safety Systems & Equipment Market Click here to view more.
- GCC Drone Market Click here to view more.
- Middle East Lighting Fixture Market Click here to view more.
- GCC Physical & Perimeter Security Market Click here to view more.