Singapore Denatured Spirits Market (2026-2032) Outlook | Size, Forecast, Companies, Trends, Industry, Growth, Revenue, Share, Value & Analysis
Market Forecast By Variety (Bourbon, Brandy, Rum, Tequila, Vodka, Whiskey, Triple sec, Others), By End-Use (Food & Beverages, Food Dyes, Preserves, Dairy Products, Pharmaceuticals, Animal Feed), By Function (Colorant, Fragrant, Flavoring Agent, Coating Agent) And Competitive Landscape
| Product Code: ETC189999 | Publication Date: May 2022 | Updated Date: Mar 2026 | Product Type: Market Research Report | |
| Publisher: 6Wresearch | Author: Ravi Bhandari | No. of Pages: 60 | No. of Figures: 40 | No. of Tables: 7 |
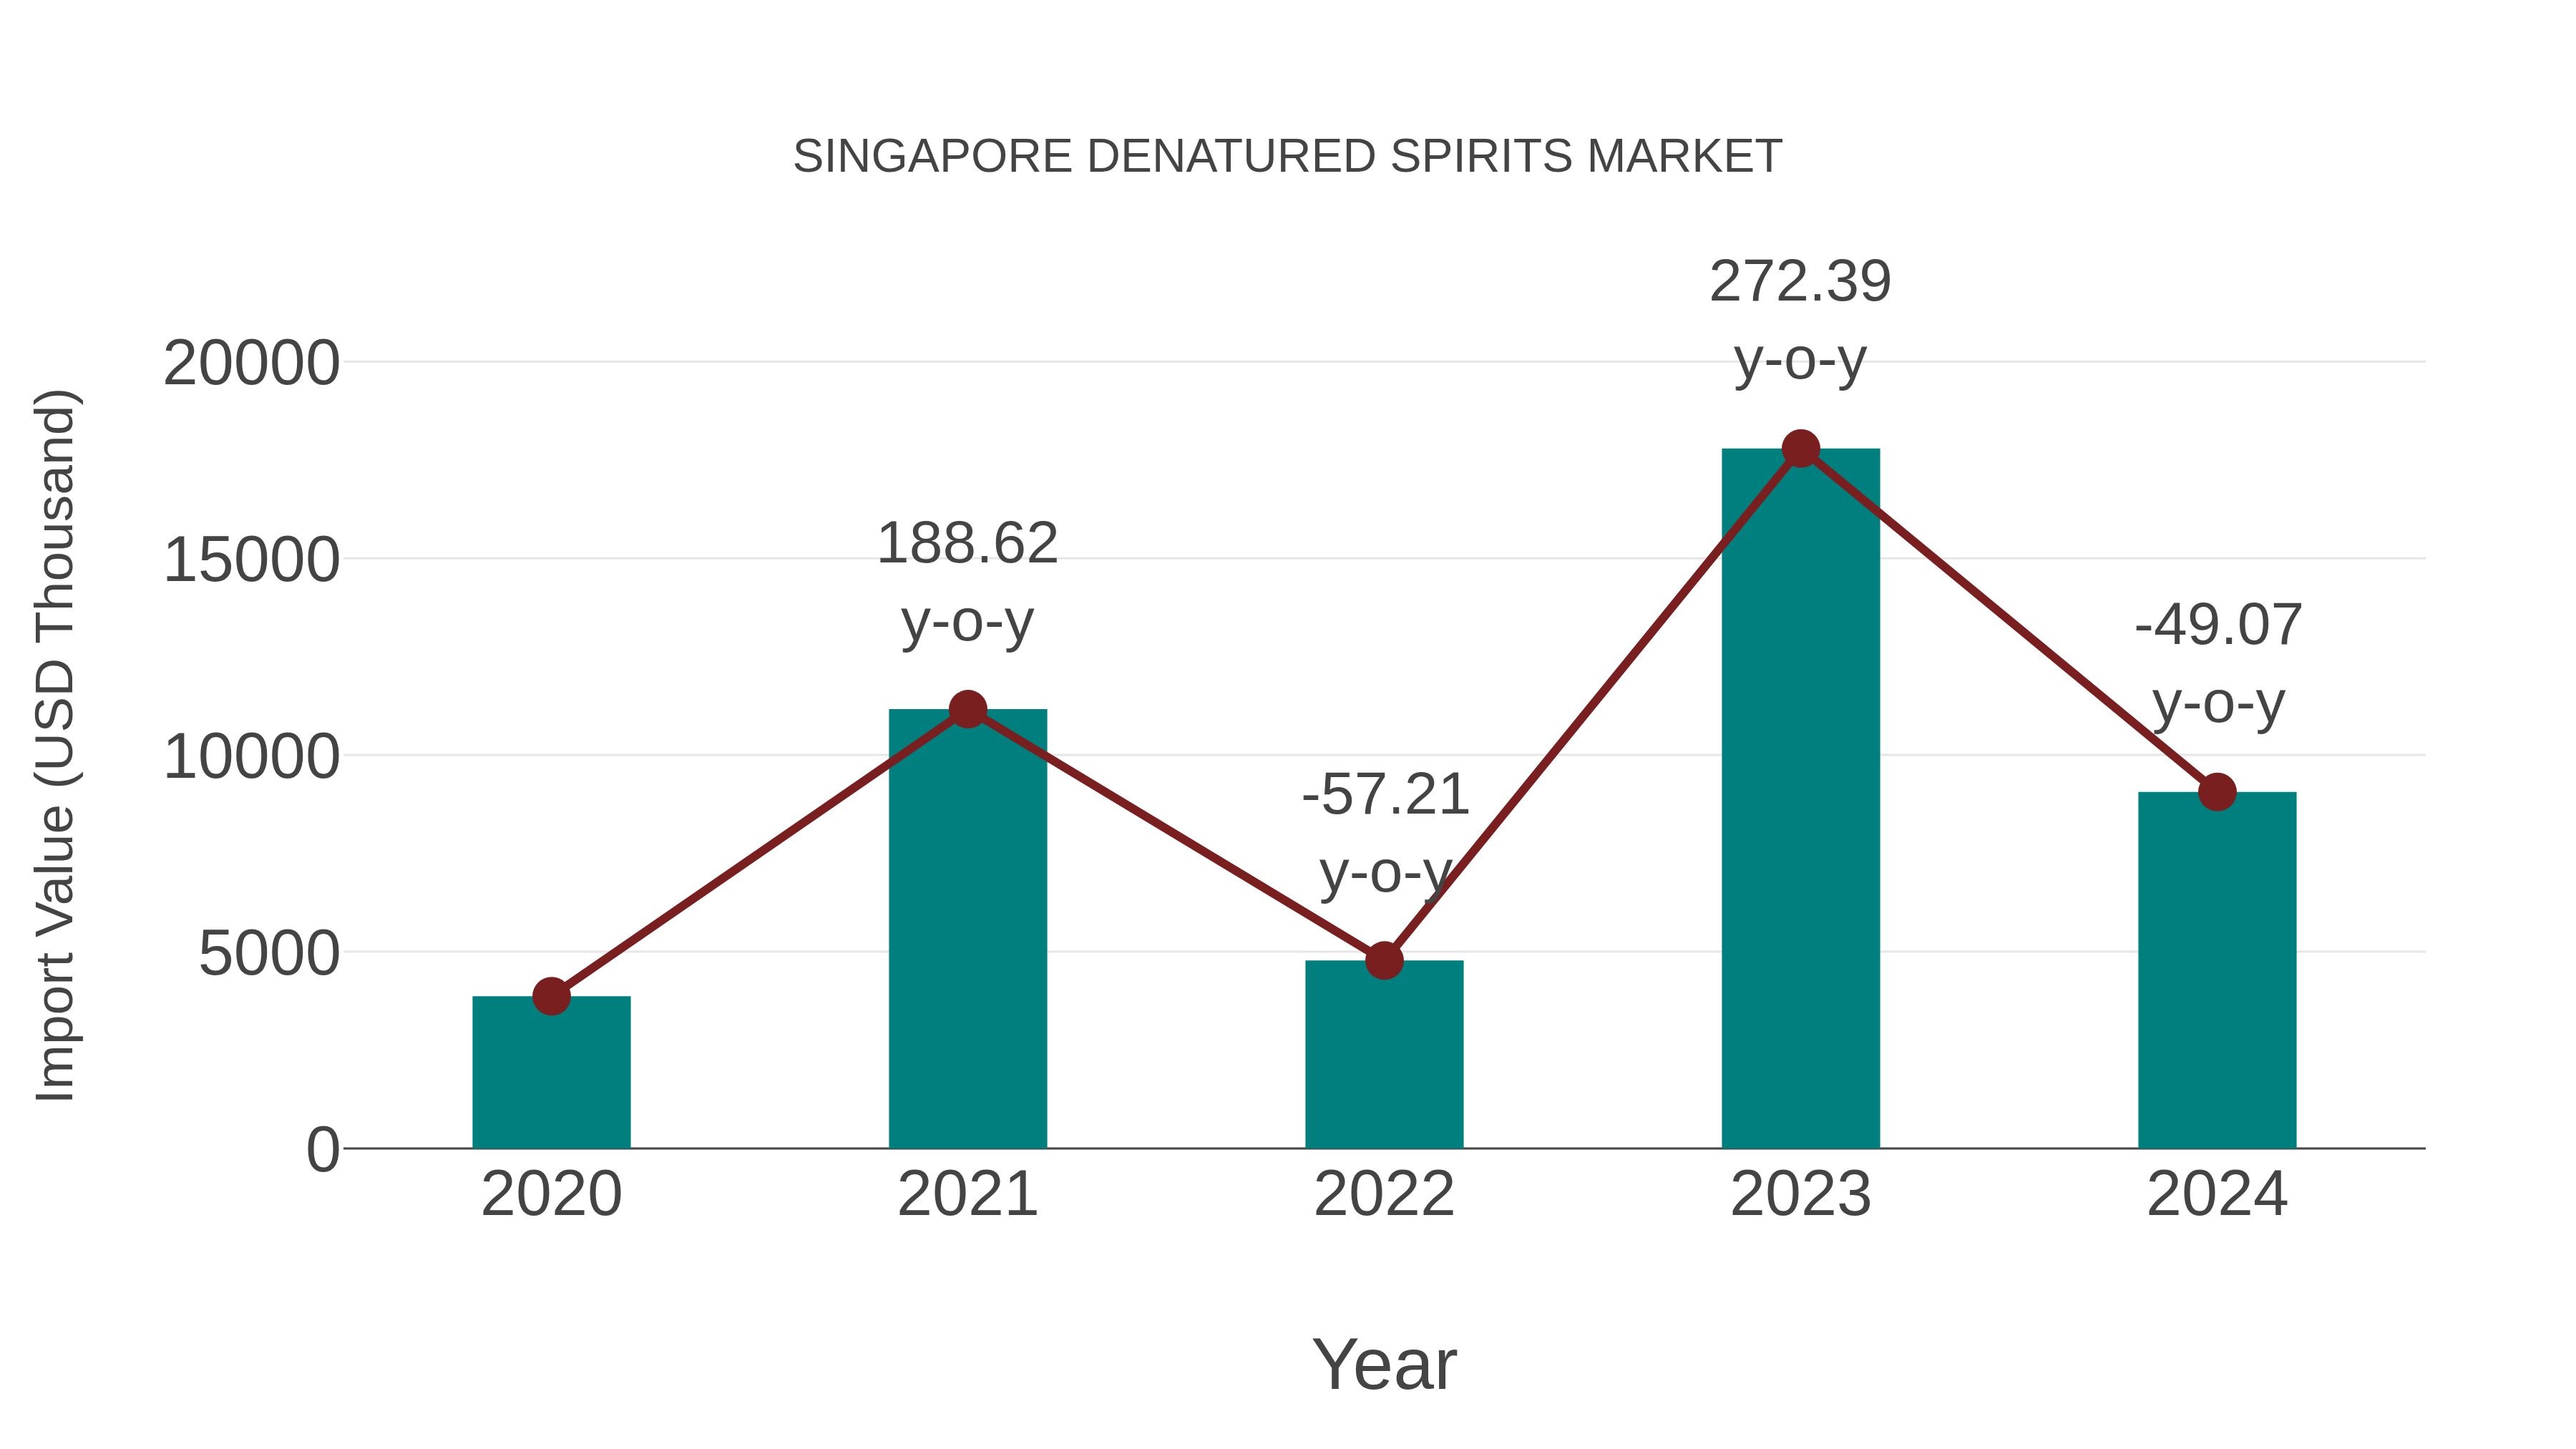
Singapore Denatured Spirits Market: Import Trend Analysis
In 2024, Singapore`s import trend for denatured spirits experienced a notable decline with a growth rate of -49.07% compared to the previous year. However, the compound annual growth rate (CAGR) for the period 2020-2024 stood at a robust 23.71%. This significant drop in import momentum in 2024 could be attributed to shifts in demand dynamics, changes in trade policies, or market fluctuations impacting the sector`s stability.
Singapore Denatured Spirits Market Synopsis
The denatured spirits market in Singapore serves various industrial sectors, including cosmetics, pharmaceuticals, and cleaning products. Regulatory compliance and quality control are paramount in this sector. Manufacturers are focusing on developing denatured spirits with specific formulations tailored to their industrial clients` requirements. Ongoing research into environmentally friendly denaturing methods and sustainable sourcing of raw materials is a growing trend in the market.
Drivers of the Market
The Singapore denatured spirits market is witnessing substantial growth, primarily driven by the industrial sector. Denatured spirits, which are used as solvents, are essential in various manufacturing processes, including the production of paints, coatings, and cleaning products. The country`s robust manufacturing industry, coupled with its strategic location as a global trading hub, positions Singapore as a key player in the denatured spirits market. Furthermore, the demand for sanitizers and disinfectants has surged in recent years, further boosting the consumption of denatured spirits as a key ingredient.
Challenges of the Market
The denatured spirits market faces challenges tied to regulatory compliance and evolving consumer preferences. Regulations governing the use and distribution of denatured spirits can change, impacting the production process and required compliance measures. Additionally, consumer preferences are shifting towards more natural and organic products, which can pose challenges for manufacturers of denatured spirits that often involve synthetic additives. Striking a balance between meeting regulatory requirements and aligning with consumer preferences presents an ongoing challenge for the industry.
COVID-19 Impact on the Market
The denatured spirits market in Singapore experienced heightened demand during the pandemic for use in sanitization and disinfection products. This trend is likely to continue to some extent as hygiene remains a priority. Manufacturers should ensure product quality and regulatory compliance to meet consumer expectations.
Key Players in the Market
The denatured spirits market in Singapore caters to various industries, including cosmetics, pharmaceuticals, and industrial applications. Major players like BASF and Dow Chemical are significant suppliers in this segment. Regulatory compliance and quality control are crucial factors in this market. Key players are expected to maintain their commitment to ensuring the availability of denatured spirits for diverse applications.
Key Highlights of the Report:
- Singapore Denatured Spirits Market Outlook
- Market Size of Singapore Denatured Spirits Market, 2025
- Forecast of Singapore Denatured Spirits Market, 2032
- Historical Data and Forecast of Singapore Denatured Spirits Revenues & Volume for the Period 2022-2032F
- Singapore Denatured Spirits Market Trend Evolution
- Singapore Denatured Spirits Market Drivers and Challenges
- Singapore Denatured Spirits Price Trends
- Singapore Denatured Spirits Porter's Five Forces
- Singapore Denatured Spirits Industry Life Cycle
- Historical Data and Forecast of Singapore Denatured Spirits Market Revenues & Volume By Variety for the Period 2022-2032F
- Historical Data and Forecast of Singapore Denatured Spirits Market Revenues & Volume By Bourbon for the Period 2022-2032F
- Historical Data and Forecast of Singapore Denatured Spirits Market Revenues & Volume By Brandy for the Period 2022-2032F
- Historical Data and Forecast of Singapore Denatured Spirits Market Revenues & Volume By Rum for the Period 2022-2032F
- Historical Data and Forecast of Singapore Denatured Spirits Market Revenues & Volume By Tequila for the Period 2022-2032F
- Historical Data and Forecast of Singapore Denatured Spirits Market Revenues & Volume By Vodka for the Period 2022-2032F
- Historical Data and Forecast of Singapore Denatured Spirits Market Revenues & Volume By Whiskey for the Period 2022-2032F
- Historical Data and Forecast of Singapore Denatured Spirits Market Revenues & Volume By Triple sec for the Period 2022-2032F
- Historical Data and Forecast of Singapore Bourbon Denatured Spirits Market Revenues & Volume By Others for the Period 2022-2032F
- Historical Data and Forecast of Singapore Denatured Spirits Market Revenues & Volume By End-Use for the Period 2022-2032F
- Historical Data and Forecast of Singapore Denatured Spirits Market Revenues & Volume By Food & Beverages for the Period 2022-2032F
- Historical Data and Forecast of Singapore Denatured Spirits Market Revenues & Volume By Food Dyes for the Period 2022-2032F
- Historical Data and Forecast of Singapore Denatured Spirits Market Revenues & Volume By Preserves for the Period 2022-2032F
- Historical Data and Forecast of Singapore Denatured Spirits Market Revenues & Volume By Dairy Products for the Period 2022-2032F
- Historical Data and Forecast of Singapore Denatured Spirits Market Revenues & Volume By Pharmaceuticals for the Period 2022-2032F
- Historical Data and Forecast of Singapore Denatured Spirits Market Revenues & Volume By Animal Feed for the Period 2022-2032F
- Historical Data and Forecast of Singapore Denatured Spirits Market Revenues & Volume By Function for the Period 2022-2032F
- Historical Data and Forecast of Singapore Denatured Spirits Market Revenues & Volume By Colorant for the Period 2022-2032F
- Historical Data and Forecast of Singapore Denatured Spirits Market Revenues & Volume By Fragrant for the Period 2022-2032F
- Historical Data and Forecast of Singapore Denatured Spirits Market Revenues & Volume By Flavoring Agent for the Period 2022-2032F
- Historical Data and Forecast of Singapore Denatured Spirits Market Revenues & Volume By Coating Agent for the Period 2022-2032F
- Singapore Denatured Spirits Import Export Trade Statistics
- Market Opportunity Assessment By Variety
- Market Opportunity Assessment By End-Use
- Market Opportunity Assessment By Function
- Singapore Denatured Spirits Top Companies Market Share
- Singapore Denatured Spirits Competitive Benchmarking By Technical and Operational Parameters
- Singapore Denatured Spirits Company Profiles
- Singapore Denatured Spirits Key Strategic Recommendations
Singapore Denatured Spirits Market (2026-2032): FAQs
6Wresearch actively monitors the Singapore Denatured Spirits Market and publishes its comprehensive annual report, highlighting emerging trends, growth drivers, revenue analysis, and forecast outlook. Our insights help businesses to make data-backed strategic decisions with ongoing market dynamics. Our analysts track relevent industries related to the Singapore Denatured Spirits Market, allowing our clients with actionable intelligence and reliable forecasts tailored to emerging regional needs.
Yes, we provide customisation as per your requirements. To learn more, feel free to contact us on sales@6wresearch.com
1 Executive Summary |
2 Introduction |
2.1 Key Highlights of the Report |
2.2 Report Description |
2.3 Market Scope & Segmentation |
2.4 Research Methodology |
2.5 Assumptions |
3 Singapore Denatured Spirits Market Overview |
3.1 Singapore Country Macro Economic Indicators |
3.2 Singapore Denatured Spirits Market Revenues & Volume, 2022 & 2032F |
3.3 Singapore Denatured Spirits Market - Industry Life Cycle |
3.4 Singapore Denatured Spirits Market - Porter's Five Forces |
3.5 Singapore Denatured Spirits Market Revenues & Volume Share, By Variety, 2022 & 2032F |
3.6 Singapore Denatured Spirits Market Revenues & Volume Share, By End-Use, 2022 & 2032F |
3.7 Singapore Denatured Spirits Market Revenues & Volume Share, By Function, 2022 & 2032F |
4 Singapore Denatured Spirits Market Dynamics |
4.1 Impact Analysis |
4.2 Market Drivers |
4.2.1 Growth in the pharmaceutical industry leading to increased demand for denatured spirits as a solvent. |
4.2.2 Rising use of denatured spirits in the cosmetics and personal care industry. |
4.2.3 Increasing adoption of denatured spirits in the manufacturing of cleaning products. |
4.3 Market Restraints |
4.3.1 Strict regulations on the production and usage of denatured spirits. |
4.3.2 Fluctuating prices of raw materials impacting the cost of denatured spirits production. |
4.3.3 Health and safety concerns associated with the handling and use of denatured spirits. |
5 Singapore Denatured Spirits Market Trends |
6 Singapore Denatured Spirits Market, By Types |
6.1 Singapore Denatured Spirits Market, By Variety |
6.1.1 Overview and Analysis |
6.1.2 Singapore Denatured Spirits Market Revenues & Volume, By Variety, 2022-2032F |
6.1.3 Singapore Denatured Spirits Market Revenues & Volume, By Bourbon, 2022-2032F |
6.1.4 Singapore Denatured Spirits Market Revenues & Volume, By Brandy, 2022-2032F |
6.1.5 Singapore Denatured Spirits Market Revenues & Volume, By Rum, 2022-2032F |
6.1.6 Singapore Denatured Spirits Market Revenues & Volume, By Tequila, 2022-2032F |
6.1.7 Singapore Denatured Spirits Market Revenues & Volume, By Vodka, 2022-2032F |
6.1.8 Singapore Denatured Spirits Market Revenues & Volume, By Whiskey, 2022-2032F |
6.1.9 Singapore Denatured Spirits Market Revenues & Volume, By Others, 2022-2032F |
6.1.10 Singapore Denatured Spirits Market Revenues & Volume, By Others, 2022-2032F |
6.2 Singapore Denatured Spirits Market, By End-Use |
6.2.1 Overview and Analysis |
6.2.2 Singapore Denatured Spirits Market Revenues & Volume, By Food & Beverages, 2022-2032F |
6.2.3 Singapore Denatured Spirits Market Revenues & Volume, By Food Dyes, 2022-2032F |
6.2.4 Singapore Denatured Spirits Market Revenues & Volume, By Preserves, 2022-2032F |
6.2.5 Singapore Denatured Spirits Market Revenues & Volume, By Dairy Products, 2022-2032F |
6.2.6 Singapore Denatured Spirits Market Revenues & Volume, By Pharmaceuticals, 2022-2032F |
6.2.7 Singapore Denatured Spirits Market Revenues & Volume, By Animal Feed, 2022-2032F |
6.3 Singapore Denatured Spirits Market, By Function |
6.3.1 Overview and Analysis |
6.3.2 Singapore Denatured Spirits Market Revenues & Volume, By Colorant, 2022-2032F |
6.3.3 Singapore Denatured Spirits Market Revenues & Volume, By Fragrant, 2022-2032F |
6.3.4 Singapore Denatured Spirits Market Revenues & Volume, By Flavoring Agent, 2022-2032F |
6.3.5 Singapore Denatured Spirits Market Revenues & Volume, By Coating Agent, 2022-2032F |
7 Singapore Denatured Spirits Market Import-Export Trade Statistics |
7.1 Singapore Denatured Spirits Market Export to Major Countries |
7.2 Singapore Denatured Spirits Market Imports from Major Countries |
8 Singapore Denatured Spirits Market Key Performance Indicators |
8.1 Percentage increase in demand from the pharmaceutical industry. |
8.2 Number of new product launches in the cosmetics and personal care sector using denatured spirits. |
8.3 Compliance rate with regulatory requirements in the denatured spirits market. |
8.4 Rate of innovation in denatured spirits production processes. |
8.5 Number of reported incidents related to health and safety issues involving denatured spirits. |
9 Singapore Denatured Spirits Market - Opportunity Assessment |
9.1 Singapore Denatured Spirits Market Opportunity Assessment, By Variety, 2022 & 2032F |
9.2 Singapore Denatured Spirits Market Opportunity Assessment, By End-Use, 2022 & 2032F |
9.3 Singapore Denatured Spirits Market Opportunity Assessment, By Function, 2022 & 2032F |
10 Singapore Denatured Spirits Market - Competitive Landscape |
10.1 Singapore Denatured Spirits Market Revenue Share, By Companies, 2025 |
10.2 Singapore Denatured Spirits Market Competitive Benchmarking, By Operating and Technical Parameters |
11 Company Profiles |
12 Recommendations |
13 Disclaimer |
Global Go To Market Strategy - 2030
Export potential enables firms to identify high-growth global markets with greater confidence by combining advanced trade intelligence with a structured quantitative methodology. The framework analyzes emerging demand trends and country-level import patterns while integrating macroeconomic and trade datasets such as GDP and population forecasts, bilateral import–export flows, tariff structures, elasticity differentials between developed and developing economies, geographic distance, and import demand projections. Using weighted trade values from 2020–2024 as the base period to project country-to-country export potential for 2030, these inputs are operationalized through calculated drivers such as gravity model parameters, tariff impact factors, and projected GDP per-capita growth. Through an analysis of hidden potentials, demand hotspots, and market conditions that are most favorable to success, this method enables firms to focus on target countries, maximize returns, and global expansion with data, backed by accuracy.
By factoring in the projected importer demand gap that is currently unmet and could be potential opportunity, it identifies the potential for the Exporter (Country) among 190 countries, against the general trade analysis, which identifies the biggest importer or exporter.
To discover high-growth global markets and optimize your business strategy:
Click Here
Pricing
- Single User License$ 1,995
- Department License$ 2,400
- Site License$ 3,120
- Global License$ 3,795

Leadership Perspectives from Industry Events
Search
Thought Leadership and Analyst Meet


Our Clients
6WResearch In News
- India Export Attractiveness Tracker 2026
- India Air Conditioner Market Set for Strong Rebound in 2026 After Weather-Led Correction and GST-Driven Recovery: 6Wresearch
- ADAS in India: How Automatic Emergency Braking, Blind Spot Detection & Driver Monitoring are Transforming Road Safety
- Doha a strategic location for EV manufacturing hub: IPA Qatar
- Demand for luxury TVs surging in the GCC, says Samsung
- Empowering Growth: The Thriving Journey of Bangladesh’s Cable Industry
Latest Reports
- Greece Insulated Sandwich Panels Market (2026-2032)
- Qatar Access and Home Network Market (2026-2032)
- Nicaragua RPG Gaming Market (2026-2032)
- New Zealand RPG Gaming Market (2026-2032)
- Netherlands RPG Gaming Market (2026-2032)
- Nauru RPG Gaming Market (2026-2032)
- Namibia RPG Gaming Market (2026-2032)
- Mozambique RPG Gaming Market (2026-2032)
- Montenegro RPG Gaming Market (2026-2032)
- Mongolia RPG Gaming Market (2026-2032)
Industry Events and Analyst Meet

EV India Expo 2026

HIMTEX 2026

India Refining Summit 2026

India EV Show 2026

EV tech India Expo 2026
Whitepaper
- Middle East & Africa Commercial Security Market Click here to view more.
- Middle East & Africa Fire Safety Systems & Equipment Market Click here to view more.
- GCC Drone Market Click here to view more.
- Middle East Lighting Fixture Market Click here to view more.
- GCC Physical & Perimeter Security Market Click here to view more.