Singapore Electric Bus Market Size, Share & Growth Rate
The Singapore Electric Bus Market was estimated at USD 156 Million in 2025 and is projected to reach USD 170 Million by 2032, growing at a CAGR of 1.2% from 2026 to 2032. This growth is primarily driven by Singapore's commitment to sustainable public transport and a comprehensive policy framework that promotes electric mobility. The adoption of electric buses is further fueled by rising environmental awareness and the government's investment in infrastructure to support electric vehicle charging stations.
Singapore Electric Bus Market Growth Rate Analysis (2021-2032)
The Singapore electric bus market has exhibited notable fluctuations over recent years. After a contraction of 3.7% in 2021 due to pandemic-related disruptions, the sector rebounded with growth of 4.9% in 2022 and 5.7% in 2023, driven by increased government investments in green transportation and the push for sustainable urban mobility. As consumer demand for eco-friendly solutions grows, the market has shown more modest growth rates, stabilizing at 0.4% in 2024 and 0.2% in 2025, before gradually increasing again. Factors such as advances in battery technology and a supportive policy framework are fostering continued, albeit slower, expansion, projected to reach 1.5% by 2032.
Singapore Electric Bus Market Year-wise Growth Rate and Key Drivers
This graph highlights how the Singapore Electric Bus Market has steadily grown over the years, supported by major growth factors.
The table below presents the year‑wise growth rates along with the key drivers influencing the market
| Year | Growth Rate | Major Drivers |
| 2021 | -3.7% | Supply chain disruptions affected production |
| 2022 | 4.9% | Government initiatives encouraged adoption |
| 2023 | 5.7% | Infrastructure development supported growth |
| 2024 | 0.4% | Increased environmental awareness influenced choices |
| 2025 | 0.2% | Technological advancements enhanced efficiency |
| 2026 | 1.0% | Public transport investments expanded services |
| 2027 | 1.2% | Partnerships with manufacturers strengthened market |
| 2028 | 1.9% | Rising fuel prices drove interest |
| 2029 | 2.0% | Urbanization trends increased demand |
| 2030 | 1.8% | Sustainability initiatives promoted electric buses |
| 2031 | 1.5% | Consumer preferences shifted towards eco-friendly |
| 2032 | 1.5% | Government subsidies incentivized purchases |
Note - Market size estimations and growth projections presented in this report are based on 6Wresearch's advanced forecasting approach, validated with industry datasets as of June 2026.
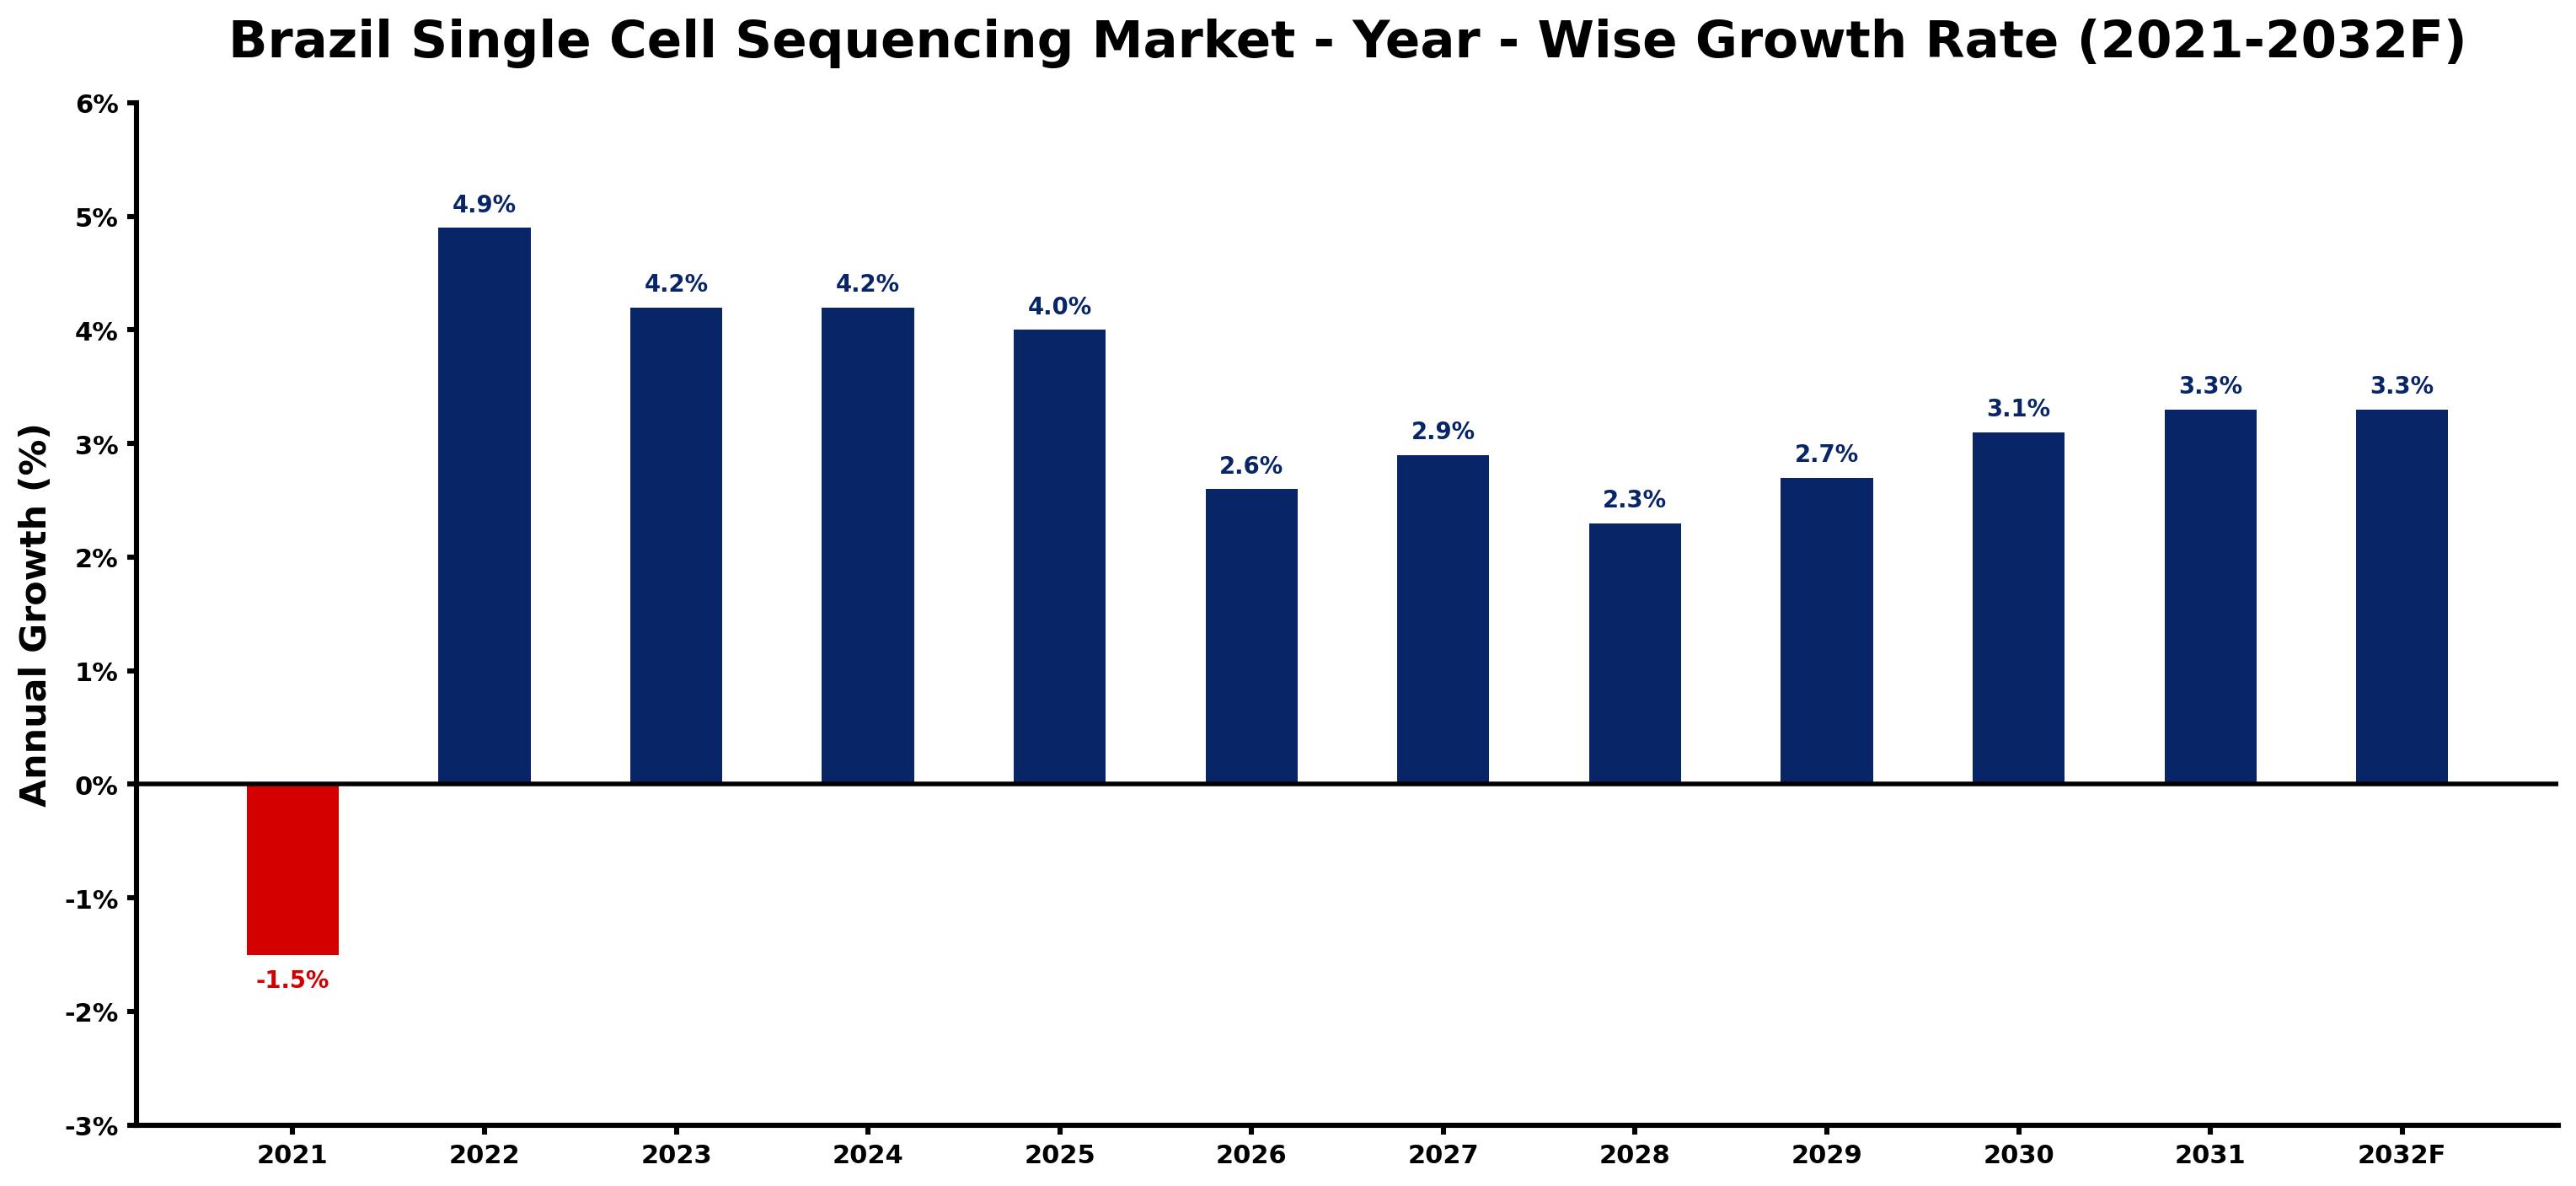
The Brazil single cell sequencing market has shown a notable upward trend following a challenging period in 2021, where it contracted by 1.5%. This decline was mainly attributed to the effects of the pandemic on research funding and investment. However, a resurgence began in 2022, when growth reached 4.9%, driven by increasing investments in biotechnology and expanding applications in personalized medicine. This momentum continued into 2023 and 2024, with consistent growth rates of 4.2%. As technological advancements enhance sequencing accuracy and reduce costs, the market is expected to see sustained growth through 2025 at 4.0%, gradually moderating to 2.6% by 2026. This steady demand aligns with Brazil's broader push towards digitalization and improved healthcare infrastructure.
Brazil Single Cell Sequencing Market Year-wise Growth Rate and Key Drivers
This graph highlights how the Brazil Single Cell Sequencing Market has steadily grown over the years, supported by major growth factors.
The table below presents the year‑wise growth rates along with the key drivers influencing the market
| Year | Growth Rate | Major Drivers |
| 2021 | -1.5% | Increasing industrial infrastructure investments |
| 2022 | 4.9% | Increasing smart city development projects |
| 2023 | 4.2% | Increasing industrial infrastructure investments |
| 2024 | 4.2% | Increasing industrial automation investments |
| 2025 | 4.0% | Increasing industrial infrastructure investments |
| 2026 | 2.6% | Expansion of manufacturing activities |
| 2027 | 2.9% | Expansion of transportation and logistics networks |
| 2028 | 2.3% | Rising electricity demand across industries |
| 2029 | 2.7% | Expansion of commercial construction activities |
| 2030 | 3.1% | Expansion of transportation and logistics networks |
| 2031 | 3.3% | Expansion of manufacturing activities |
| 2032 | 3.3% | Increasing industrial infrastructure investments |
Note - Market size estimations and growth projections presented in this report are based on 6Wresearch's advanced forecasting approach, validated with industry datasets as of June 2026.
Singapore Electric Bus Market Synopsis
The most potent force shaping the Singapore Electric Bus Market is the government's ambitious Green Plan 2030, aimed at reducing carbon emissions and promoting green technology. This initiative has established a roadmap that encourages the transition to electric buses, aligning with Singapore's long-term vision for a smart and sustainable transport system.
In addition, the increasing integration of advanced technologies such as vehicle-to-grid systems enhances the operational efficiency and sustainability of electric buses. With continued investments in research and development, the market is witnessing innovations that further enhance the attractiveness of electric buses in the public transport sector.
Singapore Electric Bus Market Key Takeaways
- Government policies strongly influence the acceleration of electric bus adoption.
- The increasing focus on sustainability is reshaping public transportation in Singapore.
- Technological advancements are critical in improving the performance and efficiency of electric buses.
- Infrastructure development, including charging stations, is essential for market growth.
- Collaboration between public and private sectors is driving innovation and investment in the market.
Evaluation of Restraints in Singapore Electric Bus Market
Despite the promising outlook, several restraints could hinder the Singapore Electric Bus Market's growth. A primary concern lies in the initial capital required to purchase electric buses, which may deter some operators. Additionally, the limited availability of charging infrastructure can create operational challenges, particularly for fleet managers. The interplay between technological advancement and consumer acceptance remains critical; as public perception shifts, any lag in infrastructure development could impede wider adoption.
Singapore Electric Bus Market Trends
Current trends indicate a strong shift towards the development of smart electric buses equipped with IoT capabilities for better route management and real-time monitoring. Moreover, there's growing interest in fleet electrification as operators seek to reduce operational costs and enhance service reliability. The emphasis on reducing greenhouse gas emissions is fostering partnerships among governmental bodies, research institutions, and technology providers to drive innovative solutions.
Singapore Electric Bus Market Opportunities
Significant growth opportunities lie in the realm of public-private partnerships aimed at expanding electric bus fleets and charging infrastructure. Moreover, as battery technology evolves, there is potential for improved energy storage solutions, leading to longer operational ranges. Investing in the development of autonomous electric buses also represents a forward-thinking avenue for growth, as it could enhance efficiency and reshape urban mobility.
Government Initiatives in the Singapore Electric Bus Market
The Singaporean government is actively promoting electric mobility through various initiatives, including grants and subsidies for electric bus procurement and related infrastructure development. Policies focused on enhancing public transport efficiency and reducing carbon emissions are paramount. Regulatory frameworks also support the establishment of smart charging networks, ensuring that electric buses can operate efficiently across the city's transport ecosystem.
Future Insights of the Singapore Electric Bus Market
Looking ahead to 2026-2032, the Singapore Electric Bus Market is poised for significant transformation as policy initiatives gain momentum. The market is likely to see accelerated adoption driven by advancements in battery technology, which promise longer ranges and shorter charging times. As urbanization continues and public demand for eco-friendly transport solutions grows, the electric bus sector will play a pivotal role in achieving a sustainable future for Singapore's public transport network.
Singapore Electric Bus Market Latest Developments (May 2025 - June 2026)
Recent developments indicate a surge in pilot projects testing new electric bus models equipped with cutting-edge technology for improved efficiency. Enhanced collaborations between government and private sectors have led to more robust infrastructure proposals to ensure adequate charging facilities. Additionally, various stakeholders are actively participating in discussions about integrating autonomous driving features into electric buses, setting the stage for a more innovative public transport experience.
Singapore Electric Bus Market - Key Attractiveness of the Report
- 10 Years of Market Numbers
- Historical Data Starting from 2022 to 2025
- Base Year: 2025
- Forecast Data until 2032
- Key Performance Indicators Impacting the Market
- Major Upcoming Developments and Projects
Key Highlights of the Report:
- Singapore Electric Bus Market Overview
- Singapore Electric Bus Market Outlook
- Singapore Electric Bus Market Forecast
- Historical Data and Forecast Singapore Electric Bus Market Revenues and Volume for the Period 2019-2025F
- Historical Data and Forecast of Singapore Electric Bus Market Revenues and Volume, By Vehicle Types, for the Period 2019-2025F
- Historical Data and Forecast of Singapore Electric Bus Market Revenues and Volume, By Charger Types, for the Period 2019-2025F
- Historical Data and Forecast of Singapore Electric Bus Market Revenues and Volume, By DC Charger Connector Types, for the Period 2019-2025F
- Historical Data and Forecast of Singapore Electric Bus Market Revenues and Volume, By DC Charger Power Ratings, for the Period 2019-2025F
- Historical Data and Forecast of Singapore Electric Bus Market Revenues and Volume, By Charger End Consumers, for the Period 2019-2025F
- Market Drivers and Restraints
- Industry Life Cycle
- Porter’s Five Force Analysis
- Impact Analysis of COVID-19
- Market Trends
- Japan Vehicle Market Revenue Ranking, By Companies
- Competitive Benchmarking
- Company Profiles
- Key Strategic Recommendations
Market Scope and Segmentation
Thereportprovides a detailed analysis of the following market segments:
By Charger Types
- AC
- DC
By DC Charger Connector Types
- CHAdeMO
- CCS
- Others (including Tesla superchargers and GB/T)
By DC Charger Power Ratings
- 40-80 kW
- 80-120 kW
- 120-200 kW
By Charger End Consumers
- Public
- Private






































