Singapore Electric Conductors Market (2026-2032) | Value, Revenue, Size, Industry, Companies, Forecast, Growth, Share, Outlook, Trends & Analysis
Market Forecast By Product Types (AAC (All Aluminum Conductor), AAAC (All Aluminum Alloy Conductor), ACSR (Aluminum Conductor Steel Reinforced), ACAR (Aluminum Conductor Aluminum Alloy Reinforced)), By Applications (Power Cables, Transformer, Busbars, Submarine Power Cables) And Competitive Landscape
| Product Code: ETC006347 | Publication Date: Jul 2023 | Updated Date: Jun 2026 | Product Type: Report | |
| Publisher: 6Wresearch | Author: Ravi Bhandari | No. of Pages: 70 | No. of Figures: 35 | No. of Tables: 5 |
Singapore Electric Conductors Market Summary
The singapore electric conductors market was estimated at USD 1161 Million in 2025 and is projected to reach USD 1676 Million by 2032, growing at a CAGR of 6.3% from 2026 to 2032.
Singapore Electric Conductors Market Year-wise Growth Rate and Key Drivers
This graph highlights how the Singapore Electric Conductors Market has steadily grown over the past five years, supported by major growth factors.
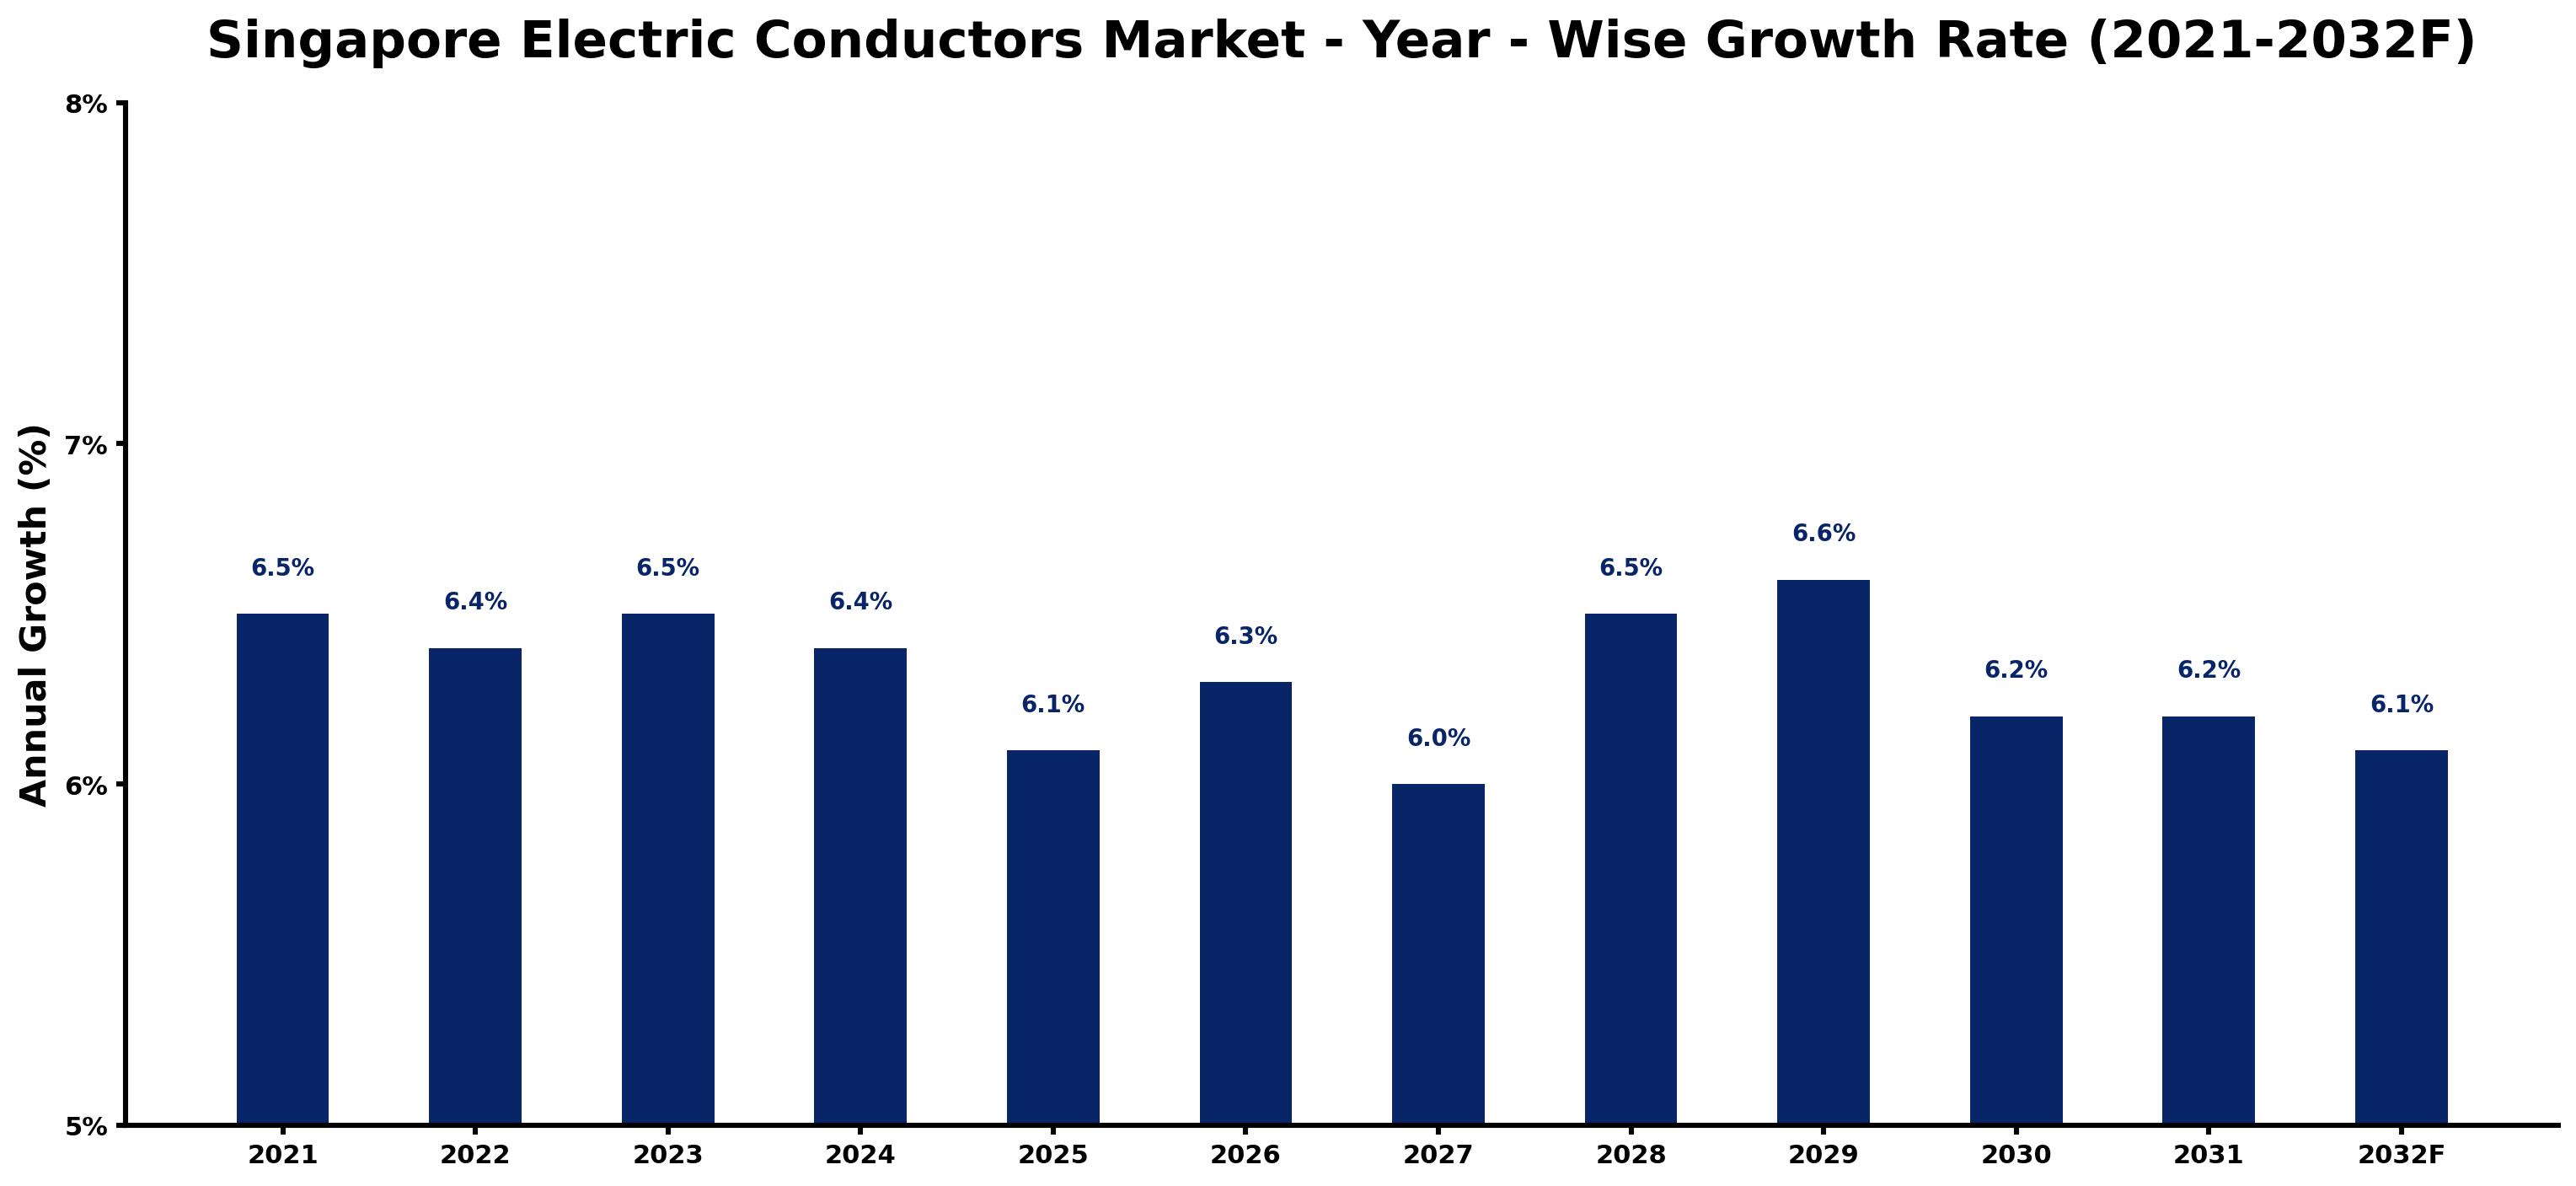
The table below presents the year wise growth rates along with the key drivers influencing the market
| Year | Growth Rate | Major Drivers |
| 2021 | 6.5% | Post-pandemic recovery initiated numerous infrastructure projects across Singapore's urban landscape. |
| 2022 | 6.4% | Shifts toward smart city technologies emphasized the importance of efficient electric conductors. |
| 2023 | 6.5% | Legacy copper grid failures prompted investments in more reliable and durable materials. |
| 2024 | 6.4% | Enterprise budgets prioritizing sustainability led to increased demand for eco-friendly conductor options. |
| 2025 | 6.1% | Regional trade agreements facilitated access to innovative conductor technologies and materials. |
| 2026 | 6.3% | Emerging construction pipelines created significant opportunities for electrical infrastructure enhancements. |
| 2027 | 6.0% | Shifts toward renewable energy sources required advanced conductors for efficient energy transmission. |
| 2028 | 6.5% | Technological advancements in manufacturing methods improved production efficiency and reduced costs. |
| 2029 | 6.6% | Urbanization trends fueled demand for robust conductors in both residential and commercial projects. |
| 2030 | 6.2% | Growing awareness of energy efficiency influenced investments in high-performance conductor solutions. |
| 2031 | 6.2% | Collaborations between tech firms and utilities led to novel conductor applications in smart grids. |
| 2032 | 6.1% | Sustained economic growth reinforced the construction sector's reliance on advanced electric conductors. |
Note - Market size estimations and growth projections presented in this report are based on 6Wresearch's advanced forecasting approach, validated with industry datasets as of June 2026.
Singapore Electric Conductors Market Synopsis
The Singapore Electric Conductors Market is projected to reach 6.3% and witness significant growth during the forecast period (2026-2032). This growth can be attributed to the increasing demand driven by various industry verticals, including telecommunications, power utilities, and consumer electronics. The robust technological foundation in Singapore serves as a compelling landscape for investors looking to establish electric conductor manufacturing facilities.
Singapore Electric Conductors Market Growth Drivers
The expansion of the Singapore Electric Conductors Market is primarily influenced by several key drivers:
- Government regulations enforcing energy efficiency standards are propelling the demand for higher-quality electric conductors across various sectors.
- Infrastructure development projects have seen increased investment, necessitating a reliable supply of electric conductors to support construction and utility installations.
- A surge in the usage of mobile communication devices and smart appliances places additional pressure on the market, leading to heightened consumption of electric conductors.
- Government initiatives aimed at promoting digitalization further stimulate the demand for electric conductors, as modern technologies increasingly rely on robust electrical infrastructure.
- The ongoing urbanization trends in Singapore create a need for advanced electrical systems, thereby driving the demand for electric conductors.
Singapore Electric Conductors Market Challenges and Restraints
Despite the promising growth prospects, the Singapore Electric Conductors Market faces several challenges:
- The high cost associated with raw materials required for the production of electric conductors can limit profitability and increase product pricing.
- A limited availability of skilled labor within local markets poses challenges for manufacturers, ultimately affecting production capacity and efficiency.
- Fluctuations in currency exchange rates can create volatility in pricing structures, which may adversely impact profit margins.
- The competitive landscape can lead to increased pressure on prices, making it difficult for new entrants to establish and sustain market share.
- Regulatory complexities and compliance requirements may hinder the entry of new players into the market, limiting innovation and growth.
Singapore Electric Conductors Market Government Investment and Initiatives
The Singapore government has implemented several initiatives to bolster the Electric Conductors Market:
- Increased public spending on infrastructure projects has been prioritized, ensuring a steady demand for electric conductors in key sectors.
- Government policies promoting renewable energy are likely to increase the demand for electric conductors used in sustainable energy applications.
- Support for innovation and research through grants and funding programs is fostering advancements in conductor technology and production methods.
- Collaboration between public and private sectors is being encouraged to facilitate the development of smart grid technologies, requiring advanced electric conductor systems.
- The government is focused on implementing educational programs aimed at building a skilled workforce to address labor shortages in the electric conductors sector.
Singapore Electric Conductors Market Latest Developments (May 2025 - June 2026)
Recent developments in the Singapore Electric Conductors Market indicate a strong commitment to innovation and improvement. New product lines have been introduced focusing on energy-efficient conductors designed for both residential and commercial applications. A notable trend has been the increased investments in smart technologies, with several projects aimed at integrating IoT capabilities in electrical systems. Furthermore, local manufacturers are exploring partnerships with tech firms to enhance product offerings and streamline production processes. The market is also observing shifts towards sustainable materials in conductor manufacturing, aligning with global trends in environmental responsibility. Public-private partnerships are being utilized to address infrastructure demands, facilitating better resource management and deployment within the sector.
Singapore Electric Conductors Market - Key Attractiveness of the Report
- 10 Years of Market Numbers
- Historical Data Starting from 2022 to 2025
- Base Year: 2025
- Forecast Data until 2032
- Key Performance Indicators Impacting the Market
- Major Upcoming Developments and Projects
Key Highlights of the Report:
- Singapore Electric Conductors Market Outlook
- Market Size of Singapore Electric Conductors Market, 2025
- Forecast of Singapore Electric Conductors Market, 2032
- Historical Data and Forecast of Singapore Electric Conductors Revenues & Volume for the Period 2022-2032
- Singapore Electric Conductors Market Trend Evolution
- Singapore Electric Conductors Market Drivers and Challenges
- Singapore Electric Conductors Price Trends
- Singapore Electric Conductors Porter's Five Forces
- Singapore Electric Conductors Industry Life Cycle
- Historical Data and Forecast of Singapore Electric Conductors Market Revenues & Volume By Product Types for the Period 2022-2032
- Historical Data and Forecast of Singapore Electric Conductors Market Revenues & Volume By AAC (All Aluminum Conductor) for the Period 2022-2032
- Historical Data and Forecast of Singapore Electric Conductors Market Revenues & Volume By AAAC (All Aluminum Alloy Conductor) for the Period 2022-2032
- Historical Data and Forecast of Singapore Electric Conductors Market Revenues & Volume By ACSR (Aluminum Conductor Steel Reinforced) for the Period 2022-2032
- Historical Data and Forecast of Singapore Electric Conductors Market Revenues & Volume By ACAR (Aluminum Conductor Aluminum Alloy Reinforced) for the Period 2022-2032
- Historical Data and Forecast of Singapore Electric Conductors Market Revenues & Volume By Applications for the Period 2022-2032
- Historical Data and Forecast of Singapore Electric Conductors Market Revenues & Volume By Power Cables for the Period 2022-2032
- Historical Data and Forecast of Singapore Electric Conductors Market Revenues & Volume By Transformer for the Period 2022-2032
- Historical Data and Forecast of Singapore Electric Conductors Market Revenues & Volume By Busbars for the Period 2022-2032
- Historical Data and Forecast of Singapore Electric Conductors Market Revenues & Volume By Submarine Power Cables for the Period 2022-2032
- Singapore Electric Conductors Import Export Trade Statistics
- Market Opportunity Assessment By Product Types
- Market Opportunity Assessment By Applications
- Singapore Electric Conductors Top Companies Market Share
- Singapore Electric Conductors Competitive Benchmarking By Technical and Operational Parameters
- Singapore Electric Conductors Company Profiles
- Singapore Electric Conductors Key Strategic Recommendations
Frequently Asked Questions About the Market Study (FAQs):
Electric conductors are extensively used in telecommunications, power distribution networks, and consumer electronics within Singapore.
The government is facilitating support through infrastructure spending, innovation grants, and promoting educational programs to build a skilled workforce.
The market is expected to grow significantly due to rising demand from various sectors, particularly as Singapore advances towards digitalization and sustainability goals.
Challenges include high raw material costs, a shortage of skilled labor, and potential fluctuations in currency exchange rates affecting profitability.
6Wresearch actively monitors the Singapore Electric Conductors Market and publishes its comprehensive annual report, highlighting emerging trends, growth drivers, revenue analysis, and forecast outlook. Our insights help businesses to make data-backed strategic decisions with ongoing market dynamics. Our analysts track relevent industries related to the Singapore Electric Conductors Market, allowing our clients with actionable intelligence and reliable forecasts tailored to emerging regional needs.
Yes, we provide customisation as per your requirements. To learn more, feel free to contact us on sales@6wresearch.com
| 1 Executive Summary |
| 2 Introduction |
| 2.1 Key Highlights of the Report |
| 2.2 Report Description |
| 2.3 Market Scope & Segmentation |
| 2.4 Research Methodology |
| 2.5 Assumptions |
| 3 Singapore Electric Conductors Market Overview |
| 3.1 Singapore Country Macro Economic Indicators |
| 3.2 Singapore Electric Conductors Market Revenues & Volume, 2022 & 2032F |
| 3.3 Singapore Electric Conductors Market - Industry Life Cycle |
| 3.4 Singapore Electric Conductors Market - Porter's Five Forces |
| 3.5 Singapore Electric Conductors Market Revenues & Volume Share, By Product Types, 2022 & 2032F |
| 3.6 Singapore Electric Conductors Market Revenues & Volume Share, By Applications, 2022 & 2032F |
| 4 Singapore Electric Conductors Market Dynamics |
| 4.1 Impact Analysis |
| 4.2 Market Drivers |
| 4.3 Market Restraints |
| 5 Singapore Electric Conductors Market Trends |
| 6 Singapore Electric Conductors Market, By Types |
| 6.1 Singapore Electric Conductors Market, By Product Types |
| 6.1.1 Overview and Analysis |
| 6.1.2 Singapore Electric Conductors Market Revenues & Volume, By Product Types, 2022-2032F |
| 6.1.3 Singapore Electric Conductors Market Revenues & Volume, By AAC (All Aluminum Conductor), 2022-2032F |
| 6.1.4 Singapore Electric Conductors Market Revenues & Volume, By AAAC (All Aluminum Alloy Conductor), 2022-2032F |
| 6.1.5 Singapore Electric Conductors Market Revenues & Volume, By ACSR (Aluminum Conductor Steel Reinforced), 2022-2032F |
| 6.1.6 Singapore Electric Conductors Market Revenues & Volume, By ACAR (Aluminum Conductor Aluminum Alloy Reinforced), 2022-2032F |
| 6.2 Singapore Electric Conductors Market, By Applications |
| 6.2.1 Overview and Analysis |
| 6.2.2 Singapore Electric Conductors Market Revenues & Volume, By Power Cables, 2022-2032F |
| 6.2.3 Singapore Electric Conductors Market Revenues & Volume, By Transformer, 2022-2032F |
| 6.2.4 Singapore Electric Conductors Market Revenues & Volume, By Busbars, 2022-2032F |
| 6.2.5 Singapore Electric Conductors Market Revenues & Volume, By Submarine Power Cables, 2022-2032F |
| 7 Singapore Electric Conductors Market Import-Export Trade Statistics |
| 7.1 Singapore Electric Conductors Market Export to Major Countries |
| 7.2 Singapore Electric Conductors Market Imports from Major Countries |
| 8 Singapore Electric Conductors Market Key Performance Indicators |
| 9 Singapore Electric Conductors Market - Opportunity Assessment |
| 9.1 Singapore Electric Conductors Market Opportunity Assessment, By Product Types, 2022 & 2032F |
| 9.2 Singapore Electric Conductors Market Opportunity Assessment, By Applications, 2022 & 2032F |
| 10 Singapore Electric Conductors Market - Competitive Landscape |
| 10.1 Singapore Electric Conductors Market Revenue Share, By Companies, 2025 |
| 10.2 Singapore Electric Conductors Market Competitive Benchmarking, By Operating and Technical Parameters |
| 11 Company Profiles |
| 12 Recommendations |
| 13 Disclaimer |
Global Go To Market Strategy - 2030
Export potential enables firms to identify high-growth global markets with greater confidence by combining advanced trade intelligence with a structured quantitative methodology. The framework analyzes emerging demand trends and country-level import patterns while integrating macroeconomic and trade datasets such as GDP and population forecasts, bilateral import–export flows, tariff structures, elasticity differentials between developed and developing economies, geographic distance, and import demand projections. Using weighted trade values from 2020–2024 as the base period to project country-to-country export potential for 2030, these inputs are operationalized through calculated drivers such as gravity model parameters, tariff impact factors, and projected GDP per-capita growth. Through an analysis of hidden potentials, demand hotspots, and market conditions that are most favorable to success, this method enables firms to focus on target countries, maximize returns, and global expansion with data, backed by accuracy.
By factoring in the projected importer demand gap that is currently unmet and could be potential opportunity, it identifies the potential for the Exporter (Country) among 190 countries, against the general trade analysis, which identifies the biggest importer or exporter.
To discover high-growth global markets and optimize your business strategy:
Click Here
Pricing
- Single User License$ 1,995
- Department License$ 2,400
- Site License$ 3,120
- Global License$ 3,795

Leadership Perspectives from Industry Events
Search
Thought Leadership and Analyst Meet


Our Clients
6WResearch In News
- India Air Conditioner Market Set for Strong Rebound in 2026 After Weather-Led Correction and GST-Driven Recovery: 6Wresearch
- ADAS in India: How Automatic Emergency Braking, Blind Spot Detection & Driver Monitoring are Transforming Road Safety
- Doha a strategic location for EV manufacturing hub: IPA Qatar
- Demand for luxury TVs surging in the GCC, says Samsung
- Empowering Growth: The Thriving Journey of Bangladesh’s Cable Industry
- Demand for luxury TVs surging in the GCC, says Samsung
Latest Reports
- Nicaragua RPG Gaming Market (2026-2032)
- New Zealand RPG Gaming Market (2026-2032)
- Netherlands RPG Gaming Market (2026-2032)
- Nauru RPG Gaming Market (2026-2032)
- Namibia RPG Gaming Market (2026-2032)
- Mozambique RPG Gaming Market (2026-2032)
- Montenegro RPG Gaming Market (2026-2032)
- Mongolia RPG Gaming Market (2026-2032)
- Monaco RPG Gaming Market (2026-2032)
- Micronesia RPG Gaming Market (2026-2032)
Industry Events and Analyst Meet

EV India Expo 2026

HIMTEX 2026

India Refining Summit 2026

India EV Show 2026

EV tech India Expo 2026
Whitepaper
- Middle East & Africa Commercial Security Market Click here to view more.
- Middle East & Africa Fire Safety Systems & Equipment Market Click here to view more.
- GCC Drone Market Click here to view more.
- Middle East Lighting Fixture Market Click here to view more.
- GCC Physical & Perimeter Security Market Click here to view more.