Singapore Electric Connectors Market (2026-2032) | Size, Growth, Trends, Share, Industry, Outlook, Value, Forecast, Companies, Revenue & Analysis
Market Forecast By Type (Aluminum Electrical Connectors, Copper Electrical Connectors, Others), By Application (Electrical Device, Airplanes, National Defense, Industrial Equipments, Others) And Competitive Landscape
| Product Code: ETC019787 | Publication Date: Jul 2023 | Updated Date: Jun 2026 | Product Type: Report | |
| Publisher: 6Wresearch | Author: Ravi Bhandari | No. of Pages: 70 | No. of Figures: 35 | No. of Tables: 5 |
Singapore Electric Connectors Market Summary
The singapore electric connectors market was estimated at USD 1472 Million in 2025 and is projected to reach USD 2143 Million by 2032, growing at a CAGR of 6.2% from 2026 to 2032.
Singapore Electric Connectors Market Year-wise Growth Rate and Key Drivers
This graph highlights how the Singapore Electric Connectors Market has steadily grown over the past five years, supported by major growth factors.
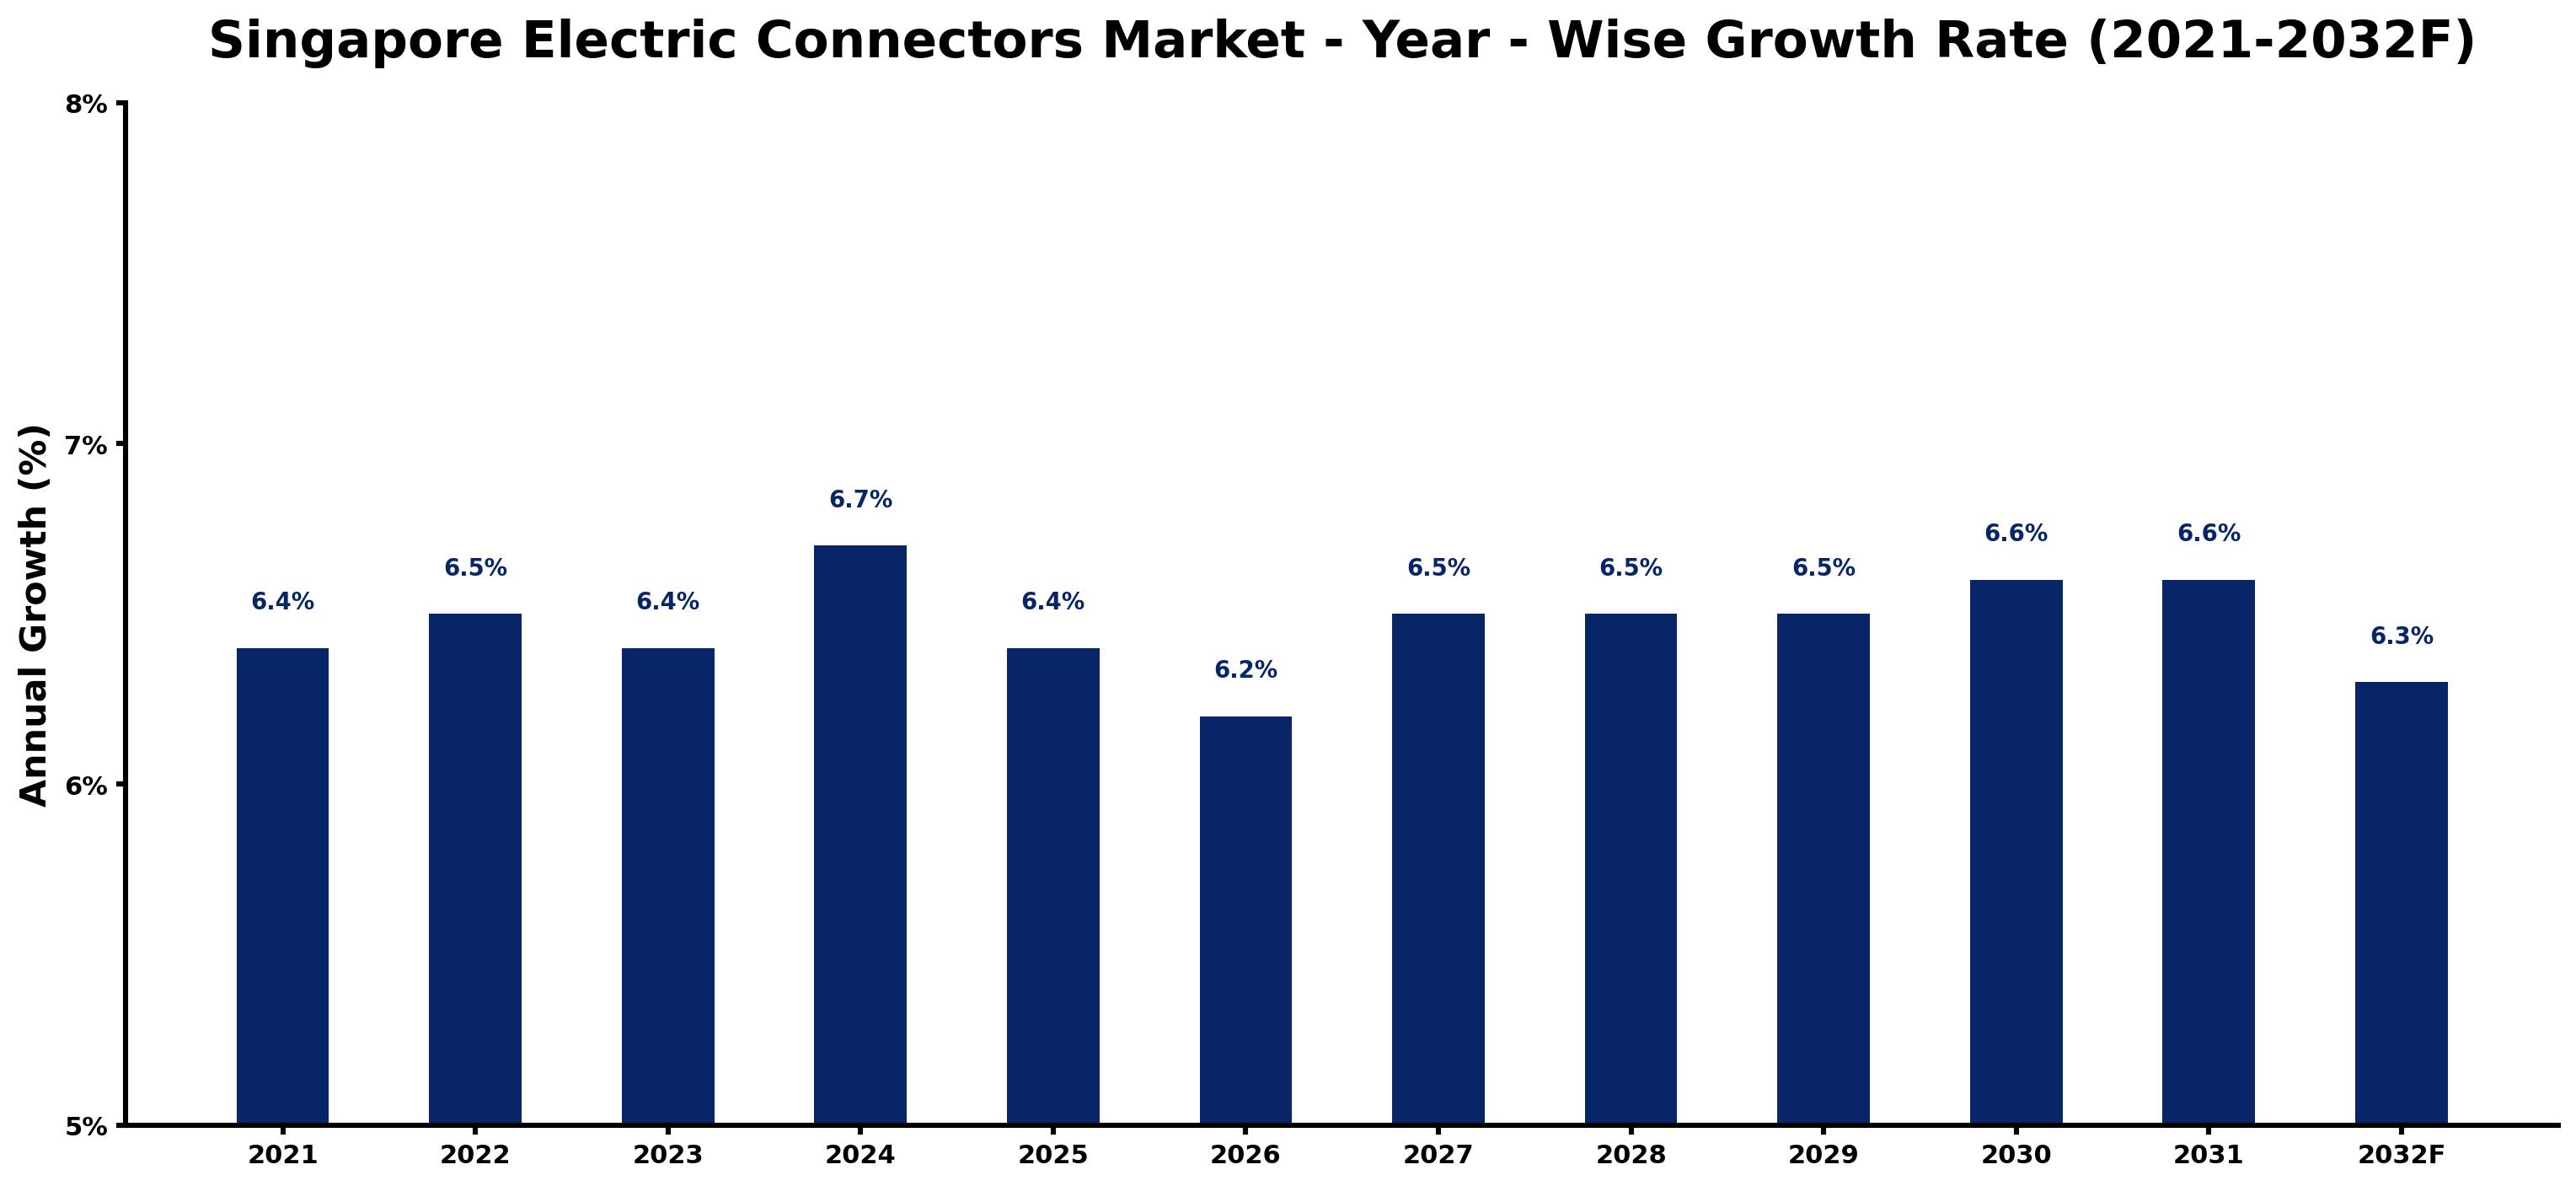
The table below presents the year wise growth rates along with the key drivers influencing the market
| Year | Growth Rate | Major Drivers |
| 2021 | 6.4% | Post-lockdown infrastructure improvements spurred demand for reliable electric connectors. |
| 2022 | 6.5% | Localization efforts attracted investments in Singapore's electric connector manufacturing capabilities. |
| 2023 | 6.4% | Emerging smart city projects increased the need for advanced electrical connectivity solutions. |
| 2024 | 6.7% | Energy efficiency certifications became essential for businesses focused on sustainability. |
| 2025 | 6.4% | Global supply chain disruptions highlighted the importance of local connector production. |
| 2026 | 6.2% | Technological innovations in renewable energy systems required specific connector adaptations. |
| 2027 | 6.5% | Construction industry growth necessitated robust connectors for diverse urban developments. |
| 2028 | 6.5% | Rising electric vehicle adoption increased demand for high-performance charging connectors. |
| 2029 | 6.5% | Digital transformation initiatives created a need for enhanced connectivity in smart devices. |
| 2030 | 6.6% | Smart grid implementations focused on efficient energy distribution, requiring modern connectors. |
| 2031 | 6.6% | Collaboration among tech firms and manufacturers fostered innovative connector solutions. |
| 2032 | 6.3% | Sustainability-focused policies led to increased investments in eco-friendly connector technologies. |
Note - Market size estimations and growth projections presented in this report are based on 6Wresearch's advanced forecasting approach, validated with industry datasets as of June 2026.
Singapore Electric Connectors Market Synopsis
The Singapore Electric Connectors Market is projected to reach 6.2% and witness significant growth during the forecast period (2026-2032). This anticipated expansion is driven by an increase in demand for consumer electronics, automotive components, and substantial investments in infrastructure across Singapore. The country's robust manufacturing sector, supported by various government initiatives such as tax incentives and a skilled labor force, is further facilitating this growth. Moreover, advancements in technology, including automated inspection systems and the utilization of lightweight materials, are expected to boost the market throughout the forecast period.
Singapore Electric Connectors Market Growth Drivers
Several factors are propelling the Singapore Electric Connectors Market. Key drivers include:
- Growing Demand for Consumer Electronics: Singapore hosts numerous leading electronics manufacturers producing a variety of products, including computer hardware, telecommunication devices, and audio equipment. This surge in manufacturing increases the demand for electrical connectors across diverse applications.
- Rising Automotive Component Manufacturing Activities: The increase in disposable income among Singaporean consumers has led to higher demand for both passenger and commercial vehicles. Consequently, automobile component production, including electric connectors, is witnessing significant growth, which is expected to continue through 2032.
- Favorable Government Policies: The Singaporean government supports the manufacturing sector through various incentives, such as tax breaks and subsidies for companies operating in designated industrial parks. These policies encourage manufacturers to invest more in their operations, consequently enhancing the production of electrical connectors.
- Technological Advancements: Innovations in automated inspection systems and the development of advanced miniaturization techniques are enabling manufacturers to produce more efficient and effective electrical connectors, which is likely to drive market growth during the forecast period.
- Growing Infrastructure Investments: The commitment to enhancing Singapore's infrastructure, including smart city developments and transportation projects, is expected to create additional demand for electric connectors, further driving market growth.
Singapore Electric Connectors Market Challenges and Restraints
While the Singapore Electric Connectors Market is poised for growth, it is also confronted with certain challenges that could hinder its overall performance. Key challenges include:
- Need for High-Quality Connectors: Ensuring the safe operation of electronic devices and systems necessitates the production of reliable electrical connector components. However, local manufacturers often face tight budget constraints, making it difficult to maintain high quality and reliability.
- Competition from Imported Products: The influx of imported electrical connectors at competitive prices poses a challenge to local manufacturers. The presence of such products can potentially undermine the market share of domestic companies.
- Volatile Raw Material Prices: Fluctuations in the prices of raw materials required for manufacturing electrical connectors can affect production costs and profitability, thus posing a financial challenge for manufacturers.
- Stringent Regulatory Standards: Manufacturers must comply with various safety and quality regulations, which can complicate the production process and increase operational costs, potentially restricting market growth.
- Technological Disruptions: Rapid changes in technology can lead to the obsolescence of existing products and connectors, necessitating continuous innovation and investment from manufacturers to keep up with industry trends.
Singapore Electric Connectors Market Government Investment and Initiatives
The Singaporean government actively invests in the development of the electrical connectors sector through various initiatives aimed at fostering innovation and growth. The government promotes several policies designed to attract investments, such as offering tax incentives and establishing industrial parks equipped with advanced infrastructure. Additionally, public spending on infrastructure projects continues to rise, creating new opportunities for local manufacturers of electric connectors. Collaborative efforts between academic institutions and industry players, backed by government funding, are also enhancing research and development activities, further contributing to advancements in connector technology.
Singapore Electric Connectors Market Latest Developments (May 2025 - June 2026)
Recent developments within the Singapore Electric Connectors Market indicate a dynamic and evolving landscape. Over the period from May 2025 to June 2026, there have been notable trends in production techniques, with a shift towards more sustainable manufacturing practices in response to increasing environmental concerns. Additionally, advancements in smart technology have stimulated the demand for specialized connectors within the automotive and consumer electronics sectors. Manufacturers are increasingly focusing on enhancing product performance through innovation and are investing in automation and digitalization to streamline operations. Moreover, collaborations between local firms and international technology partners are becoming more prevalent, facilitating knowledge-sharing and technological advancement.
Singapore Electric Connectors Market - Key Attractiveness of the Report
- 10 Years of Market Numbers
- Historical Data Starting from 2022 to 2025
- Base Year: 2025
- Forecast Data until 2032
- Key Performance Indicators Impacting the Market
- Major Upcoming Developments and Projects
Key Highlights of the Report:
- Singapore Electric Connectors Market Outlook
- Market Size of Singapore Electric Connectors Market, 2025
- Forecast of Singapore Electric Connectors Market, 2032F
- Historical Data and Forecast of Singapore Electric Connectors Revenues & Volume for the Period 2022-2032F
- Singapore Electric Connectors Market Trend Evolution
- Singapore Electric Connectors Market Drivers and Challenges
- Singapore Electric Connectors Price Trends
- Singapore Electric Connectors Porter's Five Forces
- Singapore Electric Connectors Industry Life Cycle
- Historical Data and Forecast of Singapore Electric Connectors Market Revenues & Volume By Type for the Period 2022-2032F
- Historical Data and Forecast of Singapore Electric Connectors Market Revenues & Volume By Aluminum Electrical Connectors for the Period 2022-2032F
- Historical Data and Forecast of Singapore Electric Connectors Market Revenues & Volume By Copper Electrical Connectors for the Period 2022-2032F
- Historical Data and Forecast of Singapore Electric Connectors Market Revenues & Volume By Others for the Period 2022-2032F
- Historical Data and Forecast of Singapore Electric Connectors Market Revenues & Volume By ?Application for the Period 2022-2032F
- Historical Data and Forecast of Singapore Electric Connectors Market Revenues & Volume By Electrical Device for the Period 2022-2032F
- Historical Data and Forecast of Singapore Electric Connectors Market Revenues & Volume By Airplanes for the Period 2022-2032F
- Historical Data and Forecast of Singapore Electric Connectors Market Revenues & Volume By National Defense for the Period 2022-2032F
- Historical Data and Forecast of Singapore Electric Connectors Market Revenues & Volume By Industrial Equipments for the Period 2022-2032F
- Historical Data and Forecast of Singapore Electric Connectors Market Revenues & Volume By Others for the Period 2022-2032F
- Singapore Electric Connectors Import Export Trade Statistics
- Market Opportunity Assessment By Type
- Market Opportunity Assessment By ?Application
- Singapore Electric Connectors Top Companies Market Share
- Singapore Electric Connectors Competitive Benchmarking By Technical and Operational Parameters
- Singapore Electric Connectors Company Profiles
- Singapore Electric Connectors Key Strategic Recommendations
Frequently Asked Questions About the Market Study (FAQs):
The growth is primarily driven by rising demand from consumer electronics, automotive manufacturing, and significant infrastructure investments.
Government initiatives such as tax incentives and infrastructure development are encouraging local manufacturers to innovate and expand, positively influencing market dynamics.
Key challenges include maintaining high quality amidst cost constraints, competition from imported products, and regulatory compliance.
Recent trends include a shift towards sustainable manufacturing practices, enhanced product performance through technology, and increased collaborations between local firms and international partners.
6Wresearch actively monitors the Singapore Electric Connectors Market and publishes its comprehensive annual report, highlighting emerging trends, growth drivers, revenue analysis, and forecast outlook. Our insights help businesses to make data-backed strategic decisions with ongoing market dynamics. Our analysts track relevent industries related to the Singapore Electric Connectors Market, allowing our clients with actionable intelligence and reliable forecasts tailored to emerging regional needs.
Yes, we provide customisation as per your requirements. To learn more, feel free to contact us on sales@6wresearch.com
1 Executive Summary |
2 Introduction |
2.1 Key Highlights of the Report |
2.2 Report Description |
2.3 Market Scope & Segmentation |
2.4 Research Methodology |
2.5 Assumptions |
3 Singapore Electric Connectors Market Overview |
3.1 Singapore Country Macro Economic Indicators |
3.2 Singapore Electric Connectors Market Revenues & Volume, 2022 & 2032F |
3.3 Singapore Electric Connectors Market - Industry Life Cycle |
3.4 Singapore Electric Connectors Market - Porter's Five Forces |
3.5 Singapore Electric Connectors Market Revenues & Volume Share, By Type, 2022 & 2032F |
3.6 Singapore Electric Connectors Market Revenues & Volume Share, By Application, 2022 & 2032F |
4 Singapore Electric Connectors Market Dynamics |
4.1 Impact Analysis |
4.2 Market Drivers |
4.3 Market Restraints |
5 Singapore Electric Connectors Market Trends |
6 Singapore Electric Connectors Market, By Types |
6.1 Singapore Electric Connectors Market, By Type |
6.1.1 Overview and Analysis |
6.1.2 Singapore Electric Connectors Market Revenues & Volume, By Type, 2022-2032F |
6.1.3 Singapore Electric Connectors Market Revenues & Volume, By Aluminum Electrical Connectors, 2022-2032F |
6.1.4 Singapore Electric Connectors Market Revenues & Volume, By Copper Electrical Connectors, 2022-2032F |
6.1.5 Singapore Electric Connectors Market Revenues & Volume, By Others, 2022-2032F |
6.2 Singapore Electric Connectors Market, By Application |
6.2.1 Overview and Analysis |
6.2.2 Singapore Electric Connectors Market Revenues & Volume, By Electrical Device, 2022-2032F |
6.2.3 Singapore Electric Connectors Market Revenues & Volume, By Airplanes, 2022-2032F |
6.2.4 Singapore Electric Connectors Market Revenues & Volume, By National Defense, 2022-2032F |
6.2.5 Singapore Electric Connectors Market Revenues & Volume, By Industrial Equipments, 2022-2032F |
6.2.6 Singapore Electric Connectors Market Revenues & Volume, By Others, 2022-2032F |
7 Singapore Electric Connectors Market Import-Export Trade Statistics |
7.1 Singapore Electric Connectors Market Export to Major Countries |
7.2 Singapore Electric Connectors Market Imports from Major Countries |
8 Singapore Electric Connectors Market Key Performance Indicators |
9 Singapore Electric Connectors Market - Opportunity Assessment |
9.1 Singapore Electric Connectors Market Opportunity Assessment, By Type, 2022 & 2032F |
9.2 Singapore Electric Connectors Market Opportunity Assessment, By Application, 2022 & 2032F |
10 Singapore Electric Connectors Market - Competitive Landscape |
10.1 Singapore Electric Connectors Market Revenue Share, By Companies, 2025 |
10.2 Singapore Electric Connectors Market Competitive Benchmarking, By Operating and Technical Parameters |
11 Company Profiles |
12 Recommendations |
13 Disclaimer |
Global Go To Market Strategy - 2030
Export potential enables firms to identify high-growth global markets with greater confidence by combining advanced trade intelligence with a structured quantitative methodology. The framework analyzes emerging demand trends and country-level import patterns while integrating macroeconomic and trade datasets such as GDP and population forecasts, bilateral import–export flows, tariff structures, elasticity differentials between developed and developing economies, geographic distance, and import demand projections. Using weighted trade values from 2020–2024 as the base period to project country-to-country export potential for 2030, these inputs are operationalized through calculated drivers such as gravity model parameters, tariff impact factors, and projected GDP per-capita growth. Through an analysis of hidden potentials, demand hotspots, and market conditions that are most favorable to success, this method enables firms to focus on target countries, maximize returns, and global expansion with data, backed by accuracy.
By factoring in the projected importer demand gap that is currently unmet and could be potential opportunity, it identifies the potential for the Exporter (Country) among 190 countries, against the general trade analysis, which identifies the biggest importer or exporter.
To discover high-growth global markets and optimize your business strategy:
Click Here
Pricing
- Single User License$ 1,995
- Department License$ 2,400
- Site License$ 3,120
- Global License$ 3,795

Leadership Perspectives from Industry Events
Search
Thought Leadership and Analyst Meet


Our Clients
6WResearch In News
- India Air Conditioner Market Set for Strong Rebound in 2026 After Weather-Led Correction and GST-Driven Recovery: 6Wresearch
- ADAS in India: How Automatic Emergency Braking, Blind Spot Detection & Driver Monitoring are Transforming Road Safety
- Doha a strategic location for EV manufacturing hub: IPA Qatar
- Demand for luxury TVs surging in the GCC, says Samsung
- Empowering Growth: The Thriving Journey of Bangladesh’s Cable Industry
- Demand for luxury TVs surging in the GCC, says Samsung
Latest Reports
- Nicaragua RPG Gaming Market (2026-2032)
- New Zealand RPG Gaming Market (2026-2032)
- Netherlands RPG Gaming Market (2026-2032)
- Nauru RPG Gaming Market (2026-2032)
- Namibia RPG Gaming Market (2026-2032)
- Mozambique RPG Gaming Market (2026-2032)
- Montenegro RPG Gaming Market (2026-2032)
- Mongolia RPG Gaming Market (2026-2032)
- Monaco RPG Gaming Market (2026-2032)
- Micronesia RPG Gaming Market (2026-2032)
Industry Events and Analyst Meet

EV India Expo 2026

HIMTEX 2026

India Refining Summit 2026

India EV Show 2026

EV tech India Expo 2026
Whitepaper
- Middle East & Africa Commercial Security Market Click here to view more.
- Middle East & Africa Fire Safety Systems & Equipment Market Click here to view more.
- GCC Drone Market Click here to view more.
- Middle East Lighting Fixture Market Click here to view more.
- GCC Physical & Perimeter Security Market Click here to view more.