Singapore Insulated electric wire & cable Market (2026-2032) | Value, Revenue, Analysis, Growth, Trends, Industry, Forecast, Size, Companies, Outlook, Share
Market Forecast By Types (Metals, Plastics, Optical Fibers), By Applications (Electrical Equipment, Construction, Telecommunications, Motor Vehicles, Industrial Machinery) And Competitive Landscape
| Product Code: ETC039308 | Publication Date: Jul 2023 | Updated Date: Jun 2026 | Product Type: Report | |
| Publisher: 6Wresearch | Author: Ravi Bhandari | No. of Pages: 70 | No. of Figures: 35 | No. of Tables: 5 |
Singapore Insulated electric wire & cable Market Summary
The singapore insulated electric wire & cable market was estimated at USD 314 Million in 2025 and is projected to reach USD 420 Million by 2032, growing at a CAGR of 5.1% from 2026 to 2032.
Singapore Insulated electric wire & cable Market Year-wise Growth Rate and Key Drivers
This graph highlights how the Singapore Insulated electric wire & cable Market has steadily grown over the past five years, supported by major growth factors.
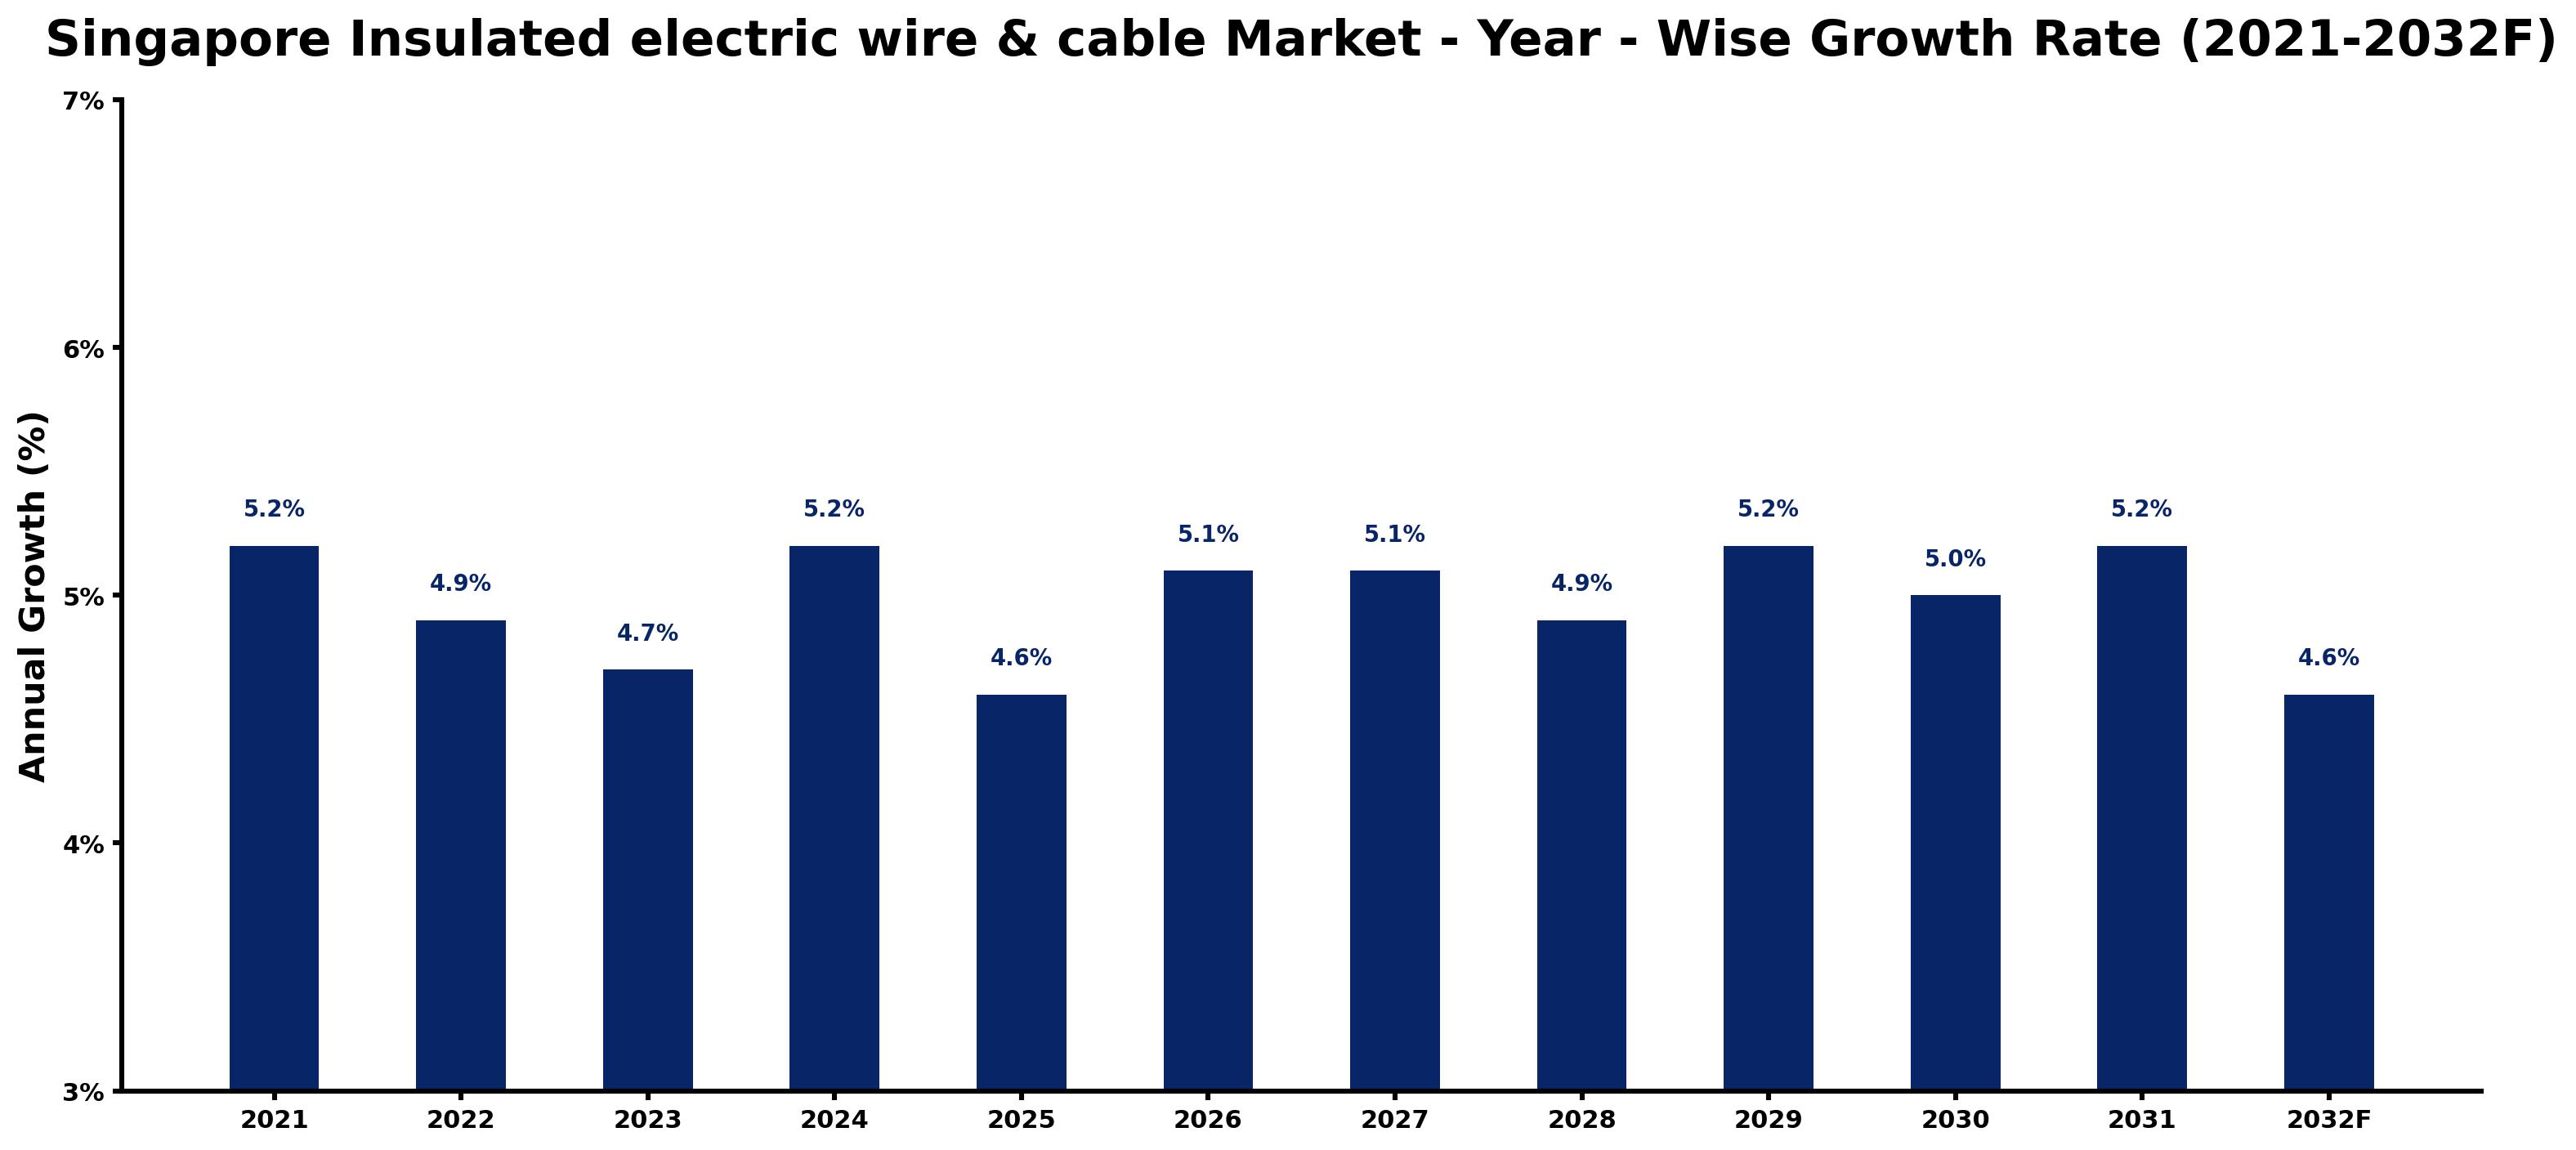
The table below presents the year wise growth rates along with the key drivers influencing the market
| Year | Growth Rate | Major Drivers |
| 2021 | 5.2% | Post-lockdown retail projects initiated heightened electrical infrastructure investments across Singapore. |
| 2022 | 4.9% | Corporate shifts toward smart buildings increased requirements for advanced insulated cables. |
| 2023 | 4.7% | Legacy copper grid failures prompted rapid upgrades to more reliable insulated wiring systems. |
| 2024 | 5.2% | Construction pipelines for urban developments necessitated expanded cable supply and installation services. |
| 2025 | 4.6% | New technological integrations demanded higher performance standards for electric wire applications. |
| 2026 | 5.1% | Investment in renewable energy infrastructures catalyzed a shift towards specialized insulated cabling. |
| 2027 | 5.1% | Emerging data centers required extensive networks of insulated cables for efficient performance. |
| 2028 | 4.9% | Industrial automation trends led to increased demand for durable and flexible wiring solutions. |
| 2029 | 5.2% | Sustainability goals pushed manufacturers to innovate eco-friendly insulated cable products. |
| 2030 | 5.0% | Regional collaborations in ASEAN opened new markets for Singaporean cable manufacturers. |
| 2031 | 5.2% | Urbanization accelerated the need for comprehensive electrical systems in residential projects. |
| 2032 | 4.6% | Technological advancements in insulation materials improved performance and longevity of cable products. |
Note - Market size estimations and growth projections presented in this report are based on 6Wresearch's advanced forecasting approach, validated with industry datasets as of June 2026.
Singapore Insulated electric wire & cable Market Synopsis
The Singapore Insulated electric wire cable Market is projected to reach 5.1% and witness significant growth during the forecast period (2026-2032). This growth is driven by several key factors, including a burgeoning population, a rising demand for electricity, and an increase in construction activities throughout Singapore. Additionally, substantial investments in infrastructure development, particularly within the industrial sector, will bolster the market for insulated electric wires and cables. The government's focus on renewable energy sources, such as solar and wind power, is anticipated to further fuel demand in this segment during the forecast period.
Singapore Insulated electric wire & cable Market Growth Drivers
Several critical drivers are propelling the Singapore Insulated electric wire & cable market. A notable increase in the population has led to greater electricity consumption, thereby escalating the demand for insulated electric wires & cables. This heightened need for reliable and efficient electrical infrastructure fosters significant market opportunities.
- Urbanization across Singapore is driving the need for more residential and commercial constructions, resulting in increased demand for electrical wiring solutions.
- As more households are built and existing infrastructures are upgraded, the call for insulated electric wires & cables intensifies, creating lucrative market potential.
- The rising electricity demand due to lifestyle changes and technology adoption ensures a growing market for insulated wires and cables.
- Government initiatives aimed at enhancing energy efficiency and sustainability are expected to further support market growth.
- Investment in smart grid technologies also encourages demand for advanced insulated electric wires & cables, aligning with modern energy solutions.
Singapore Insulated electric wire & cable Market Government Investment and Initiatives
The Singapore government has implemented several initiatives that significantly impact the insulated electric wire & cable market. These investments focus on various infrastructure development projects aimed at enhancing energy sustainability and reliability. The government's commitment to renewable energy sources, especially solar and wind power, underscores its dedication to developing a more sustainable energy landscape.
- Public funding allocated for upgrading existing electrical infrastructures ensures that the demand for insulated wires and cables remains strong.
- Incentives for companies investing in renewable energy technologies and smart grid capabilities are expected to enhance market penetration.
- Government policies targeting the reduction of carbon emissions promote the adoption of energy-efficient electrical solutions.
- Public-private partnerships aimed at boosting infrastructural resilience are driving demand for advanced insulation technologies in electrical wiring.
- Regulatory frameworks encouraging energy-efficient building designs further support increased consumption of insulated electric wires and cables.
Singapore Insulated electric wire & cable Market Latest Developments (May 2025 - June 2026)
During the period from May 2025 to June 2026, the Singapore insulated electric wire & cable market has shown dynamic adjustments in response to evolving industry trends. Organizations have increasingly focused on integrating environmental considerations into their production processes, reflecting a growing commitment to sustainability.
- There has been a noticeable shift towards the development of eco-friendly insulated wires and cables, aligning with global sustainability trends.
- Technological advancements have enabled manufacturers to enhance the performance characteristics of their products, leading to more efficient electrical solutions.
- With ongoing urban development projects, demand for cutting-edge insulation technologies has surged, leading to new product introductions in the market.
- The recovery from the COVID-19 pandemic contributed to increased consumer spending and a gradual return to pre-pandemic levels of market activity.
- Companies have optimized their supply chains and production methods, resulting in improved operational efficiencies and cost reductions.
Singapore Insulated electric wire & cable Market Challenges and Restraints
Despite the positive outlook for the Singapore Insulated electric wire & cable market, certain challenges persist. The high costs associated with installation can deter potential customers and slow market growth. As a result, businesses must navigate these financial barriers while developing strategies to enhance product value.
- The initial investment required for installation can be significant, making customers cautious about adopting new technologies.
- Economic fluctuations might affect overall construction activity, thereby impacting demand for insulated electric wires and cables.
- Intense competition among suppliers may lead to price wars, eroding profit margins for manufacturers.
- Rising material costs due to global supply chain disruptions can challenge profitability within the sector.
- Regulatory compliance requirements can complicate the production processes and increase operational complexities.
Singapore Insulated electric wire & cable Market - Key Attractiveness of the Report
- 10 Years of Market Numbers
- Historical Data Starting from 2022 to 2025
- Base Year: 2025
- Forecast Data until 2032
- Key Performance Indicators Impacting the Market
- Major Upcoming Developments and Projects
Key Highlights of the Report:
- Singapore Insulated electric wire & cable Market Outlook
- Market Size of Singapore Insulated electric wire & cable Market, 2025
- Forecast of Singapore Insulated electric wire & cable Market, 2032F
- Historical Data and Forecast of Singapore Insulated electric wire & cable Revenues & Volume for the Period 2022-2032F
- Singapore Insulated electric wire & cable Market Trend Evolution
- Singapore Insulated electric wire & cable Market Drivers and Challenges
- Singapore Insulated electric wire & cable Price Trends
- Singapore Insulated electric wire & cable Porter's Five Forces
- Singapore Insulated electric wire & cable Industry Life Cycle
- Historical Data and Forecast of Singapore Insulated electric wire & cable Market Revenues & Volume By Types for the Period 2022-2032F
- Historical Data and Forecast of Singapore Insulated electric wire & cable Market Revenues & Volume By Metals for the Period 2022-2032F
- Historical Data and Forecast of Singapore Insulated electric wire & cable Market Revenues & Volume By Plastics for the Period 2022-2032F
- Historical Data and Forecast of Singapore Insulated electric wire & cable Market Revenues & Volume By Optical Fibers for the Period 2022-2032F
- Historical Data and Forecast of Singapore Insulated electric wire & cable Market Revenues & Volume By Applications for the Period 2022-2032F
- Historical Data and Forecast of Singapore Insulated electric wire & cable Market Revenues & Volume By Electrical Equipment for the Period 2022-2032F
- Historical Data and Forecast of Singapore Insulated electric wire & cable Market Revenues & Volume By Construction for the Period 2022-2032F
- Historical Data and Forecast of Singapore Insulated electric wire & cable Market Revenues & Volume By Telecommunications for the Period 2022-2032F
- Historical Data and Forecast of Singapore Insulated electric wire & cable Market Revenues & Volume By Motor Vehicles for the Period 2022-2032F
- Historical Data and Forecast of Singapore Insulated electric wire & cable Market Revenues & Volume By Industrial Machinery for the Period 2022-2032F
- Singapore Insulated electric wire & cable Import Export Trade Statistics
- Market Opportunity Assessment By Types
- Market Opportunity Assessment By Applications
- Singapore Insulated electric wire & cable Top Companies Market Share
- Singapore Insulated electric wire & cable Competitive Benchmarking By Technical and Operational Parameters
- Singapore Insulated electric wire & cable Company Profiles
- Singapore Insulated electric wire & cable Key Strategic Recommendations
Frequently Asked Questions About the Market Study (FAQs):
Growth is primarily driven by increasing population, rising electricity demand, and expanding construction activities within Singapore.
Government policies promote renewable energy initiatives and sustainability, thereby encouraging investments in insulated electric wires and cables.
The market faces challenges such as high installation costs and fluctuating material prices, alongside the complexities of regulatory compliance.
6Wresearch actively monitors the Singapore Insulated electric wire & cable Market and publishes its comprehensive annual report, highlighting emerging trends, growth drivers, revenue analysis, and forecast outlook. Our insights help businesses to make data-backed strategic decisions with ongoing market dynamics. Our analysts track relevent industries related to the Singapore Insulated electric wire & cable Market, allowing our clients with actionable intelligence and reliable forecasts tailored to emerging regional needs.
Yes, we provide customisation as per your requirements. To learn more, feel free to contact us on sales@6wresearch.com
1 Executive Summary |
2 Introduction |
2.1 Key Highlights of the Report |
2.2 Report Description |
2.3 Market Scope & Segmentation |
2.4 Research Methodology |
2.5 Assumptions |
3 Singapore Insulated electric wire & cable Market Overview |
3.1 Singapore Country Macro Economic Indicators |
3.2 Singapore Insulated electric wire & cable Market Revenues & Volume, 2022 & 2032F |
3.3 Singapore Insulated electric wire & cable Market - Industry Life Cycle |
3.4 Singapore Insulated electric wire & cable Market - Porter's Five Forces |
3.5 Singapore Insulated electric wire & cable Market Revenues & Volume Share, By Types, 2022 & 2032F |
3.6 Singapore Insulated electric wire & cable Market Revenues & Volume Share, By Applications, 2022 & 2032F |
4 Singapore Insulated electric wire & cable Market Dynamics |
4.1 Impact Analysis |
4.2 Market Drivers |
4.3 Market Restraints |
5 Singapore Insulated electric wire & cable Market Trends |
6 Singapore Insulated electric wire & cable Market, By Types |
6.1 Singapore Insulated electric wire & cable Market, By Types |
6.1.1 Overview and Analysis |
6.1.2 Singapore Insulated electric wire & cable Market Revenues & Volume, By Types, 2022-2032F |
6.1.3 Singapore Insulated electric wire & cable Market Revenues & Volume, By Metals, 2022-2032F |
6.1.4 Singapore Insulated electric wire & cable Market Revenues & Volume, By Plastics, 2022-2032F |
6.1.5 Singapore Insulated electric wire & cable Market Revenues & Volume, By Optical Fibers, 2022-2032F |
6.2 Singapore Insulated electric wire & cable Market, By Applications |
6.2.1 Overview and Analysis |
6.2.2 Singapore Insulated electric wire & cable Market Revenues & Volume, By Electrical Equipment, 2022-2032F |
6.2.3 Singapore Insulated electric wire & cable Market Revenues & Volume, By Construction, 2022-2032F |
6.2.4 Singapore Insulated electric wire & cable Market Revenues & Volume, By Telecommunications, 2022-2032F |
6.2.5 Singapore Insulated electric wire & cable Market Revenues & Volume, By Motor Vehicles, 2022-2032F |
6.2.6 Singapore Insulated electric wire & cable Market Revenues & Volume, By Industrial Machinery, 2022-2032F |
7 Singapore Insulated electric wire & cable Market Import-Export Trade Statistics |
7.1 Singapore Insulated electric wire & cable Market Export to Major Countries |
7.2 Singapore Insulated electric wire & cable Market Imports from Major Countries |
8 Singapore Insulated electric wire & cable Market Key Performance Indicators |
9 Singapore Insulated electric wire & cable Market - Opportunity Assessment |
9.1 Singapore Insulated electric wire & cable Market Opportunity Assessment, By Types, 2022 & 2032F |
9.2 Singapore Insulated electric wire & cable Market Opportunity Assessment, By Applications, 2022 & 2032F |
10 Singapore Insulated electric wire & cable Market - Competitive Landscape |
10.1 Singapore Insulated electric wire & cable Market Revenue Share, By Companies, 2025 |
10.2 Singapore Insulated electric wire & cable Market Competitive Benchmarking, By Operating and Technical Parameters |
11 Company Profiles |
12 Recommendations |
13 Disclaimer |
Global Go To Market Strategy - 2030
Export potential enables firms to identify high-growth global markets with greater confidence by combining advanced trade intelligence with a structured quantitative methodology. The framework analyzes emerging demand trends and country-level import patterns while integrating macroeconomic and trade datasets such as GDP and population forecasts, bilateral import–export flows, tariff structures, elasticity differentials between developed and developing economies, geographic distance, and import demand projections. Using weighted trade values from 2020–2024 as the base period to project country-to-country export potential for 2030, these inputs are operationalized through calculated drivers such as gravity model parameters, tariff impact factors, and projected GDP per-capita growth. Through an analysis of hidden potentials, demand hotspots, and market conditions that are most favorable to success, this method enables firms to focus on target countries, maximize returns, and global expansion with data, backed by accuracy.
By factoring in the projected importer demand gap that is currently unmet and could be potential opportunity, it identifies the potential for the Exporter (Country) among 190 countries, against the general trade analysis, which identifies the biggest importer or exporter.
To discover high-growth global markets and optimize your business strategy:
Click Here
Pricing
- Single User License$ 1,995
- Department License$ 2,400
- Site License$ 3,120
- Global License$ 3,795

Leadership Perspectives from Industry Events
Search
Thought Leadership and Analyst Meet


Our Clients
6WResearch In News
- India Air Conditioner Market Set for Strong Rebound in 2026 After Weather-Led Correction and GST-Driven Recovery: 6Wresearch
- ADAS in India: How Automatic Emergency Braking, Blind Spot Detection & Driver Monitoring are Transforming Road Safety
- Doha a strategic location for EV manufacturing hub: IPA Qatar
- Demand for luxury TVs surging in the GCC, says Samsung
- Empowering Growth: The Thriving Journey of Bangladesh’s Cable Industry
- Demand for luxury TVs surging in the GCC, says Samsung
Latest Reports
- Nicaragua RPG Gaming Market (2026-2032)
- New Zealand RPG Gaming Market (2026-2032)
- Netherlands RPG Gaming Market (2026-2032)
- Nauru RPG Gaming Market (2026-2032)
- Namibia RPG Gaming Market (2026-2032)
- Mozambique RPG Gaming Market (2026-2032)
- Montenegro RPG Gaming Market (2026-2032)
- Mongolia RPG Gaming Market (2026-2032)
- Monaco RPG Gaming Market (2026-2032)
- Micronesia RPG Gaming Market (2026-2032)
Industry Events and Analyst Meet

EV India Expo 2026

HIMTEX 2026

India Refining Summit 2026

India EV Show 2026

EV tech India Expo 2026
Whitepaper
- Middle East & Africa Commercial Security Market Click here to view more.
- Middle East & Africa Fire Safety Systems & Equipment Market Click here to view more.
- GCC Drone Market Click here to view more.
- Middle East Lighting Fixture Market Click here to view more.
- GCC Physical & Perimeter Security Market Click here to view more.