Singapore Lead Acid Battery Market Outlook | Analysis, Value, Industry, Trends, Growth, Forecast, Size, Companies, Revenue, Share & COVID-19 IMPACT
Market Forecast By Type (Flooded Lead Acid Batteries, Sealed Lead Acid Batteries), By End User (Automotive, Oil & Gas, Utilities, Telecommunications, Construction, Marine, Others), By Application (Portable-Rechargeable, Stationary, Motive/Traction, Others) And Competitive Landscape
| Product Code: ETC266127 | Publication Date: Aug 2022 | Updated Date: Feb 2026 | Product Type: Market Research Report | |
| Publisher: 6Wresearch | Author: Ravi Bhandari | No. of Pages: 75 | No. of Figures: 35 | No. of Tables: 20 |
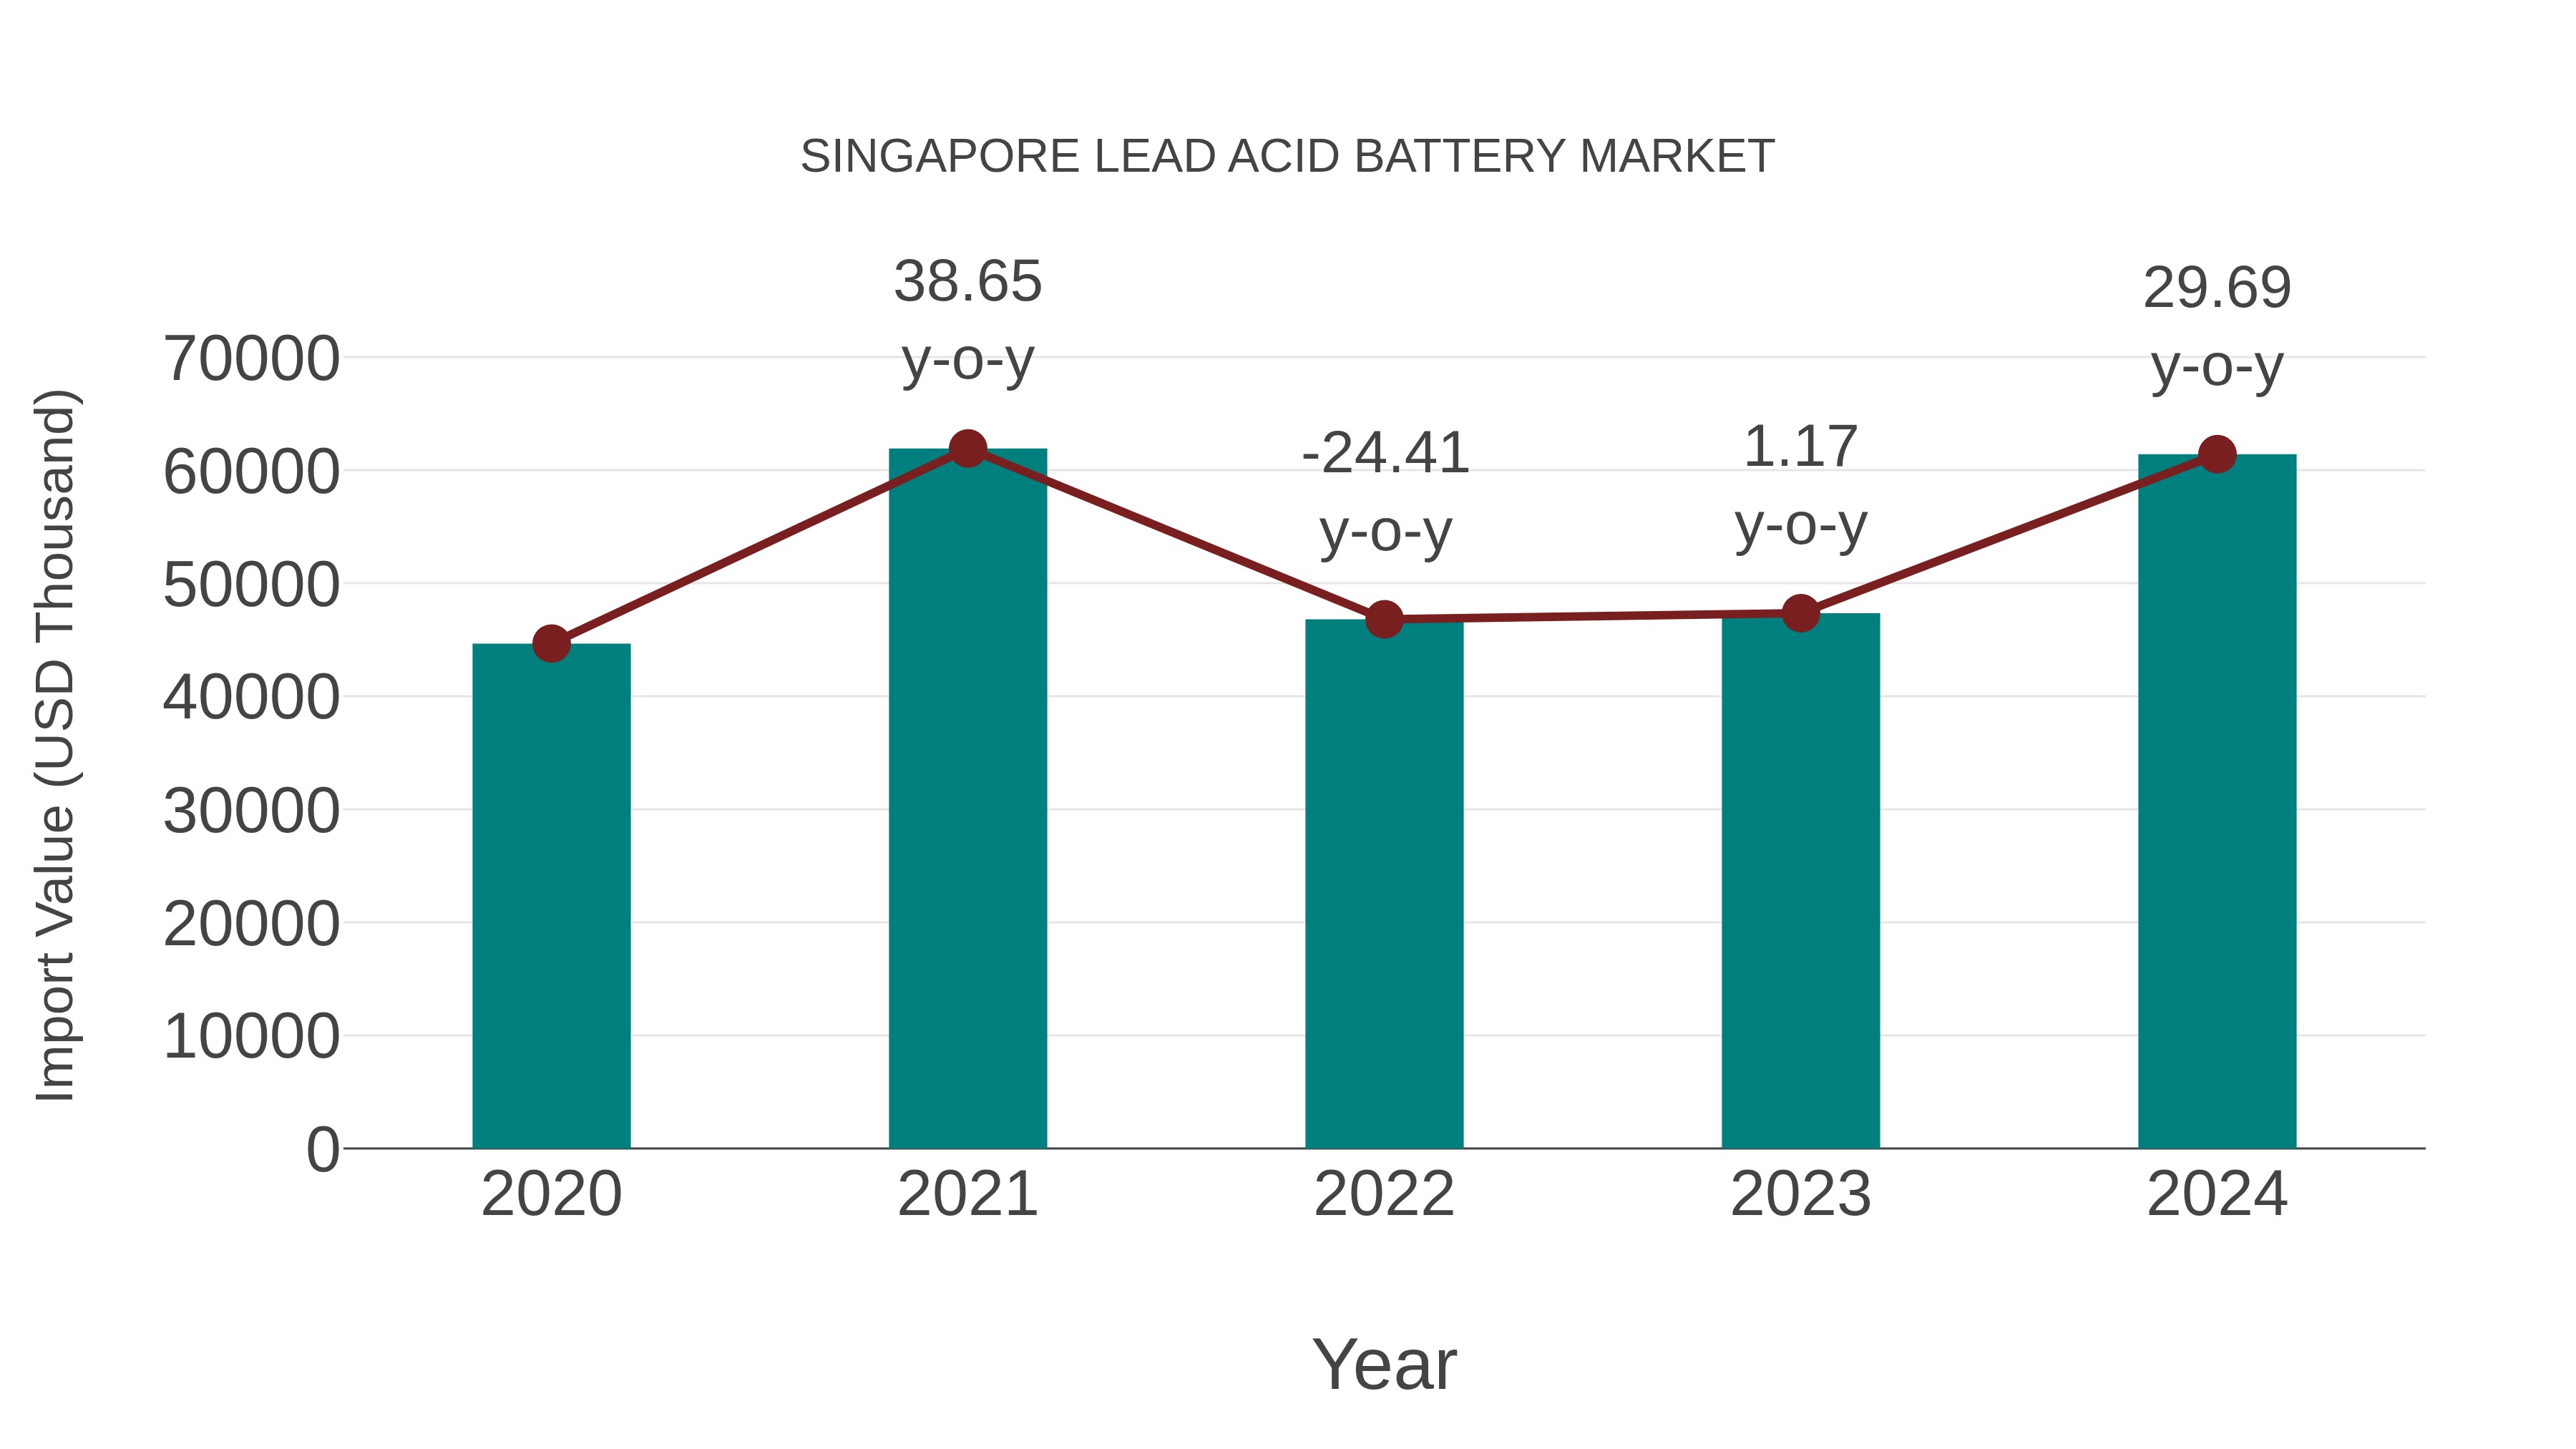
Singapore Lead Acid Battery Market: Import Trend Analysis
In the Singapore lead acid battery market, the import trend exhibited strong growth from 2023 to 2024, with a notable increase of 29.69%. The compound annual growth rate (CAGR) for the period 2020-2024 stood at 8.29%. This import momentum can be attributed to a shift in demand towards more energy-efficient solutions, reflecting market stability and evolving consumer preferences.
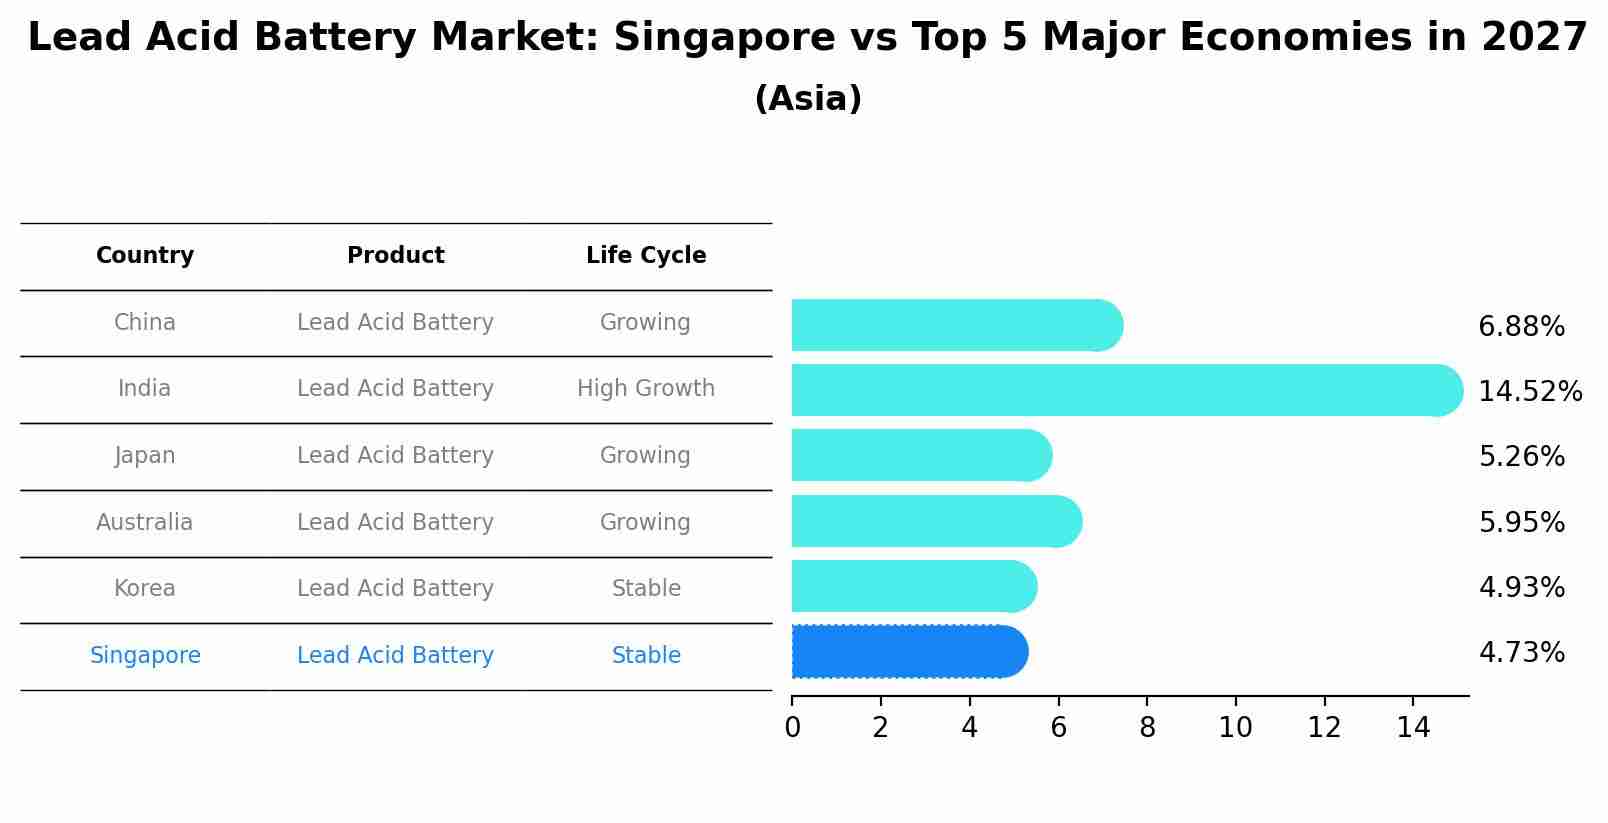
Lead Acid Battery Market: Singapore vs Top 5 Major Economies in 2027 (Asia)
The Lead Acid Battery market in Singapore is projected to grow at a stable growth rate of 4.73% by 2027, highlighting the country's increasing focus on advanced technologies within the Asia region, where China holds the dominant position, followed closely by India, Japan, Australia and South Korea, shaping overall regional demand.
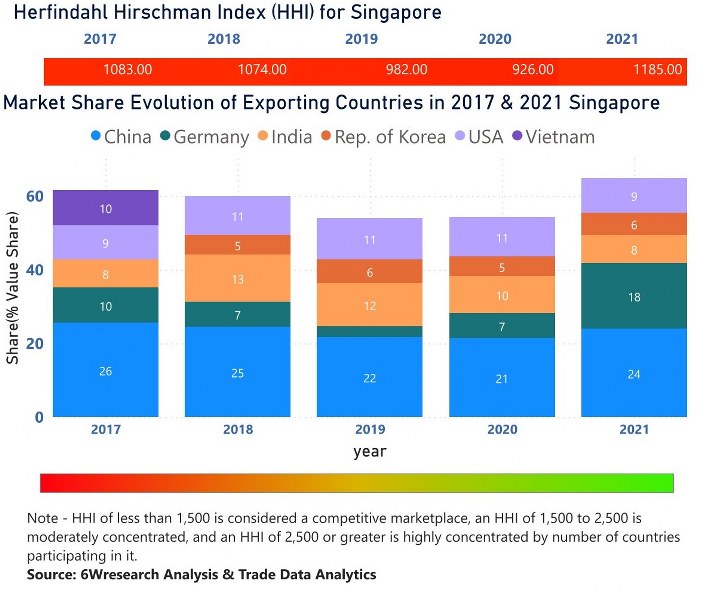
Singapore Lead Acid Market | Country-Wise Share and Competition Analysis
In the year 2021, China was the largest exporter in terms of value, followed by Germany. It has registered a growth of 31.15% over the previous year. While Germany registered a growth of 205.75% as compare to the previous year. In the year 2017 China was the largest exporter followed by Viet Nam. In term of Herfindahl Index, which measures the competitiveness of countries exporting, Singapore has the Herfindahl index of 1083 in 2017 which signifies high competitiveness also in 2021 it registered a Herfindahl index of 1185 which signifies high competitiveness in the market.
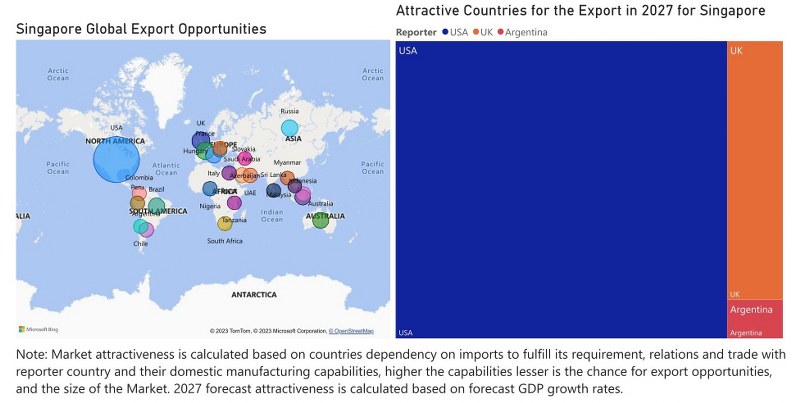
Singapore Lead Acid Market - Export Market Opportunities
Key Highlights of the Report:
- Singapore Lead Acid Battery Market Outlook
- Market Size of Singapore Lead Acid Battery Market, 2021
- Forecast of Singapore Lead Acid Battery Market, 2028
- Historical Data and Forecast of Singapore Lead Acid Battery Revenues & Volume for the Period 2018 - 2028
- Singapore Lead Acid Battery Market Trend Evolution
- Singapore Lead Acid Battery Market Drivers and Challenges
- Singapore Lead Acid Battery Price Trends
- Singapore Lead Acid Battery Porter's Five Forces
- Singapore Lead Acid Battery Industry Life Cycle
- Historical Data and Forecast of Singapore Lead Acid Battery Market Revenues & Volume By Type for the Period 2018 - 2028
- Historical Data and Forecast of Singapore Lead Acid Battery Market Revenues & Volume By Flooded Lead Acid Batteries for the Period 2018 - 2028
- Historical Data and Forecast of Singapore Lead Acid Battery Market Revenues & Volume By Sealed Lead Acid Batteries for the Period 2018 - 2028
- Historical Data and Forecast of Singapore Lead Acid Battery Market Revenues & Volume By End User for the Period 2018 - 2028
- Historical Data and Forecast of Singapore Lead Acid Battery Market Revenues & Volume By Automotive for the Period 2018 - 2028
- Historical Data and Forecast of Singapore Lead Acid Battery Market Revenues & Volume By Oil & Gas for the Period 2018 - 2028
- Historical Data and Forecast of Singapore Lead Acid Battery Market Revenues & Volume By Utilities for the Period 2018 - 2028
- Historical Data and Forecast of Singapore Lead Acid Battery Market Revenues & Volume By Telecommunications for the Period 2018 - 2028
- Historical Data and Forecast of Singapore Lead Acid Battery Market Revenues & Volume By Construction for the Period 2018 - 2028
- Historical Data and Forecast of Singapore Lead Acid Battery Market Revenues & Volume By Marine for the Period 2018 - 2028
- Historical Data and Forecast of Singapore Lead Acid Battery Market Revenues & Volume By Others for the Period 2018 - 2028
- Historical Data and Forecast of Singapore Lead Acid Battery Market Revenues & Volume By Application for the Period 2018 - 2028
- Historical Data and Forecast of Singapore Lead Acid Battery Market Revenues & Volume By Portable-Rechargeable for the Period 2018 - 2028
- Historical Data and Forecast of Singapore Lead Acid Battery Market Revenues & Volume By Stationary for the Period 2018 - 2028
- Historical Data and Forecast of Singapore Lead Acid Battery Market Revenues & Volume By Motive/Traction for the Period 2018 - 2028
- Historical Data and Forecast of Singapore Lead Acid Battery Market Revenues & Volume By Others for the Period 2018 - 2028
- Singapore Lead Acid Battery Import Export Trade Statistics
- Market Opportunity Assessment By Type
- Market Opportunity Assessment By End User
- Market Opportunity Assessment By Application
- Singapore Lead Acid Battery Top Companies Market Share
- Singapore Lead Acid Battery Competitive Benchmarking By Technical and Operational Parameters
- Singapore Lead Acid Battery Company Profiles
- Singapore Lead Acid Battery Key Strategic Recommendations
Frequently Asked Questions About the Market Study (FAQs):
6Wresearch actively monitors the Singapore Lead Acid Battery Market and publishes its comprehensive annual report, highlighting emerging trends, growth drivers, revenue analysis, and forecast outlook. Our insights help businesses to make data-backed strategic decisions with ongoing market dynamics. Our analysts track relevent industries related to the Singapore Lead Acid Battery Market, allowing our clients with actionable intelligence and reliable forecasts tailored to emerging regional needs.
Yes, we provide customisation as per your requirements. To learn more, feel free to contact us on sales@6wresearch.com
| 1 Executive Summary |
| 2 Introduction |
| 2.1 Key Highlights of the Report |
| 2.2 Report Description |
| 2.3 Market Scope & Segmentation |
| 2.4 Research Methodology |
| 2.5 Assumptions |
| 3 Singapore Lead Acid Battery Market Overview |
| 3.1 Singapore Country Macro Economic Indicators |
| 3.2 Singapore Lead Acid Battery Market Revenues & Volume, 2021 & 2028F |
| 3.3 Singapore Lead Acid Battery Market - Industry Life Cycle |
| 3.4 Singapore Lead Acid Battery Market - Porter's Five Forces |
| 3.5 Singapore Lead Acid Battery Market Revenues & Volume Share, By Type, 2021 & 2028F |
| 3.6 Singapore Lead Acid Battery Market Revenues & Volume Share, By End User, 2021 & 2028F |
| 3.7 Singapore Lead Acid Battery Market Revenues & Volume Share, By Application, 2021 & 2028F |
| 4 Singapore Lead Acid Battery Market Dynamics |
| 4.1 Impact Analysis |
| 4.2 Market Drivers |
| 4.2.1 Increasing demand for backup power solutions in various sectors such as telecommunications, data centers, and healthcare. |
| 4.2.2 Growing adoption of electric vehicles and renewable energy systems which require lead acid batteries. |
| 4.2.3 Government initiatives promoting the use of energy storage systems to support sustainability goals. |
| 4.3 Market Restraints |
| 4.3.1 Competition from alternative battery technologies like lithium-ion batteries which offer higher energy density and longer lifespan. |
| 4.3.2 Environmental concerns regarding lead pollution and recycling challenges associated with lead acid batteries. |
| 4.3.3 Fluctuating raw material prices affecting the overall production cost of lead acid batteries. |
| 5 Singapore Lead Acid Battery Market Trends |
| 6 Singapore Lead Acid Battery Market, By Types |
| 6.1 Singapore Lead Acid Battery Market, By Type |
| 6.1.1 Overview and Analysis |
| 6.1.2 Singapore Lead Acid Battery Market Revenues & Volume, By Type, 2018 - 2028F |
| 6.1.3 Singapore Lead Acid Battery Market Revenues & Volume, By Flooded Lead Acid Batteries, 2018 - 2028F |
| 6.1.4 Singapore Lead Acid Battery Market Revenues & Volume, By Sealed Lead Acid Batteries, 2018 - 2028F |
| 6.2 Singapore Lead Acid Battery Market, By End User |
| 6.2.1 Overview and Analysis |
| 6.2.2 Singapore Lead Acid Battery Market Revenues & Volume, By Automotive, 2018 - 2028F |
| 6.2.3 Singapore Lead Acid Battery Market Revenues & Volume, By Oil & Gas, 2018 - 2028F |
| 6.2.4 Singapore Lead Acid Battery Market Revenues & Volume, By Utilities, 2018 - 2028F |
| 6.2.5 Singapore Lead Acid Battery Market Revenues & Volume, By Telecommunications, 2018 - 2028F |
| 6.2.6 Singapore Lead Acid Battery Market Revenues & Volume, By Construction, 2018 - 2028F |
| 6.2.7 Singapore Lead Acid Battery Market Revenues & Volume, By Marine, 2018 - 2028F |
| 6.3 Singapore Lead Acid Battery Market, By Application |
| 6.3.1 Overview and Analysis |
| 6.3.2 Singapore Lead Acid Battery Market Revenues & Volume, By Portable-Rechargeable, 2018 - 2028F |
| 6.3.3 Singapore Lead Acid Battery Market Revenues & Volume, By Stationary, 2018 - 2028F |
| 6.3.4 Singapore Lead Acid Battery Market Revenues & Volume, By Motive/Traction, 2018 - 2028F |
| 6.3.5 Singapore Lead Acid Battery Market Revenues & Volume, By Others, 2018 - 2028F |
| 7 Singapore Lead Acid Battery Market Import-Export Trade Statistics |
| 7.1 Singapore Lead Acid Battery Market Export to Major Countries |
| 7.2 Singapore Lead Acid Battery Market Imports from Major Countries |
| 8 Singapore Lead Acid Battery Market Key Performance Indicators |
8.1 Average cost per kilowatt-hour (kWh) of lead acid batteries. |
8.2 Percentage of lead acid battery recycling rate in Singapore. |
8.3 Adoption rate of lead acid batteries in emerging applications such as energy storage for solar power systems. |
| 9 Singapore Lead Acid Battery Market - Opportunity Assessment |
| 9.1 Singapore Lead Acid Battery Market Opportunity Assessment, By Type, 2021 & 2028F |
| 9.2 Singapore Lead Acid Battery Market Opportunity Assessment, By End User, 2021 & 2028F |
| 9.3 Singapore Lead Acid Battery Market Opportunity Assessment, By Application, 2021 & 2028F |
| 10 Singapore Lead Acid Battery Market - Competitive Landscape |
| 10.1 Singapore Lead Acid Battery Market Revenue Share, By Companies, 2021 |
| 10.2 Singapore Lead Acid Battery Market Competitive Benchmarking, By Operating and Technical Parameters |
| 11 Company Profiles |
| 12 Recommendations |
| 13 Disclaimer |
Global Go To Market Strategy - 2030
Export potential enables firms to identify high-growth global markets with greater confidence by combining advanced trade intelligence with a structured quantitative methodology. The framework analyzes emerging demand trends and country-level import patterns while integrating macroeconomic and trade datasets such as GDP and population forecasts, bilateral import–export flows, tariff structures, elasticity differentials between developed and developing economies, geographic distance, and import demand projections. Using weighted trade values from 2020–2024 as the base period to project country-to-country export potential for 2030, these inputs are operationalized through calculated drivers such as gravity model parameters, tariff impact factors, and projected GDP per-capita growth. Through an analysis of hidden potentials, demand hotspots, and market conditions that are most favorable to success, this method enables firms to focus on target countries, maximize returns, and global expansion with data, backed by accuracy.
By factoring in the projected importer demand gap that is currently unmet and could be potential opportunity, it identifies the potential for the Exporter (Country) among 190 countries, against the general trade analysis, which identifies the biggest importer or exporter.
To discover high-growth global markets and optimize your business strategy:
Click Here
Pricing
- Single User License$ 1,995
- Department License$ 2,400
- Site License$ 3,120
- Global License$ 3,795

Leadership Perspectives from Industry Events
Search
Thought Leadership and Analyst Meet


Our Clients
6WResearch In News
- India Air Conditioner Market Set for Strong Rebound in 2026 After Weather-Led Correction and GST-Driven Recovery: 6Wresearch
- ADAS in India: How Automatic Emergency Braking, Blind Spot Detection & Driver Monitoring are Transforming Road Safety
- Doha a strategic location for EV manufacturing hub: IPA Qatar
- Demand for luxury TVs surging in the GCC, says Samsung
- Empowering Growth: The Thriving Journey of Bangladesh’s Cable Industry
- Demand for luxury TVs surging in the GCC, says Samsung
Latest Reports
- Nicaragua RPG Gaming Market (2026-2032)
- New Zealand RPG Gaming Market (2026-2032)
- Netherlands RPG Gaming Market (2026-2032)
- Nauru RPG Gaming Market (2026-2032)
- Namibia RPG Gaming Market (2026-2032)
- Mozambique RPG Gaming Market (2026-2032)
- Montenegro RPG Gaming Market (2026-2032)
- Mongolia RPG Gaming Market (2026-2032)
- Monaco RPG Gaming Market (2026-2032)
- Micronesia RPG Gaming Market (2026-2032)
Industry Events and Analyst Meet

EV India Expo 2026

HIMTEX 2026

India Refining Summit 2026

India EV Show 2026

EV tech India Expo 2026
Whitepaper
- Middle East & Africa Commercial Security Market Click here to view more.
- Middle East & Africa Fire Safety Systems & Equipment Market Click here to view more.
- GCC Drone Market Click here to view more.
- Middle East Lighting Fixture Market Click here to view more.
- GCC Physical & Perimeter Security Market Click here to view more.