Singapore Low Friction Coating Market (2026-2032) | Industry, Outlook, Companies, Growth, Trends, Forecast, Analysis, Competitive Landscape, Size & Revenue, Segmentation, Value, Share
Market Forecast By Type (Molybdenum Disulphide, Tungsten Disulphide, Polytetrafluoroethylene (PTFE)), By End-User Industry (Automotive, Aerospace, Healthcare, Transportation, Construction), By Application (Bearings, Automotive Parts, Power Transmission Items, Valve components and Actuators, Ammunition Components) And Competitive Landscape
| Product Code: ETC9277362 | Publication Date: Sep 2024 | Updated Date: Feb 2026 | Product Type: Market Research Report | |
| Publisher: 6Wresearch | Author: Bhawna Singh | No. of Pages: 75 | No. of Figures: 35 | No. of Tables: 20 |
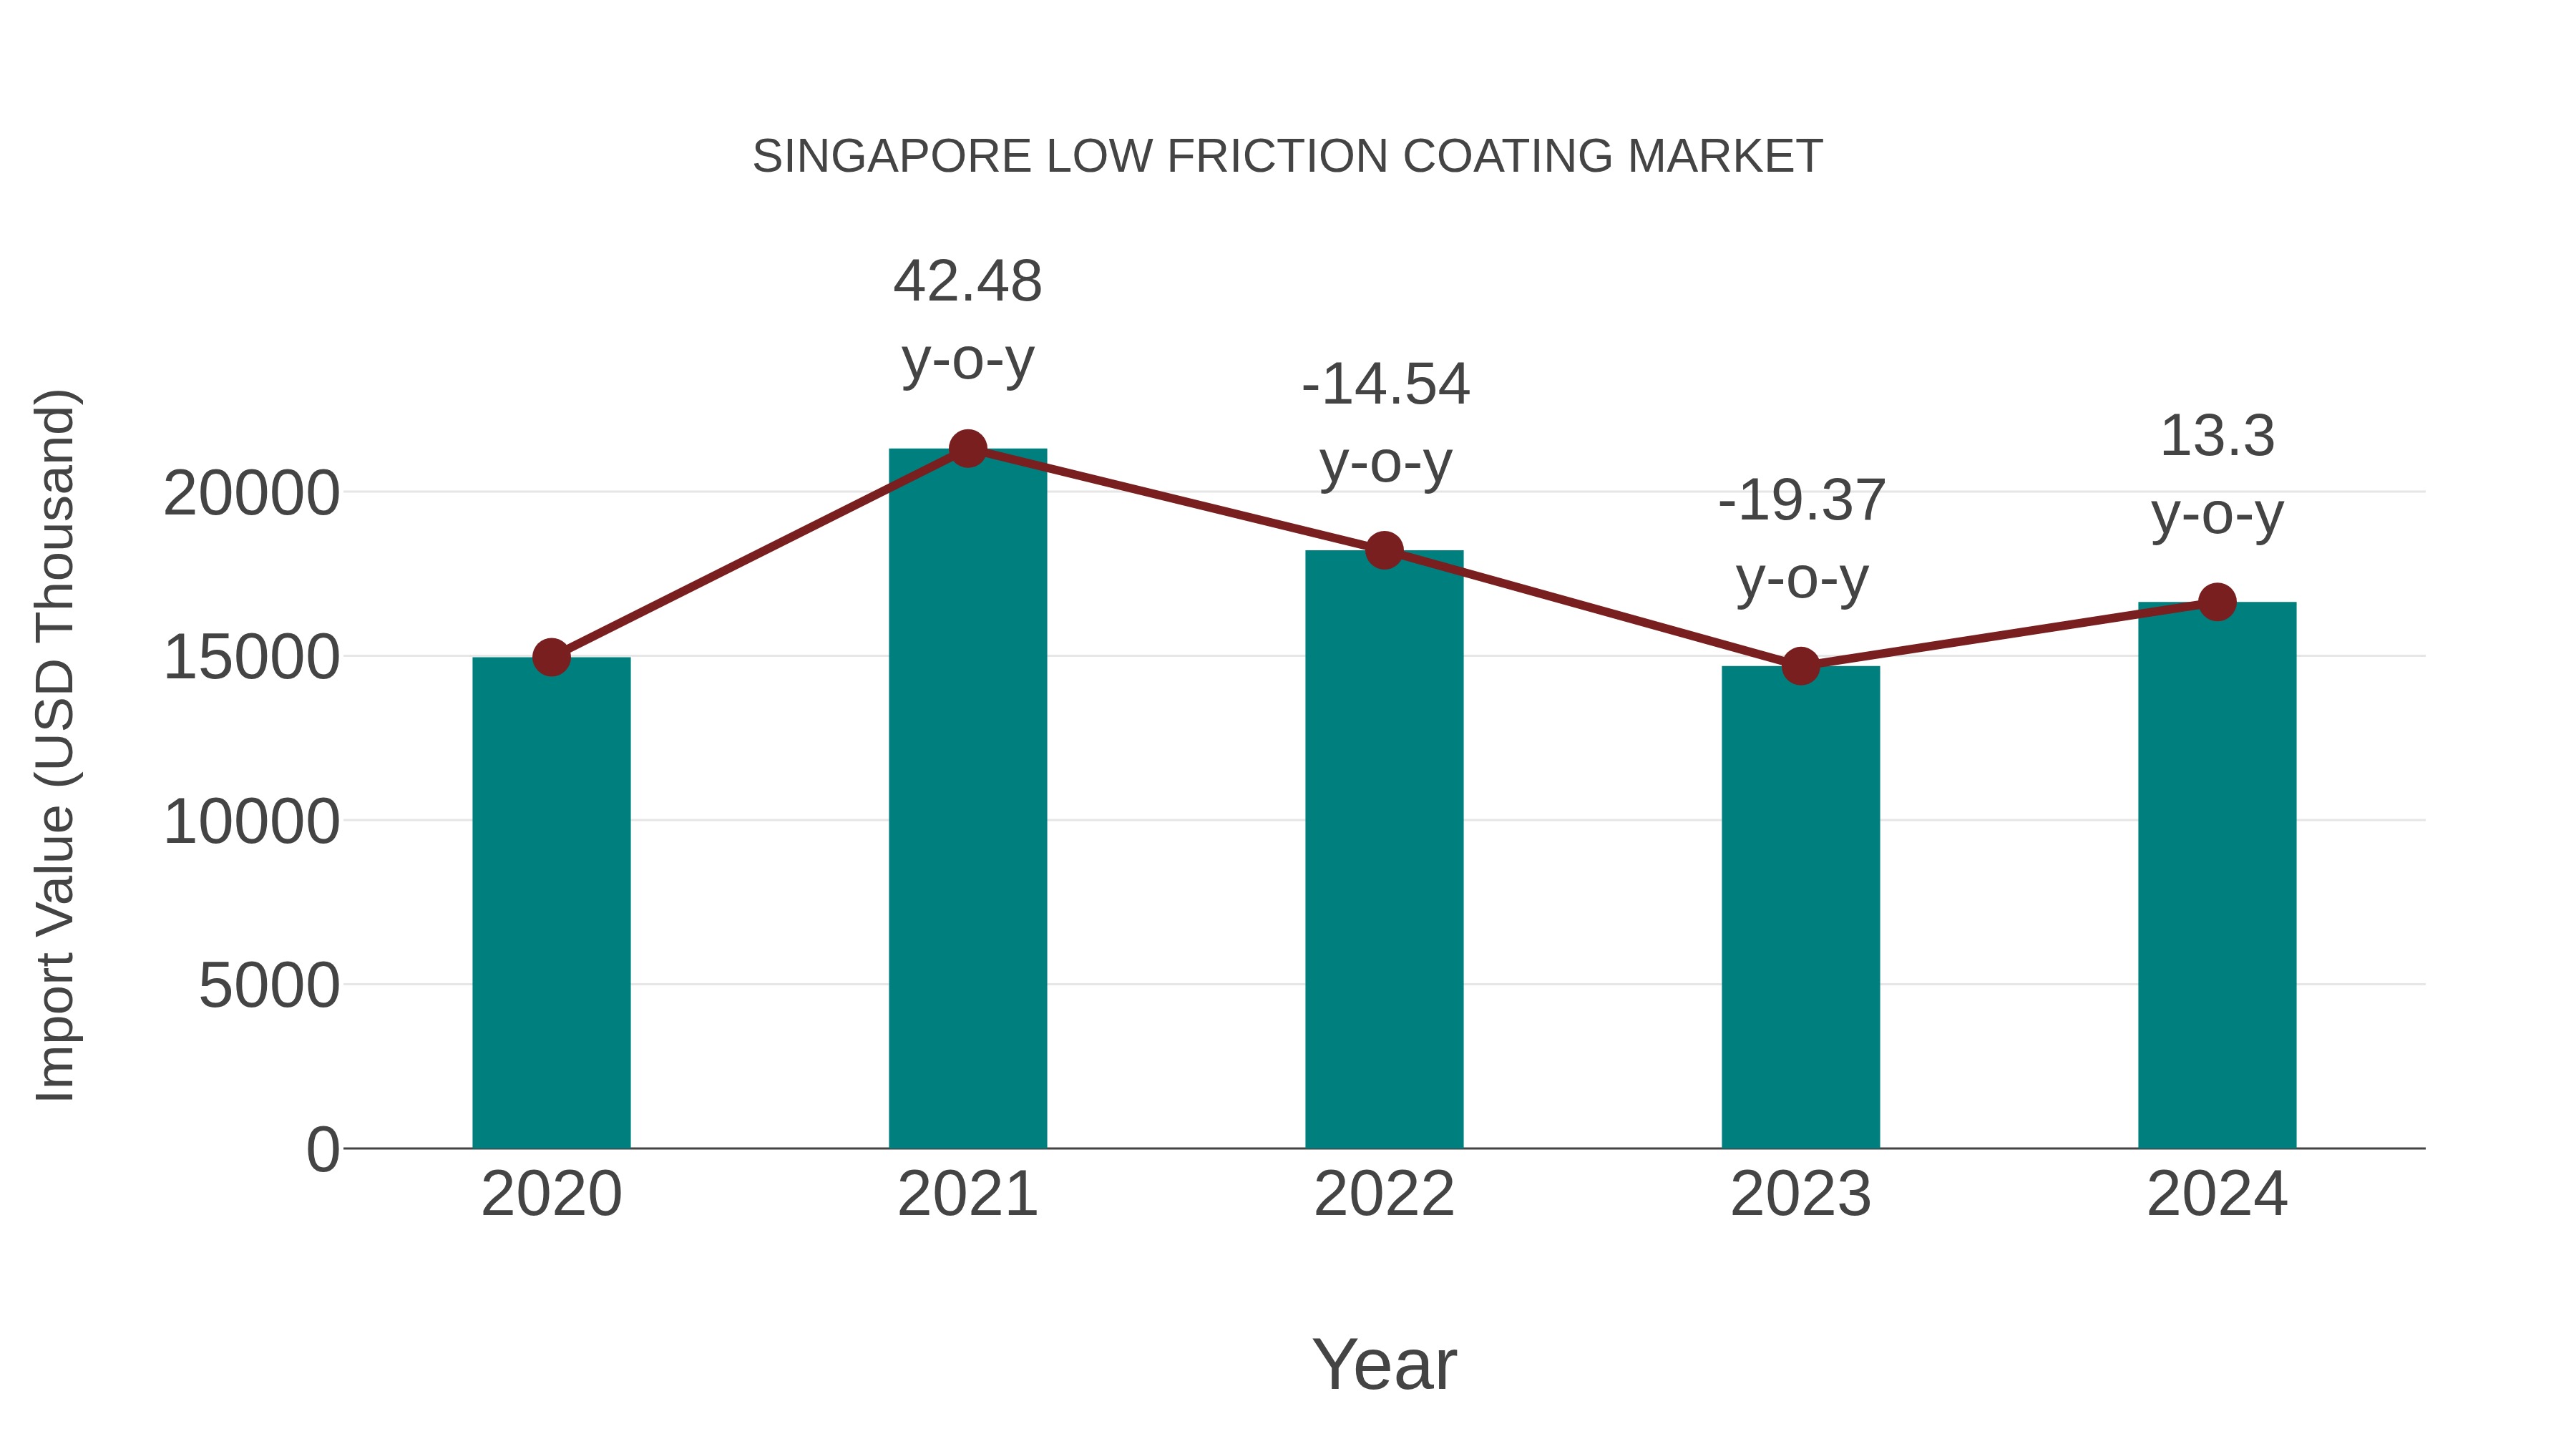
Singapore Low Friction Coating Market: Import Trend Analysis
From 2023 to 2024, Singapore`s import momentum for low friction coatings in the Singapore market showed a notable growth rate of 13.3%. The compound annual growth rate (CAGR) for the period between 2020 and 2024 stood at 2.7%. This upward trend can be attributed to a significant shift in demand towards high-performance coatings, possibly driven by advancements in manufacturing technologies or increased focus on product quality and efficiency.
Key Highlights of the Report:
- Singapore Low Friction Coating Market Outlook
- Market Size of Singapore Low Friction Coating Market, 2025
- Forecast of Singapore Low Friction Coating Market, 2032
- Historical Data and Forecast of Singapore Low Friction Coating Revenues & Volume for the Period 2022-2032F
- Singapore Low Friction Coating Market Trend Evolution
- Singapore Low Friction Coating Market Drivers and Challenges
- Singapore Low Friction Coating Price Trends
- Singapore Low Friction Coating Porter's Five Forces
- Singapore Low Friction Coating Industry Life Cycle
- Historical Data and Forecast of Singapore Low Friction Coating Market Revenues & Volume By Type for the Period 2022-2032F
- Historical Data and Forecast of Singapore Low Friction Coating Market Revenues & Volume By Molybdenum Disulphide for the Period 2022-2032F
- Historical Data and Forecast of Singapore Low Friction Coating Market Revenues & Volume By Tungsten Disulphide for the Period 2022-2032F
- Historical Data and Forecast of Singapore Low Friction Coating Market Revenues & Volume By Polytetrafluoroethylene (PTFE) for the Period 2022-2032F
- Historical Data and Forecast of Singapore Low Friction Coating Market Revenues & Volume By End-User Industry for the Period 2022-2032F
- Historical Data and Forecast of Singapore Low Friction Coating Market Revenues & Volume By Automotive for the Period 2022-2032F
- Historical Data and Forecast of Singapore Low Friction Coating Market Revenues & Volume By Aerospace for the Period 2022-2032F
- Historical Data and Forecast of Singapore Low Friction Coating Market Revenues & Volume By Healthcare for the Period 2022-2032F
- Historical Data and Forecast of Singapore Low Friction Coating Market Revenues & Volume By Transportation for the Period 2022-2032F
- Historical Data and Forecast of Singapore Low Friction Coating Market Revenues & Volume By Construction for the Period 2022-2032F
- Historical Data and Forecast of Singapore Low Friction Coating Market Revenues & Volume By Application for the Period 2022-2032F
- Historical Data and Forecast of Singapore Low Friction Coating Market Revenues & Volume By Bearings for the Period 2022-2032F
- Historical Data and Forecast of Singapore Low Friction Coating Market Revenues & Volume By Automotive Parts for the Period 2022-2032F
- Historical Data and Forecast of Singapore Low Friction Coating Market Revenues & Volume By Power Transmission Items for the Period 2022-2032F
- Historical Data and Forecast of Singapore Low Friction Coating Market Revenues & Volume By Valve components and Actuators for the Period 2022-2032F
- Historical Data and Forecast of Singapore Low Friction Coating Market Revenues & Volume By Ammunition Components for the Period 2022-2032F
- Singapore Low Friction Coating Import Export Trade Statistics
- Market Opportunity Assessment By Type
- Market Opportunity Assessment By End-User Industry
- Market Opportunity Assessment By Application
- Singapore Low Friction Coating Top Companies Market Share
- Singapore Low Friction Coating Competitive Benchmarking By Technical and Operational Parameters
- Singapore Low Friction Coating Company Profiles
- Singapore Low Friction Coating Key Strategic Recommendations
Frequently Asked Questions About the Market Study (FAQs):
6Wresearch actively monitors the Singapore Low Friction Coating Market and publishes its comprehensive annual report, highlighting emerging trends, growth drivers, revenue analysis, and forecast outlook. Our insights help businesses to make data-backed strategic decisions with ongoing market dynamics. Our analysts track relevent industries related to the Singapore Low Friction Coating Market, allowing our clients with actionable intelligence and reliable forecasts tailored to emerging regional needs.
Yes, we provide customisation as per your requirements. To learn more, feel free to contact us on sales@6wresearch.com
1 Executive Summary |
2 Introduction |
2.1 Key Highlights of the Report |
2.2 Report Description |
2.3 Market Scope & Segmentation |
2.4 Research Methodology |
2.5 Assumptions |
3 Singapore Low Friction Coating Market Overview |
3.1 Singapore Country Macro Economic Indicators |
3.2 Singapore Low Friction Coating Market Revenues & Volume, 2022 & 2032F |
3.3 Singapore Low Friction Coating Market - Industry Life Cycle |
3.4 Singapore Low Friction Coating Market - Porter's Five Forces |
3.5 Singapore Low Friction Coating Market Revenues & Volume Share, By Type, 2022 & 2032F |
3.6 Singapore Low Friction Coating Market Revenues & Volume Share, By End-User Industry, 2022 & 2032F |
3.7 Singapore Low Friction Coating Market Revenues & Volume Share, By Application, 2022 & 2032F |
4 Singapore Low Friction Coating Market Dynamics |
4.1 Impact Analysis |
4.2 Market Drivers |
4.2.1 Growing demand for low friction coatings in various industries such as automotive, aerospace, and manufacturing due to the need for enhanced efficiency and reduced wear and tear. |
4.2.2 Increasing focus on sustainability and environmental regulations driving the adoption of low friction coatings as they reduce energy consumption and emissions. |
4.2.3 Technological advancements leading to the development of more efficient and durable low friction coating solutions. |
4.3 Market Restraints |
4.3.1 High initial costs associated with the application of low friction coatings may deter some potential customers from adopting these solutions. |
4.3.2 Limited awareness and understanding of the benefits of low friction coatings among certain industry segments could hinder market growth. |
4.3.3 Competition from alternative technologies or traditional lubrication methods may pose a challenge to the market penetration of low friction coatings. |
5 Singapore Low Friction Coating Market Trends |
6 Singapore Low Friction Coating Market, By Types |
6.1 Singapore Low Friction Coating Market, By Type |
6.1.1 Overview and Analysis |
6.1.2 Singapore Low Friction Coating Market Revenues & Volume, By Type, 2022-2032F |
6.1.3 Singapore Low Friction Coating Market Revenues & Volume, By Molybdenum Disulphide, 2022-2032F |
6.1.4 Singapore Low Friction Coating Market Revenues & Volume, By Tungsten Disulphide, 2022-2032F |
6.1.5 Singapore Low Friction Coating Market Revenues & Volume, By Polytetrafluoroethylene (PTFE), 2022-2032F |
6.2 Singapore Low Friction Coating Market, By End-User Industry |
6.2.1 Overview and Analysis |
6.2.2 Singapore Low Friction Coating Market Revenues & Volume, By Automotive, 2022-2032F |
6.2.3 Singapore Low Friction Coating Market Revenues & Volume, By Aerospace, 2022-2032F |
6.2.4 Singapore Low Friction Coating Market Revenues & Volume, By Healthcare, 2022-2032F |
6.2.5 Singapore Low Friction Coating Market Revenues & Volume, By Transportation, 2022-2032F |
6.2.6 Singapore Low Friction Coating Market Revenues & Volume, By Construction, 2022-2032F |
6.3 Singapore Low Friction Coating Market, By Application |
6.3.1 Overview and Analysis |
6.3.2 Singapore Low Friction Coating Market Revenues & Volume, By Bearings, 2022-2032F |
6.3.3 Singapore Low Friction Coating Market Revenues & Volume, By Automotive Parts, 2022-2032F |
6.3.4 Singapore Low Friction Coating Market Revenues & Volume, By Power Transmission Items, 2022-2032F |
6.3.5 Singapore Low Friction Coating Market Revenues & Volume, By Valve components and Actuators, 2022-2032F |
6.3.6 Singapore Low Friction Coating Market Revenues & Volume, By Ammunition Components, 2022-2032F |
7 Singapore Low Friction Coating Market Import-Export Trade Statistics |
7.1 Singapore Low Friction Coating Market Export to Major Countries |
7.2 Singapore Low Friction Coating Market Imports from Major Countries |
8 Singapore Low Friction Coating Market Key Performance Indicators |
8.1 Reduction in maintenance frequency or costs for companies using low friction coatings. |
8.2 Increase in the lifespan of equipment or machinery after applying low friction coatings. |
8.3 Number of new partnerships or collaborations between low friction coating manufacturers and industry players for product development or market expansion. |
9 Singapore Low Friction Coating Market - Opportunity Assessment |
9.1 Singapore Low Friction Coating Market Opportunity Assessment, By Type, 2022 & 2032F |
9.2 Singapore Low Friction Coating Market Opportunity Assessment, By End-User Industry, 2022 & 2032F |
9.3 Singapore Low Friction Coating Market Opportunity Assessment, By Application, 2022 & 2032F |
10 Singapore Low Friction Coating Market - Competitive Landscape |
10.1 Singapore Low Friction Coating Market Revenue Share, By Companies, 2025 |
10.2 Singapore Low Friction Coating Market Competitive Benchmarking, By Operating and Technical Parameters |
11 Company Profiles |
12 Recommendations |
13 Disclaimer |
Global Go To Market Strategy - 2030
Export potential enables firms to identify high-growth global markets with greater confidence by combining advanced trade intelligence with a structured quantitative methodology. The framework analyzes emerging demand trends and country-level import patterns while integrating macroeconomic and trade datasets such as GDP and population forecasts, bilateral import–export flows, tariff structures, elasticity differentials between developed and developing economies, geographic distance, and import demand projections. Using weighted trade values from 2020–2024 as the base period to project country-to-country export potential for 2030, these inputs are operationalized through calculated drivers such as gravity model parameters, tariff impact factors, and projected GDP per-capita growth. Through an analysis of hidden potentials, demand hotspots, and market conditions that are most favorable to success, this method enables firms to focus on target countries, maximize returns, and global expansion with data, backed by accuracy.
By factoring in the projected importer demand gap that is currently unmet and could be potential opportunity, it identifies the potential for the Exporter (Country) among 190 countries, against the general trade analysis, which identifies the biggest importer or exporter.
To discover high-growth global markets and optimize your business strategy:
Click Here
Pricing
- Single User License$ 1,995
- Department License$ 2,400
- Site License$ 3,120
- Global License$ 3,795

Leadership Perspectives from Industry Events
Search
Thought Leadership and Analyst Meet


Our Clients
6WResearch In News
- Doha a strategic location for EV manufacturing hub: IPA Qatar
- Demand for luxury TVs surging in the GCC, says Samsung
- Empowering Growth: The Thriving Journey of Bangladesh’s Cable Industry
- Demand for luxury TVs surging in the GCC, says Samsung
- Video call with a traditional healer? Once unthinkable, it’s now common in South Africa
- Intelligent Buildings To Smooth GCC’s Path To Net Zero
Latest Reports
- Taiwan Airport Wireless Infrastructure Market (2026-2032)
- Vietnam Airport Wireless Infrastructure Market (2026-2032)
- Thailand Airport Wireless Infrastructure Market (2026-2032)
- South Korea Airport Wireless Infrastructure Market (2026-2032)
- Romania Airport Wireless Infrastructure Market (2026-2032)
- Qatar Airport Wireless Infrastructure Market (2026-2032)
- Philippines Airport Wireless Infrastructure Market (2026-2032)
- Japan Airport Wireless Infrastructure Market (2026-2032)
- Taiwan Airport Winter Services Market (2026-2032)
- Vietnam Airport Winter Services Market (2026-2032)
Industry Events and Analyst Meet

HIMTEX 2026

India Refining Summit 2026

India EV Show 2026

EV tech India Expo 2026

Auto Tech Asia 2026
Whitepaper
- Middle East & Africa Commercial Security Market Click here to view more.
- Middle East & Africa Fire Safety Systems & Equipment Market Click here to view more.
- GCC Drone Market Click here to view more.
- Middle East Lighting Fixture Market Click here to view more.
- GCC Physical & Perimeter Security Market Click here to view more.