Singapore Potassium Cyanate Market (2026-2032) Outlook | Share, Industry, Analysis, Size, Growth, Trends, Revenue, Forecast, Companies & Value
Market Forecast By Types (Low Purity, High Purity), By Applications (Gold Plating, Electronic Devices, Jewelry and Watches, Fashion items, Others) And Competitive Landscape
| Product Code: ETC204459 | Publication Date: May 2022 | Updated Date: Jul 2026 | Product Type: Market Research Report | |
| Publisher: 6Wresearch | Author: Ravi Bhandari | No. of Pages: 60 | No. of Figures: 40 | No. of Tables: 7 |
Singapore Potassium Cyanate Market Size, Share & Growth Rate
The Singapore Potassium Cyanate Market was estimated at USD 155 Million in 2025 and is projected to reach USD 210 Million by 2032, growing at a CAGR of 4.4% from 2026 to 2032. This growth trajectory is driven by the increasing application of potassium cyanate in various industrial sectors, particularly pharmaceuticals and agrochemicals, both of which are experiencing heightened demand. The stability of Singapores chemical industry and ongoing investment in research capabilities further enhance this market's potential.
Singapore Potassium Cyanate Market Year-wise Growth Rate and Key Drivers
This graph highlights how the Singapore Potassium Cyanate Market has steadily grown over the years, supported by major growth factors.
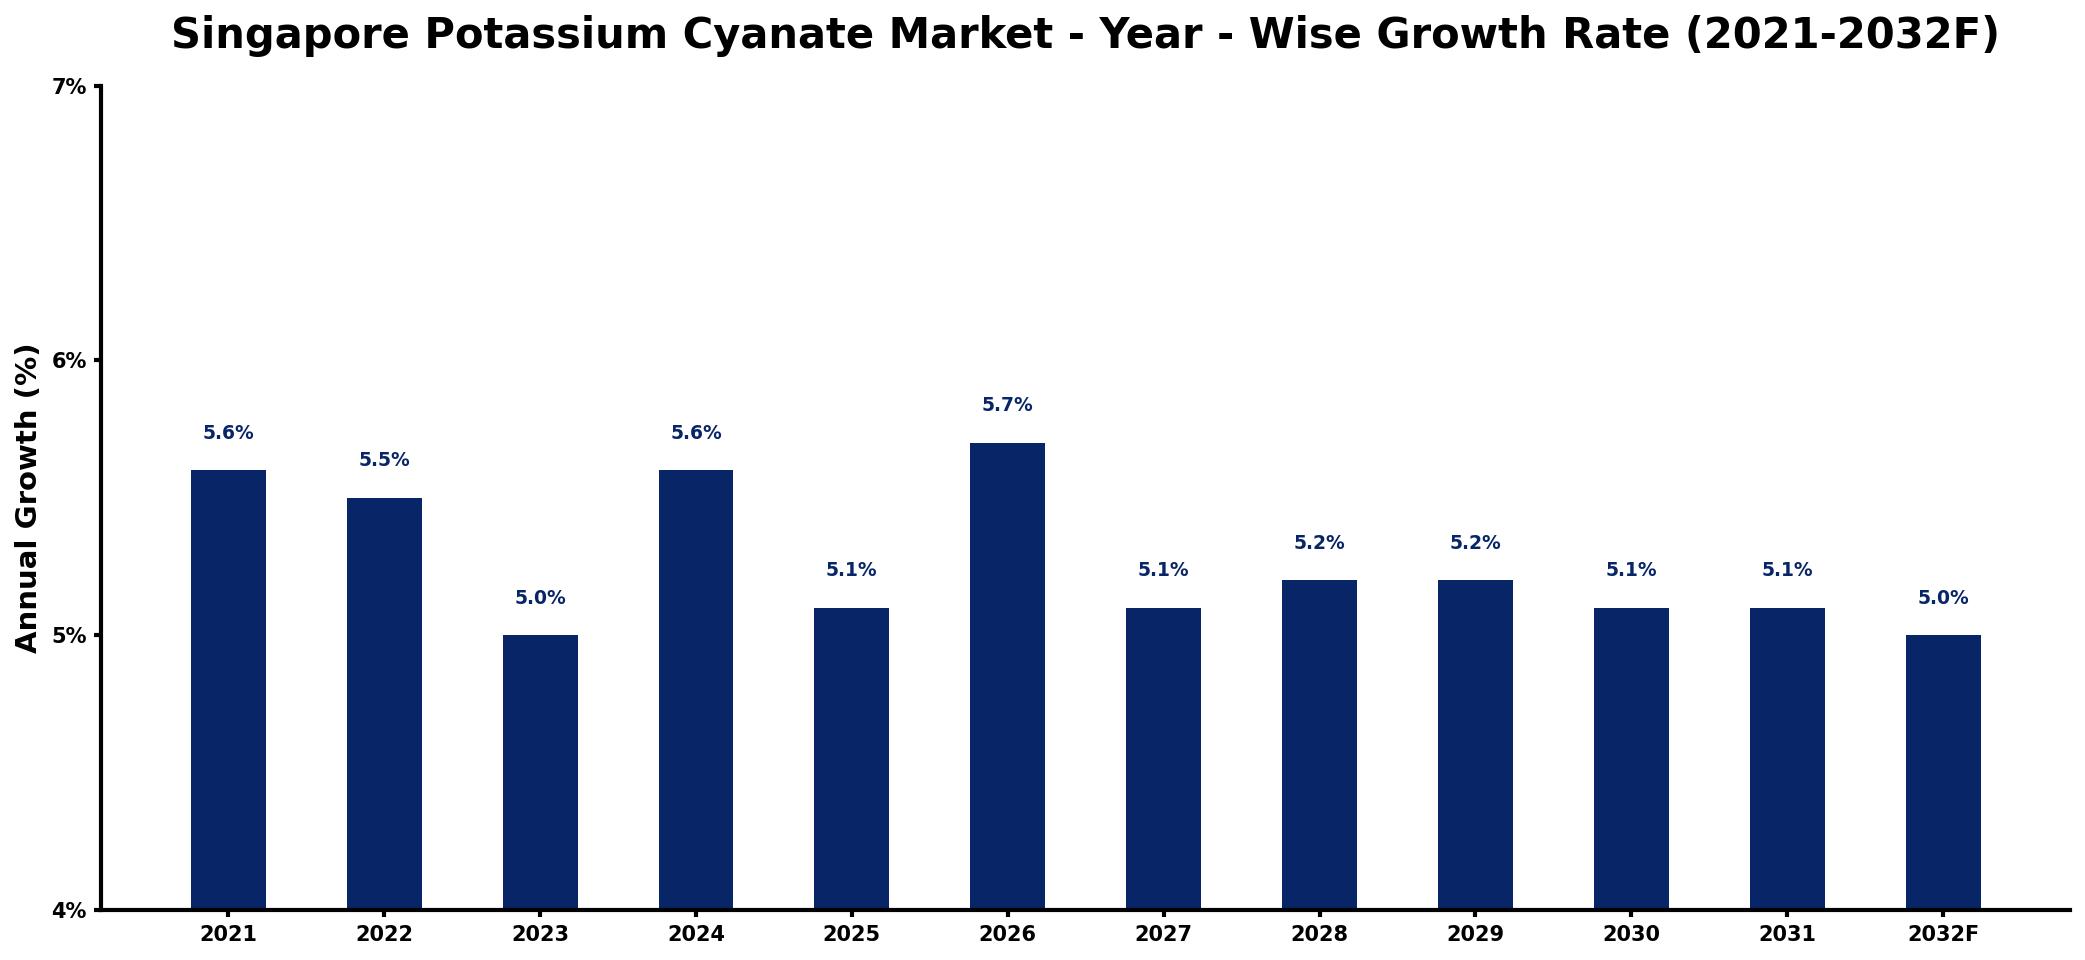
The table below presents the year‑wise growth rates along with the key drivers influencing the market
| Year | Growth Rate | Major Drivers |
| 2021 | 5.6% | Increased demand from agriculture sector |
| 2022 | 5.5% | Growth in pharmaceutical applications market |
| 2023 | 5.0% | Rising investments in chemical manufacturing |
| 2024 | 5.6% | Expansion of industrial applications usage |
| 2025 | 5.1% | Growing need for specialty chemicals |
| 2026 | 5.7% | increased domestic production output |
| 2027 | 5.1% | Increased adoption in water treatment |
| 2028 | 5.2% | Higher production capacities established |
| 2029 | 5.2% | Emergence of new application areas |
| 2030 | 5.1% | Strengthened regulatory support initiatives |
| 2031 | 5.1% | Growing focus on sustainable practices |
| 2032 | 5.0% | Higher consumer awareness on quality |
Note: Market size estimations and growth projections presented in this report are based on 6Wresearch's proprietary forecasting methodology, utilizing the latest available industry data, government publications, and primary research inputs.
Singapore Potassium Cyanate Market Synopsis
The Singapore potassium cyanate market has witnessed a steady yet niche development in recent years, supported by the robust performance of the chemical and pharmaceutical sectors. As industries demand more specialized chemicals for complex processes, the relevance of potassium cyanate has been underscored.
Looking ahead, the market is poised for moderate growth as companies adapt to stringent safety regulations and invest in technology for enhanced production capabilities. The regulatory environment will remain a key factor influencing market dynamics, with an emphasis on responsible handling practices becoming increasingly critical.
Singapore Potassium Cyanate Market Key Takeaways
- The market is set to experience growth driven by the demand for potassium cyanate in pharmaceuticals and specialty chemicals.
- Safety regulations significantly shape operational frameworks within the industry, influencing production costs.
- Investment in R&D is essential for companies to maintain competitiveness amid market fluctuations.
- COVID-19 has introduced both challenges and growth opportunities, particularly in pharmaceutical applications.
- The established chemical industry in Singapore serves as a backbone for sustaining the potassium cyanate market.
Evaluation of Restraints in Singapore Potassium Cyanate Market
The growth of the Singapore potassium cyanate market faces several constraints. Regulatory hurdles associated with the handling of toxic materials like potassium cyanate necessitate significant investment in compliance measures, which can strain operational budgets. Additionally, the niche nature of this market limits its scalability, as demand is closely linked to specific industrial applications. Companies must prioritize safety protocols and effective waste management systems, which can divert resources away from innovation and cost-reduction strategies. Lastly, ensuring quality control amidst market fluctuations adds a layer of complexity that can hinder growth.
Singapore Potassium Cyanate Market Trends
Several trends are shaping the Singapore potassium cyanate market. The growing emphasis on sustainability in chemical manufacturing has prompted companies to explore more environmentally friendly practices, including waste reduction and safer production methods. Furthermore, advancements in technology are paving the way for more efficient synthesis processes, which can optimize potassium cyanate applications across various industries. There is also a notable increase in collaboration among companies for research and development, aimed at improving product efficacy and safety standards.
Singapore Potassium Cyanate Market Opportunities
The Singapore potassium cyanate market presents genuine growth opportunities primarily in the pharmaceutical sector, which continues to expand in response to global healthcare demands. Additionally, as agrochemical applications evolve, there is potential for potassium cyanate to play a vital role in developing novel solutions. Investing in R&D, particularly for innovative applications and processes, will also open avenues for new market entrants and existing players alike. Companies that focus on enhancing production efficiency while adhering to safety standards will be well-positioned to capitalize on emerging trends.
Government Initiatives in the Singapore Potassium Cyanate Market
The Singaporean government has initiated various policies aimed at bolstering the chemical industry, including potassium cyanate production. Programs focusing on sustainability, innovation, and safety protocols are integral to public spending in this sector. The government also promotes collaborations between industry players and research institutions to drive advancements in chemical technologies. Additionally, regulatory frameworks are being refined to balance industrial growth with environmental considerations, ensuring that the market operates within stringent safety standards.
Future Insights of the Singapore Potassium Cyanate Market
From 2026 to 2032, the Singapore potassium cyanate market is expected to evolve significantly as global dynamics shift. With ongoing innovations in chemical processes and increasing environmental consciousness, companies will likely focus on enhancing safety measures while improving production efficiency. The rising demand for high-purity potassium cyanate in pharmaceuticals and other specialty chemicals will further drive the market. By embracing technological advancements and collaborating closely with regulatory bodies, businesses can effectively navigate challenges and position themselves for sustainable growth in this sector.
Singapore Potassium Cyanate Market Latest Developments (2025 - 2026)
In recent months, the Singapore potassium cyanate market has seen a notable shift toward adopting stricter safety protocols and innovative production techniques. Companies are investing in enhanced waste management systems to comply with evolving regulations, which has led to improved operational efficiency. Furthermore, partnerships between industry players and research institutions have accelerated the development of new applications for potassium cyanate, reflecting a growing interest in sustainable practices. These developments indicate a proactive approach to market challenges while capitalizing on emerging opportunities.
Singapore Potassium Cyanate Market - Key Attractiveness of the Report
- 10 Years of Market Numbers
- Historical Data Starting from 2022 to 2025
- Base Year: 2025
- Forecast Data until 2032
- Key Performance Indicators Impacting the Market
- Major Upcoming Developments and Projects
Key Highlights of the Report:
- Singapore Potassium Cyanate Market Outlook
- Market Size of Singapore Potassium Cyanate Market, 2025
- Forecast of Singapore Potassium Cyanate Market, 2032
- Historical Data and Forecast of Singapore Potassium Cyanate Revenues & Volume for the Period 2022-2032F
- Singapore Potassium Cyanate Market Trend Evolution
- Singapore Potassium Cyanate Market Drivers and Challenges
- Singapore Potassium Cyanate Price Trends
- Singapore Potassium Cyanate Porter's Five Forces
- Singapore Potassium Cyanate Industry Life Cycle
- Historical Data and Forecast of Singapore Potassium Cyanate Market Revenues & Volume By Types for the Period 2022-2032F
- Historical Data and Forecast of Singapore Potassium Cyanate Market Revenues & Volume By Low Purity for the Period 2022-2032F
- Historical Data and Forecast of Singapore Potassium Cyanate Market Revenues & Volume By High Purity for the Period 2022-2032F
- Historical Data and Forecast of Singapore Potassium Cyanate Market Revenues & Volume By Applications for the Period 2022-2032F
- Historical Data and Forecast of Singapore Potassium Cyanate Market Revenues & Volume By Gold Plating for the Period 2022-2032F
- Historical Data and Forecast of Singapore Potassium Cyanate Market Revenues & Volume By Electronic Devices for the Period 2022-2032F
- Historical Data and Forecast of Singapore Potassium Cyanate Market Revenues & Volume By Jewelry and Watches for the Period 2022-2032F
- Historical Data and Forecast of Singapore Potassium Cyanate Market Revenues & Volume By Fashion items for the Period 2022-2032F
- Historical Data and Forecast of Singapore Potassium Cyanate Market Revenues & Volume By Others for the Period 2022-2032F
- Singapore Potassium Cyanate Import Export Trade Statistics
- Market Opportunity Assessment By Types
- Market Opportunity Assessment By Applications
- Singapore Potassium Cyanate Top Companies Market Share
- Singapore Potassium Cyanate Competitive Benchmarking By Technical and Operational Parameters
- Singapore Potassium Cyanate Company Profiles
- Singapore Potassium Cyanate Key Strategic Recommendations
Frequently Asked Questions About the Market Study (FAQs):
Potassium cyanate is primarily used in the chemical synthesis of pharmaceuticals and specialty chemicals, making it essential in various industrial applications.
The market was estimated at USD 155 Million in 2025 and is projected to reach USD 210 Million by 2032, which indicates a CAGR of 4.4% from 2026 to 2032, showcasing strong growth potential.
The potassium cyanate market must navigate stringent safety regulations and compliance requirements due to the toxicity of cyanates, which can increase operational costs and necessitate substantial investment in safety measures.
The pandemic led to disruptions in the chemical production industry, but it also resulted in a surge in the pharmaceutical sector, positively influencing the demand for potassium cyanate.
The ongoing technological advancements focus on improving production efficiency and safety measures, enabling companies to enhance their competitiveness in this niche market.
6Wresearch actively monitors the Singapore Potassium Cyanate Market and publishes its comprehensive annual report, highlighting emerging trends, growth drivers, revenue analysis, and forecast outlook. Our insights help businesses to make data-backed strategic decisions with ongoing market dynamics. Our analysts track relevent industries related to the Singapore Potassium Cyanate Market, allowing our clients with actionable intelligence and reliable forecasts tailored to emerging regional needs.
Yes, we provide customisation as per your requirements. To learn more, feel free to contact us on sales@6wresearch.com
1 Executive Summary |
2 Introduction |
2.1 Key Highlights of the Report |
2.2 Report Description |
2.3 Market Scope & Segmentation |
2.4 Research Methodology |
2.5 Assumptions |
3 Singapore Potassium Cyanate Market Overview |
3.1 Singapore Country Macro Economic Indicators |
3.2 Singapore Potassium Cyanate Market Revenues & Volume, 2022 & 2032F |
3.3 Singapore Potassium Cyanate Market - Industry Life Cycle |
3.4 Singapore Potassium Cyanate Market - Porter's Five Forces |
3.5 Singapore Potassium Cyanate Market Revenues & Volume Share, By Types, 2022 & 2032F |
3.6 Singapore Potassium Cyanate Market Revenues & Volume Share, By Applications, 2022 & 2032F |
4 Singapore Potassium Cyanate Market Dynamics |
4.1 Impact Analysis |
4.2 Market Drivers |
4.2.1 Growing demand for potassium cyanate in the electronics industry for manufacturing of semiconductors and other electronic components. |
4.2.2 Increasing use of potassium cyanate in the agriculture sector as a fertilizer to enhance crop yield and quality. |
4.2.3 Rising investments in research and development activities to explore new applications and technologies utilizing potassium cyanate. |
4.3 Market Restraints |
4.3.1 Stringent regulations and environmental concerns regarding the handling and disposal of potassium cyanate. |
4.3.2 Fluctuating prices of raw materials used in the production of potassium cyanate impacting overall production costs. |
5 Singapore Potassium Cyanate Market Trends |
6 Singapore Potassium Cyanate Market, By Types |
6.1 Singapore Potassium Cyanate Market, By Types |
6.1.1 Overview and Analysis |
6.1.2 Singapore Potassium Cyanate Market Revenues & Volume, By Types, 2022-2032F |
6.1.3 Singapore Potassium Cyanate Market Revenues & Volume, By Low Purity, 2022-2032F |
6.1.4 Singapore Potassium Cyanate Market Revenues & Volume, By High Purity, 2022-2032F |
6.2 Singapore Potassium Cyanate Market, By Applications |
6.2.1 Overview and Analysis |
6.2.2 Singapore Potassium Cyanate Market Revenues & Volume, By Gold Plating, 2022-2032F |
6.2.3 Singapore Potassium Cyanate Market Revenues & Volume, By Electronic Devices, 2022-2032F |
6.2.4 Singapore Potassium Cyanate Market Revenues & Volume, By Jewelry and Watches, 2022-2032F |
6.2.5 Singapore Potassium Cyanate Market Revenues & Volume, By Fashion items, 2022-2032F |
6.2.6 Singapore Potassium Cyanate Market Revenues & Volume, By Others, 2022-2032F |
7 Singapore Potassium Cyanate Market Import-Export Trade Statistics |
7.1 Singapore Potassium Cyanate Market Export to Major Countries |
7.2 Singapore Potassium Cyanate Market Imports from Major Countries |
8 Singapore Potassium Cyanate Market Key Performance Indicators |
8.1 Research and development expenditure focused on potassium cyanate-related projects. |
8.2 Number of patents filed for innovations in potassium cyanate applications. |
8.3 Adoption rate of potassium cyanate in new industries or applications. |
8.4 Percentage of agricultural areas using potassium cyanate as a fertilizer. |
8.5 Environmental compliance metrics related to the handling and disposal of potassium cyanate. |
9 Singapore Potassium Cyanate Market - Opportunity Assessment |
9.1 Singapore Potassium Cyanate Market Opportunity Assessment, By Types, 2022 & 2032F |
9.2 Singapore Potassium Cyanate Market Opportunity Assessment, By Applications, 2022 & 2032F |
10 Singapore Potassium Cyanate Market - Competitive Landscape |
10.1 Singapore Potassium Cyanate Market Revenue Share, By Companies, 2025 |
10.2 Singapore Potassium Cyanate Market Competitive Benchmarking, By Operating and Technical Parameters |
11 Company Profiles |
12 Recommendations |
13 Disclaimer |
Global Go To Market Strategy - 2030
Export potential enables firms to identify high-growth global markets with greater confidence by combining advanced trade intelligence with a structured quantitative methodology. The framework analyzes emerging demand trends and country-level import patterns while integrating macroeconomic and trade datasets such as GDP and population forecasts, bilateral import–export flows, tariff structures, elasticity differentials between developed and developing economies, geographic distance, and import demand projections. Using weighted trade values from 2020–2024 as the base period to project country-to-country export potential for 2030, these inputs are operationalized through calculated drivers such as gravity model parameters, tariff impact factors, and projected GDP per-capita growth. Through an analysis of hidden potentials, demand hotspots, and market conditions that are most favorable to success, this method enables firms to focus on target countries, maximize returns, and global expansion with data, backed by accuracy.
By factoring in the projected importer demand gap that is currently unmet and could be potential opportunity, it identifies the potential for the Exporter (Country) among 190 countries, against the general trade analysis, which identifies the biggest importer or exporter.
To discover high-growth global markets and optimize your business strategy:
Click Here
Pricing
- Single User License$ 1,995
- Department License$ 2,400
- Site License$ 3,120
- Global License$ 3,795

Leadership Perspectives from Industry Events
Search
Thought Leadership and Analyst Meet


Our Clients
6WResearch In News
- India Air Conditioner Market Set for Strong Rebound in 2026 After Weather-Led Correction and GST-Driven Recovery: 6Wresearch
- ADAS in India: How Automatic Emergency Braking, Blind Spot Detection & Driver Monitoring are Transforming Road Safety
- Doha a strategic location for EV manufacturing hub: IPA Qatar
- Demand for luxury TVs surging in the GCC, says Samsung
- Empowering Growth: The Thriving Journey of Bangladesh’s Cable Industry
- Demand for luxury TVs surging in the GCC, says Samsung
Latest Reports
- Nicaragua RPG Gaming Market (2026-2032)
- New Zealand RPG Gaming Market (2026-2032)
- Netherlands RPG Gaming Market (2026-2032)
- Nauru RPG Gaming Market (2026-2032)
- Namibia RPG Gaming Market (2026-2032)
- Mozambique RPG Gaming Market (2026-2032)
- Montenegro RPG Gaming Market (2026-2032)
- Mongolia RPG Gaming Market (2026-2032)
- Monaco RPG Gaming Market (2026-2032)
- Micronesia RPG Gaming Market (2026-2032)
Industry Events and Analyst Meet

EV India Expo 2026

HIMTEX 2026

India Refining Summit 2026

India EV Show 2026

EV tech India Expo 2026
Whitepaper
- Middle East & Africa Commercial Security Market Click here to view more.
- Middle East & Africa Fire Safety Systems & Equipment Market Click here to view more.
- GCC Drone Market Click here to view more.
- Middle East Lighting Fixture Market Click here to view more.
- GCC Physical & Perimeter Security Market Click here to view more.