Singapore Solenoid Valve Market (2026-2032) Outlook | Industry, Share, Revenue, Forecast, Trends, Value, Analysis, Companies, Size & Growth
Market Forecast By Body Material (Stainless Steel, Brass, Aluminium, Plastic), By Valve Design Type (2-way, 3-way, 4-way, 5-way), By Industry (Oil & Gas, Chemical & Petrochemical, Water & Wastewater, Food & Beverages, Power Generation, Pharmaceuticals, Automotive, Others) And Competitive Landscape
| Product Code: ETC129253 | Publication Date: Jul 2023 | Updated Date: Jun 2026 | Product Type: Report | |
| Publisher: 6Wresearch | Author: Ravi Bhandari | No. of Pages: 70 | No. of Figures: 35 | No. of Tables: 5 |
Singapore Solenoid Valve Market Size, Share & Growth Rate
The Singapore Solenoid Valve Market was estimated at USD 229 Million in 2025 and is projected to reach USD 302 Million by 2032, growing at a CAGR of 4.0% from 2026 to 2032. This upward trajectory is primarily driven by the increasing integration of industrial automation across sectors, boosting the demand for reliable fluid control solutions. Additionally, the urgent need for effective water and wastewater treatment solutions amidst Singapore's water scarcity issues significantly propels market growth.
Singapore Solenoid Valve Market Year-wise Growth Rate and Key Drivers
This graph highlights how the Singapore Solenoid Valve Market has steadily grown over the years, supported by major growth factors.
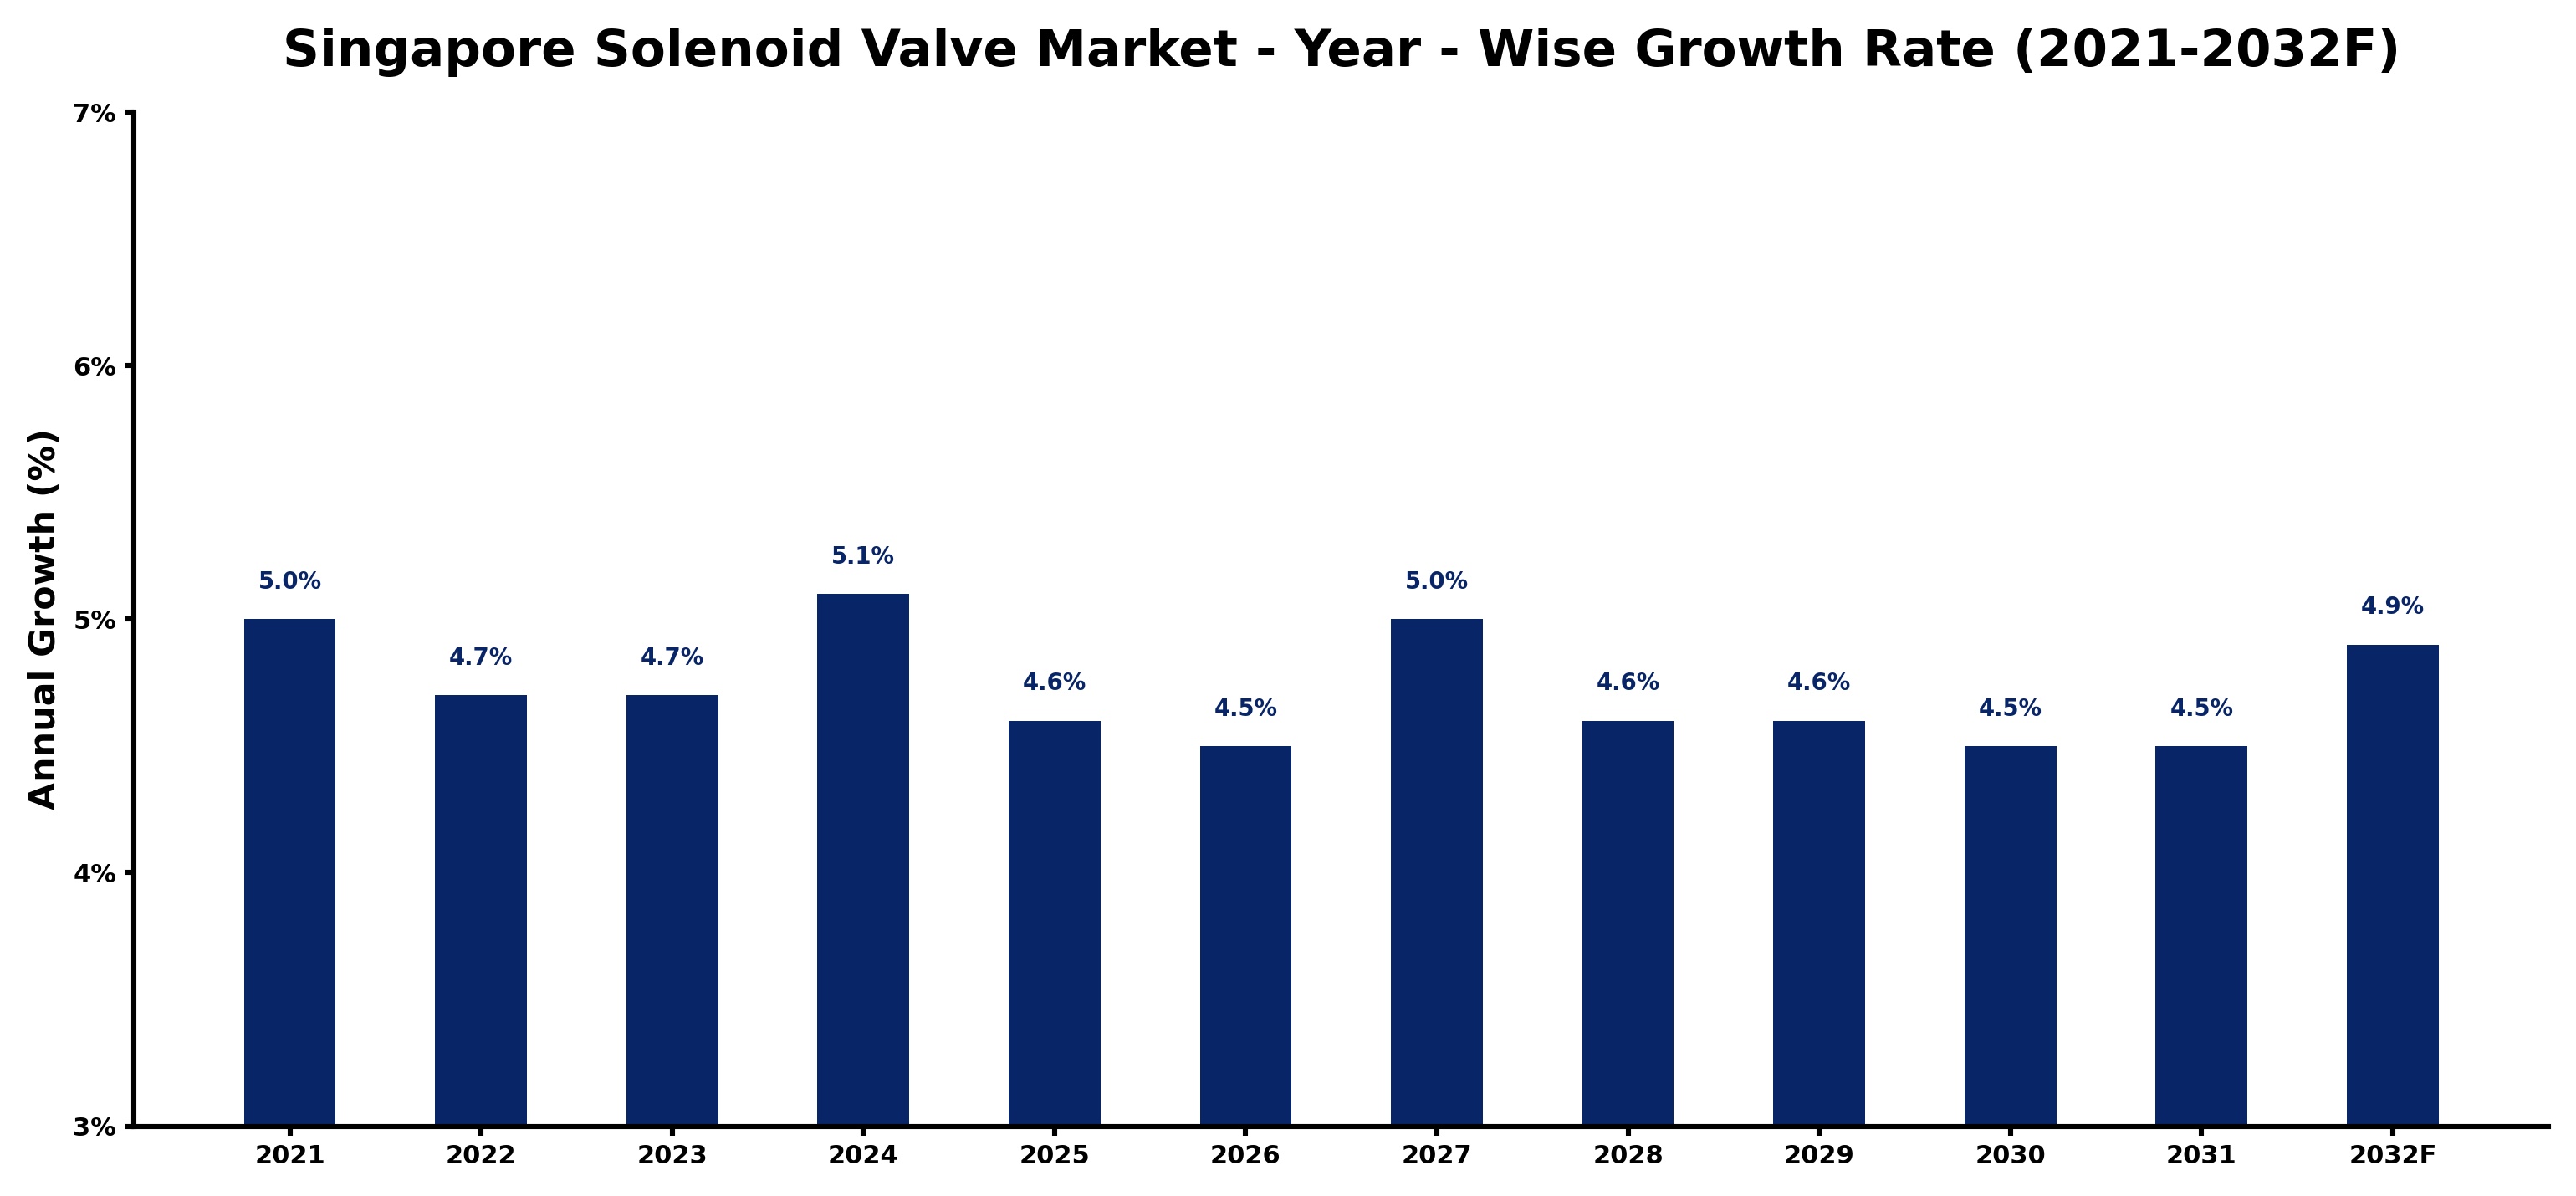
The table below presents the year‑wise growth rates along with the key drivers influencing the market
| Year | Growth Rate | Major Drivers |
| 2021 | 5.0% | Growing urbanization and commercial development |
| 2022 | 4.7% | Growing urbanization and commercial development |
| 2023 | 4.7% | Government infrastructure modernization initiatives |
| 2024 | 5.1% | Increasing industrial automation investments |
| 2025 | 4.6% | Growing renewable energy integration projects |
| 2026 | 4.5% | Expansion of manufacturing activities |
| 2027 | 5.0% | Increasing smart city development projects |
| 2028 | 4.6% | Expansion of manufacturing activities |
| 2029 | 4.6% | Increasing industrial infrastructure investments |
| 2030 | 4.5% | Expansion of commercial construction activities |
| 2031 | 4.5% | Government infrastructure modernization initiatives |
| 2032 | 4.9% | Increasing industrial infrastructure investments |
Note - Market size estimations and growth projections presented in this report are based on 6Wresearch’s advanced forecasting approach, validated with industry datasets as of June 2026.
Singapore Solenoid Valve Market Synopsis
Industrial automation stands out as the most potent force reshaping the Singapore solenoid valve market. As companies seek to enhance operational efficiency and reduce human intervention, solenoid valves are becoming critical components in various applications, spanning manufacturing to healthcare.
Furthermore, the oil and gas sector's escalating requirement for advanced control and safety mechanisms, coupled with the increasing emphasis on sustainable water management solutions, fosters a favorable environment for solenoid valve manufacturers in Singapore.
Singapore Solenoid Valve Market Key Takeaways
- The market is fueled by the surge in industrial automation and fluid control systems.
- Efforts to enhance water treatment capabilities are central to market demand.
- Technological advancements are shifting focus towards energy-efficient solenoid valves.
- COVID-19 highlighted the critical nature of solenoid valves in healthcare applications.
- Local distributors play a pivotal role in the accessibility of these valves across industries.
Evaluation of Restraints in Singapore Solenoid Valve Market
Despite its positive growth trajectory, the Singapore solenoid valve market faces significant restraints. The rapid pace of technological advancements poses a challenge for manufacturers to keep pace with evolving standards and complex requirements. Furthermore, cost pressures and the quest for energy-efficient solutions can restrict investment into new products and innovations. Companies must balance these constraints while meeting the increasingly sophisticated demands of the various industries they serve.
Singapore Solenoid Valve Market Trends
Current trends reveal a shift toward smart solenoid valves integrated with IoT capabilities, facilitating real-time monitoring and enhanced operational efficiency. There is also a growing focus on developing environmentally friendly and energy-efficient valve solutions, responding to the sustainability agenda within industries. The impact of digital transformation is increasingly evident, as businesses aim to harness data analytics for process optimization in fluid control.
Singapore Solenoid Valve Market Opportunities
The market is ripe with opportunities, particularly in the realms of smart technology and automation. Companies that innovate and provide energy-efficient solenoid valves are likely to see increased demand. Additionally, partnerships with local distributors can enhance market penetration and offer tailored solutions for specific industries, such as healthcare and wastewater management.
Government Initiatives in the Singapore Solenoid Valve Market
The Singapore government actively promotes initiatives aimed at enhancing industrial automation and sustainability, which indirectly supports the solenoid valve market. Programs focused on water resource management and green technology initiatives encourage investment in efficient fluid control systems. The emphasis on smart city developments further underpins the necessity for advanced solenoid valves within infrastructure projects.
Future Insights of the Singapore Solenoid Valve Market
Looking ahead to 2026-2032, the Singapore solenoid valve market is set to evolve with an increasing emphasis on automation and smart technologies. As industries pivot towards digitization, the demand for advanced solenoid valve solutions that integrate with automated systems will grow. The focus on sustainability will further drive innovation, with manufacturers adapting to meet energy-efficient standards while ensuring reliability and safety in their products.
Singapore Solenoid Valve Market Latest Developments (May 2025 - June 2026)
Recent industry developments indicate a stronger inclination toward the integration of IoT within solenoid valve technologies, enabling enhanced control and diagnostics. The market is seeing collaborations between manufacturers and technology firms to design more advanced, energy-efficient valves. Additionally, an increasing number of local companies are emerging to capitalize on the evolving demand, showcasing innovative solutions tailored for specific industry needs.
Singapore Solenoid Valve Market - Key Attractiveness of the Report
- 10 Years of Market Numbers
- Historical Data Starting from 2022 to 2025
- Base Year: 2025
- Forecast Data until 2032
- Key Performance Indicators Impacting the Market
- Major Upcoming Developments and Projects
Key Highlights of the Report:
- Singapore Solenoid Valve Market Outlook
- Market Size of Singapore Solenoid Valve Market, 2025
- Forecast of Singapore Solenoid Valve Market, 2032F
- Historical Data and Forecast of Singapore Solenoid Valve Revenues & Volume for the Period 2022-2032F
- Singapore Solenoid Valve Market Trend Evolution
- Singapore Solenoid Valve Market Drivers and Challenges
- Singapore Solenoid Valve Price Trends
- Singapore Solenoid Valve Porter's Five Forces
- Singapore Solenoid Valve Industry Life Cycle
- Historical Data and Forecast of Singapore Solenoid Valve Market Revenues & Volume By Body Material for the Period 2022-2032F
- Historical Data and Forecast of Singapore Solenoid Valve Market Revenues & Volume By Stainless Steel for the Period 2022-2032F
- Historical Data and Forecast of Singapore Solenoid Valve Market Revenues & Volume By Brass for the Period 2022-2032F
- Historical Data and Forecast of Singapore Solenoid Valve Market Revenues & Volume By Aluminium for the Period 2022-2032F
- Historical Data and Forecast of Singapore Solenoid Valve Market Revenues & Volume By Plastic for the Period 2022-2032F
- Historical Data and Forecast of Singapore Solenoid Valve Market Revenues & Volume By Valve Design Type for the Period 2022-2032F
- Historical Data and Forecast of Singapore Solenoid Valve Market Revenues & Volume By 2-way for the Period 2022-2032F
- Historical Data and Forecast of Singapore Solenoid Valve Market Revenues & Volume By 3-way for the Period 2022-2032F
- Historical Data and Forecast of Singapore Solenoid Valve Market Revenues & Volume By 4-way for the Period 2022-2032F
- Historical Data and Forecast of Singapore Solenoid Valve Market Revenues & Volume By 5-way for the Period 2022-2032F
- Historical Data and Forecast of Singapore Solenoid Valve Market Revenues & Volume By Industry for the Period 2022-2032F
- Historical Data and Forecast of Singapore Solenoid Valve Market Revenues & Volume By Oil & Gas for the Period 2022-2032F
- Historical Data and Forecast of Singapore Solenoid Valve Market Revenues & Volume By Chemical & Petrochemical for the Period 2022-2032F
- Historical Data and Forecast of Singapore Solenoid Valve Market Revenues & Volume By Water & Wastewater for the Period 2022-2032F
- Historical Data and Forecast of Singapore Solenoid Valve Market Revenues & Volume By Food & Beverages for the Period 2022-2032F
- Historical Data and Forecast of Singapore Solenoid Valve Market Revenues & Volume By Power Generation for the Period 2022-2032F
- Historical Data and Forecast of Singapore Solenoid Valve Market Revenues & Volume By Pharmaceuticals for the Period 2022-2032F
- Historical Data and Forecast of Singapore Solenoid Valve Market Revenues & Volume By Automotive for the Period 2022-2032F
- Historical Data and Forecast of Singapore Solenoid Valve Market Revenues & Volume By Others for the Period 2022-2032F
- Singapore Solenoid Valve Import Export Trade Statistics
- Market Opportunity Assessment By Body Material
- Market Opportunity Assessment By Valve Design Type
- Market Opportunity Assessment By Industry
- Singapore Solenoid Valve Top Companies Market Share
- Singapore Solenoid Valve Competitive Benchmarking By Technical and Operational Parameters
- Singapore Solenoid Valve Company Profiles
- Singapore Solenoid Valve Key Strategic Recommendations
Singapore Solenoid Valve Market - Frequently Asked Questions
The market is estimated to be USD 229 Million in 2025 and is projected to grow to USD 302 Million by 2032, with a CAGR of 4.0% from 2026 to 2032.
Industries such as manufacturing, oil and gas, water treatment, automotive, and healthcare are the primary consumers of solenoid valves, each relying on them for various fluid control applications.
The rise in industrial automation necessitates reliable and efficient solenoid valves, as these devices are integral to controlling fluid flow and enhancing process efficiency in automated systems.
The pandemic led to supply chain disruptions, but it also increased demand for solenoid valves in healthcare equipment, highlighting their essential role in critical applications.
Expect to see an increasing integration of IoT technologies into solenoid valves, along with a heightened focus on energy efficiency and sustainability in line with global trends.
6Wresearch actively monitors the Singapore Solenoid Valve Market and publishes its comprehensive annual report, highlighting emerging trends, growth drivers, revenue analysis, and forecast outlook. Our insights help businesses to make data-backed strategic decisions with ongoing market dynamics. Our analysts track relevent industries related to the Singapore Solenoid Valve Market, allowing our clients with actionable intelligence and reliable forecasts tailored to emerging regional needs.
Yes, we provide customisation as per your requirements. To learn more, feel free to contact us on sales@6wresearch.com
Singapore Solenoid Valve |
1 Executive Summary |
2 Introduction |
2.1 Key Highlights of the Report |
2.2 Report Description |
2.3 Market Scope & Segmentation |
2.4 Research Methodology |
2.5 Assumptions |
3 Singapore Solenoid Valve Market Overview |
3.1 Singapore Country Macro Economic Indicators |
3.2 Singapore Solenoid Valve Market Revenues & Volume, 2022 & 2032F |
3.3 Singapore Solenoid Valve Market - Industry Life Cycle |
3.4 Singapore Solenoid Valve Market - Porter's Five Forces |
3.5 Singapore Solenoid Valve Market Revenues & Volume Share, By Body Material, 2022 & 2032F |
3.6 Singapore Solenoid Valve Market Revenues & Volume Share, By Valve Design Type, 2022 & 2032F |
3.7 Singapore Solenoid Valve Market Revenues & Volume Share, By Industry, 2022 & 2032F |
4 Singapore Solenoid Valve Market Dynamics |
4.1 Impact Analysis |
4.2 Market Drivers |
4.3 Market Restraints |
5 Singapore Solenoid Valve Market Trends |
6 Singapore Solenoid Valve Market, By Types |
6.1 Singapore Solenoid Valve Market, By Body Material |
6.1.1 Overview and Analysis |
6.1.2 Singapore Solenoid Valve Market Revenues & Volume, By Body Material, 2022-2032F |
6.1.3 Singapore Solenoid Valve Market Revenues & Volume, By Stainless Steel, 2022-2032F |
6.1.4 Singapore Solenoid Valve Market Revenues & Volume, By Brass, 2022-2032F |
6.1.5 Singapore Solenoid Valve Market Revenues & Volume, By Aluminium, 2022-2032F |
6.1.6 Singapore Solenoid Valve Market Revenues & Volume, By Plastic, 2022-2032F |
6.2 Singapore Solenoid Valve Market, By Valve Design Type |
6.2.1 Overview and Analysis |
6.2.2 Singapore Solenoid Valve Market Revenues & Volume, By 2-way, 2022-2032F |
6.2.3 Singapore Solenoid Valve Market Revenues & Volume, By 3-way, 2022-2032F |
6.2.4 Singapore Solenoid Valve Market Revenues & Volume, By 4-way, 2022-2032F |
6.2.5 Singapore Solenoid Valve Market Revenues & Volume, By 5-way, 2022-2032F |
6.3 Singapore Solenoid Valve Market, By Industry |
6.3.1 Overview and Analysis |
6.3.2 Singapore Solenoid Valve Market Revenues & Volume, By Oil & Gas, 2022-2032F |
6.3.3 Singapore Solenoid Valve Market Revenues & Volume, By Chemical & Petrochemical, 2022-2032F |
6.3.4 Singapore Solenoid Valve Market Revenues & Volume, By Water & Wastewater, 2022-2032F |
6.3.5 Singapore Solenoid Valve Market Revenues & Volume, By Food & Beverages, 2022-2032F |
6.3.6 Singapore Solenoid Valve Market Revenues & Volume, By Power Generation, 2022-2032F |
6.3.7 Singapore Solenoid Valve Market Revenues & Volume, By Pharmaceuticals, 2022-2032F |
6.3.8 Singapore Solenoid Valve Market Revenues & Volume, By Others, 2022-2032F |
6.3.9 Singapore Solenoid Valve Market Revenues & Volume, By Others, 2022-2032F |
7 Singapore Solenoid Valve Market Import-Export Trade Statistics |
7.1 Singapore Solenoid Valve Market Export to Major Countries |
7.2 Singapore Solenoid Valve Market Imports from Major Countries |
8 Singapore Solenoid Valve Market Key Performance Indicators |
9 Singapore Solenoid Valve Market - Opportunity Assessment |
9.1 Singapore Solenoid Valve Market Opportunity Assessment, By Body Material, 2022 & 2032F |
9.2 Singapore Solenoid Valve Market Opportunity Assessment, By Valve Design Type, 2022 & 2032F |
9.3 Singapore Solenoid Valve Market Opportunity Assessment, By Industry, 2022 & 2032F |
10 Singapore Solenoid Valve Market - Competitive Landscape |
10.1 Singapore Solenoid Valve Market Revenue Share, By Companies, 2025 |
10.2 Singapore Solenoid Valve Market Competitive Benchmarking, By Operating and Technical Parameters |
11 Company Profiles |
12 Recommendations |
13 Disclaimer |
Global Go To Market Strategy - 2030
Export potential enables firms to identify high-growth global markets with greater confidence by combining advanced trade intelligence with a structured quantitative methodology. The framework analyzes emerging demand trends and country-level import patterns while integrating macroeconomic and trade datasets such as GDP and population forecasts, bilateral import–export flows, tariff structures, elasticity differentials between developed and developing economies, geographic distance, and import demand projections. Using weighted trade values from 2020–2024 as the base period to project country-to-country export potential for 2030, these inputs are operationalized through calculated drivers such as gravity model parameters, tariff impact factors, and projected GDP per-capita growth. Through an analysis of hidden potentials, demand hotspots, and market conditions that are most favorable to success, this method enables firms to focus on target countries, maximize returns, and global expansion with data, backed by accuracy.
By factoring in the projected importer demand gap that is currently unmet and could be potential opportunity, it identifies the potential for the Exporter (Country) among 190 countries, against the general trade analysis, which identifies the biggest importer or exporter.
To discover high-growth global markets and optimize your business strategy:
Click Here
Pricing
- Single User License$ 1,995
- Department License$ 2,400
- Site License$ 3,120
- Global License$ 3,795

Leadership Perspectives from Industry Events
Search
Thought Leadership and Analyst Meet


Our Clients
6WResearch In News
- India Air Conditioner Market Set for Strong Rebound in 2026 After Weather-Led Correction and GST-Driven Recovery: 6Wresearch
- ADAS in India: How Automatic Emergency Braking, Blind Spot Detection & Driver Monitoring are Transforming Road Safety
- Doha a strategic location for EV manufacturing hub: IPA Qatar
- Demand for luxury TVs surging in the GCC, says Samsung
- Empowering Growth: The Thriving Journey of Bangladesh’s Cable Industry
- Demand for luxury TVs surging in the GCC, says Samsung
Latest Reports
- Nicaragua RPG Gaming Market (2026-2032)
- New Zealand RPG Gaming Market (2026-2032)
- Netherlands RPG Gaming Market (2026-2032)
- Nauru RPG Gaming Market (2026-2032)
- Namibia RPG Gaming Market (2026-2032)
- Mozambique RPG Gaming Market (2026-2032)
- Montenegro RPG Gaming Market (2026-2032)
- Mongolia RPG Gaming Market (2026-2032)
- Monaco RPG Gaming Market (2026-2032)
- Micronesia RPG Gaming Market (2026-2032)
Industry Events and Analyst Meet

EV India Expo 2026

HIMTEX 2026

India Refining Summit 2026

India EV Show 2026

EV tech India Expo 2026
Whitepaper
- Middle East & Africa Commercial Security Market Click here to view more.
- Middle East & Africa Fire Safety Systems & Equipment Market Click here to view more.
- GCC Drone Market Click here to view more.
- Middle East Lighting Fixture Market Click here to view more.
- GCC Physical & Perimeter Security Market Click here to view more.