Singapore Sports Protective Equipment Market (2020-2026) | Trends, Companies, Revenue, Size, COVID-19 IMPACT, Industry, Share, Value, Forecast, Analysis, Growth & Outlook
Market Forecast By Product Type (Helmets & Other Headgear, Pads, Guards, Chest Protectors, & Gloves, Protective Eyewear, Face Protection & Mouth Guards), By Area of Protection (Head & Face Protective Equipment, Trunk & Thorax Protective Equipment, Upper Extremity Protective Equipment, Lower Extremity Protective Equipment), By Distribution Channel (Specialty Retail Stores, Multi-Retail Stores, Online Stores & Others) And Competitive Landscape
| Product Code: ETC014447 | Publication Date: Jun 2023 | Updated Date: Feb 2026 | Product Type: Report | |
| Publisher: 6Wresearch | Author: Ravi Bhandari | No. of Pages: 70 | No. of Figures: 35 | No. of Tables: 5 |
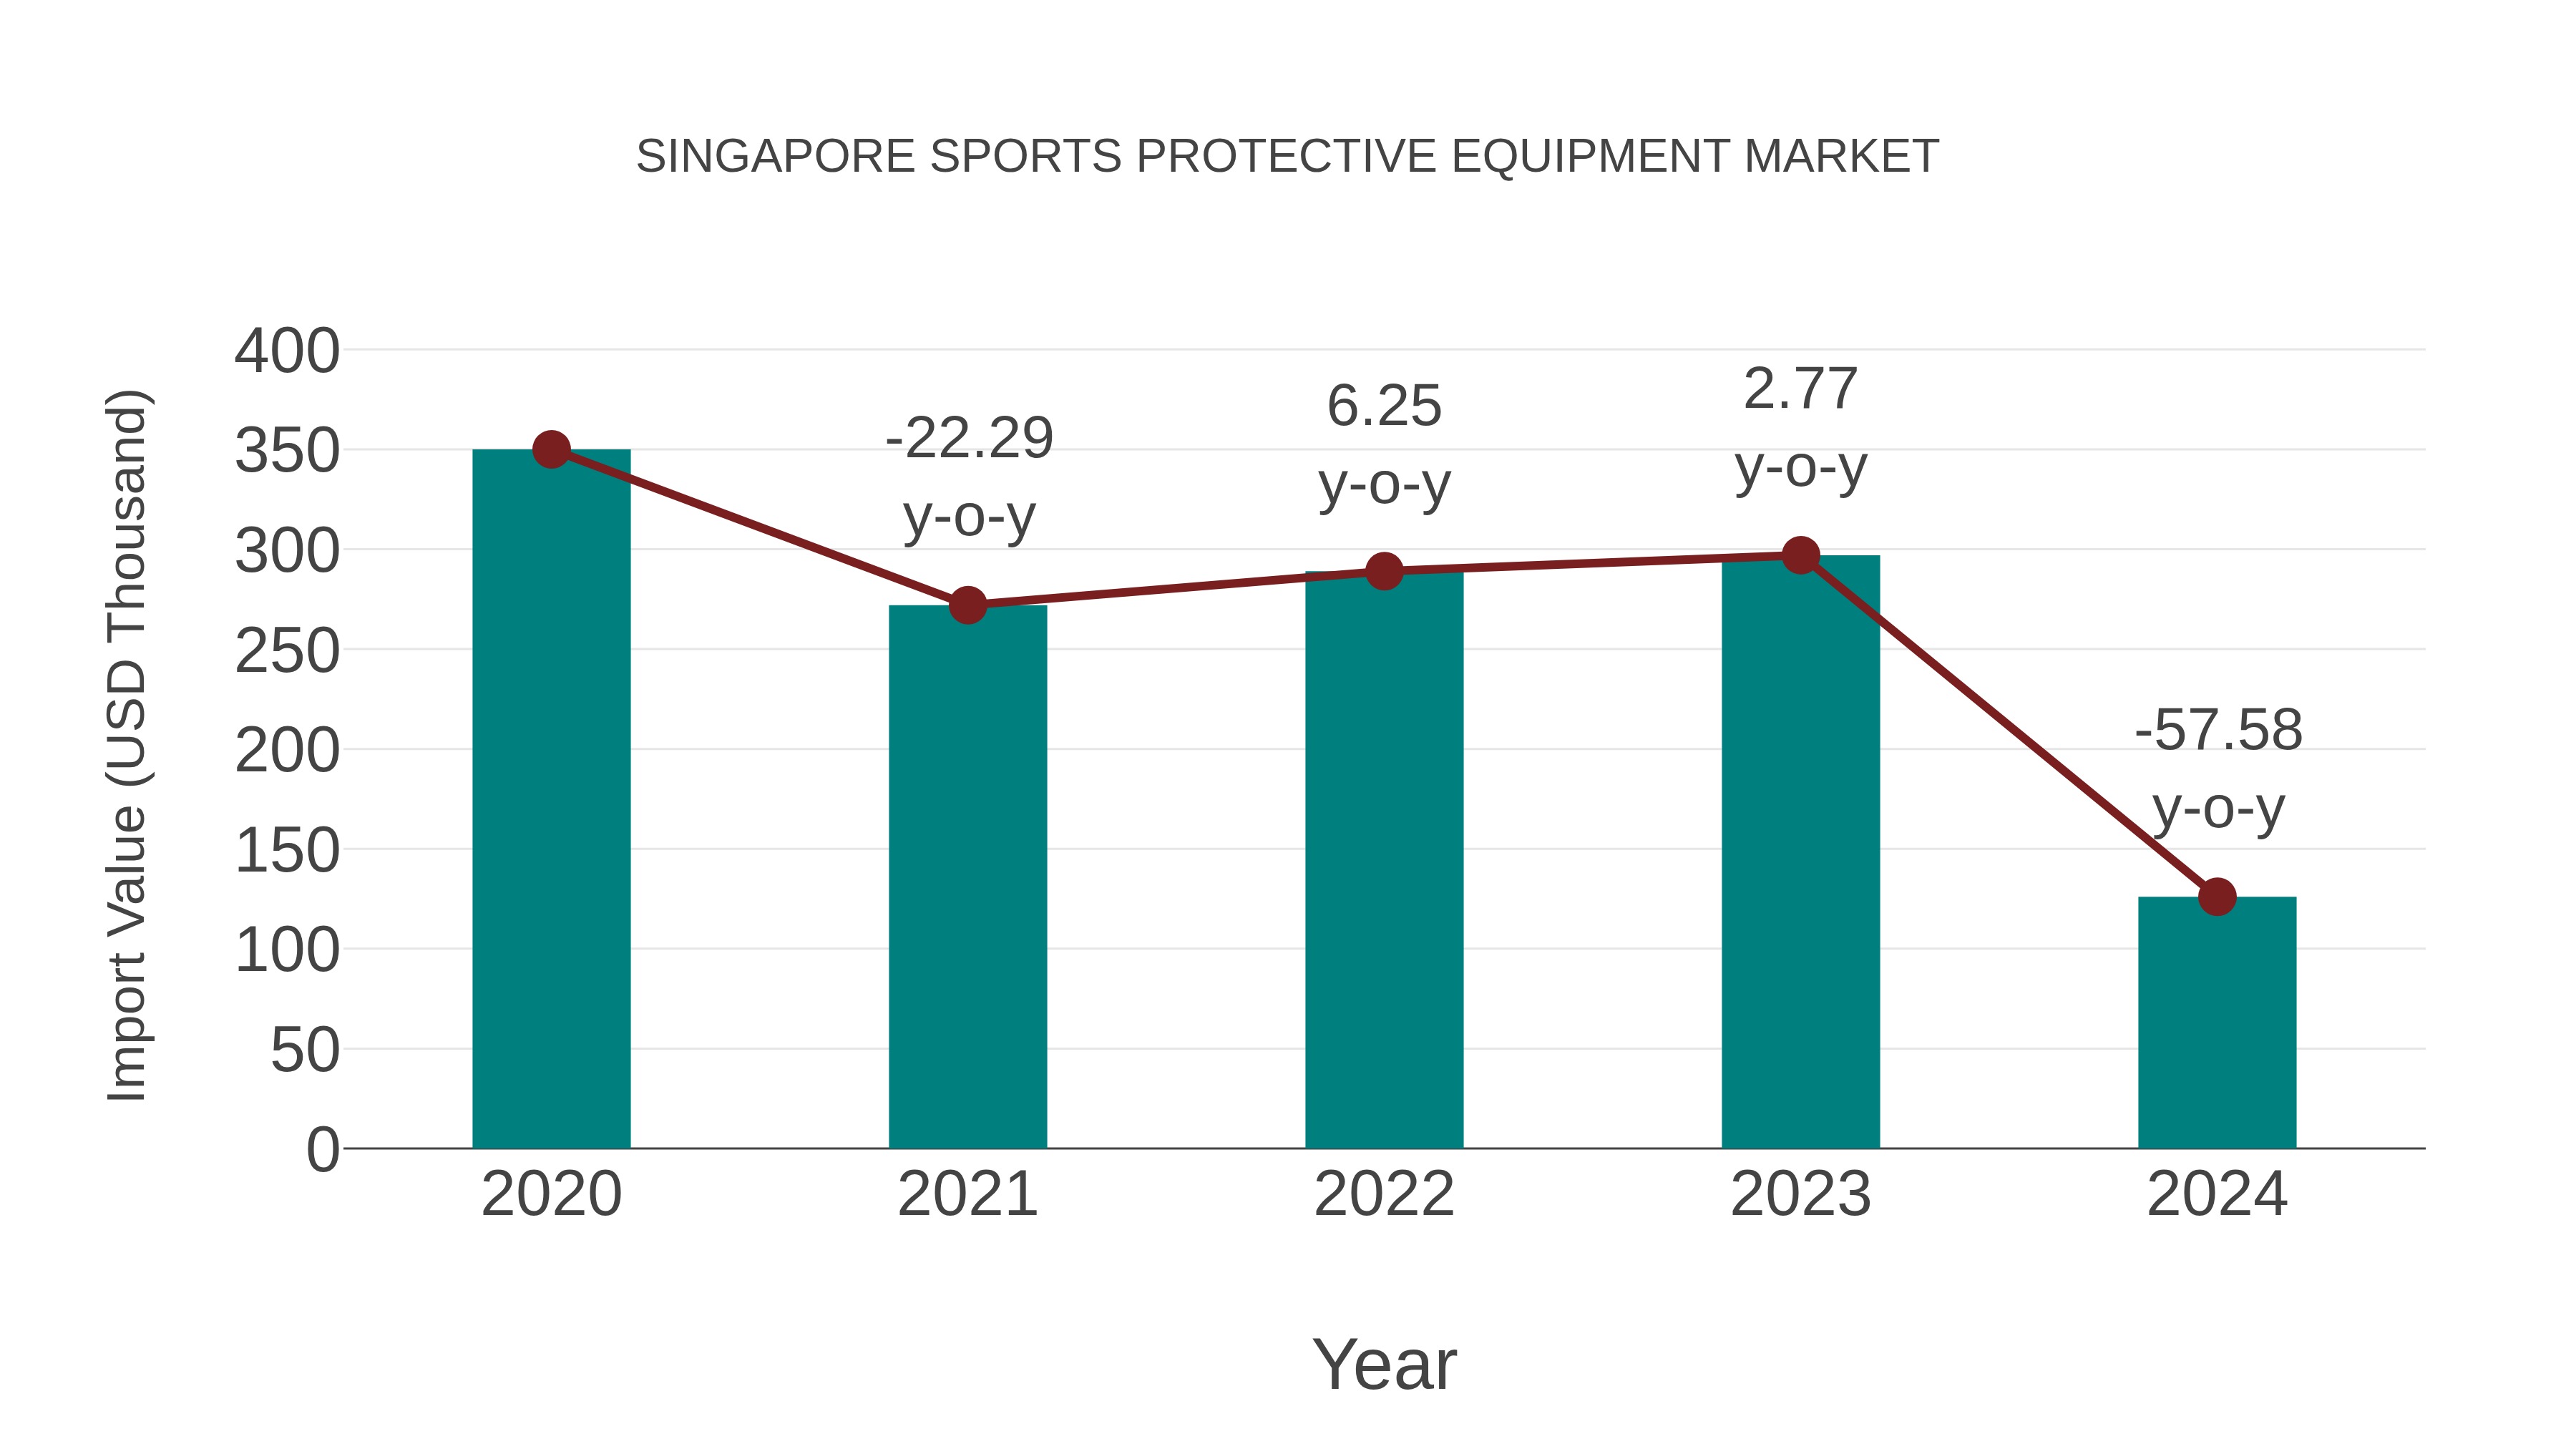
Singapore Sports Protective Equipment Market: Import Trend Analysis
In 2024, Singapore`s sports protective equipment market saw a steady increase in imports. The trend indicated a growing demand for high-quality sports gear among consumers in the country.
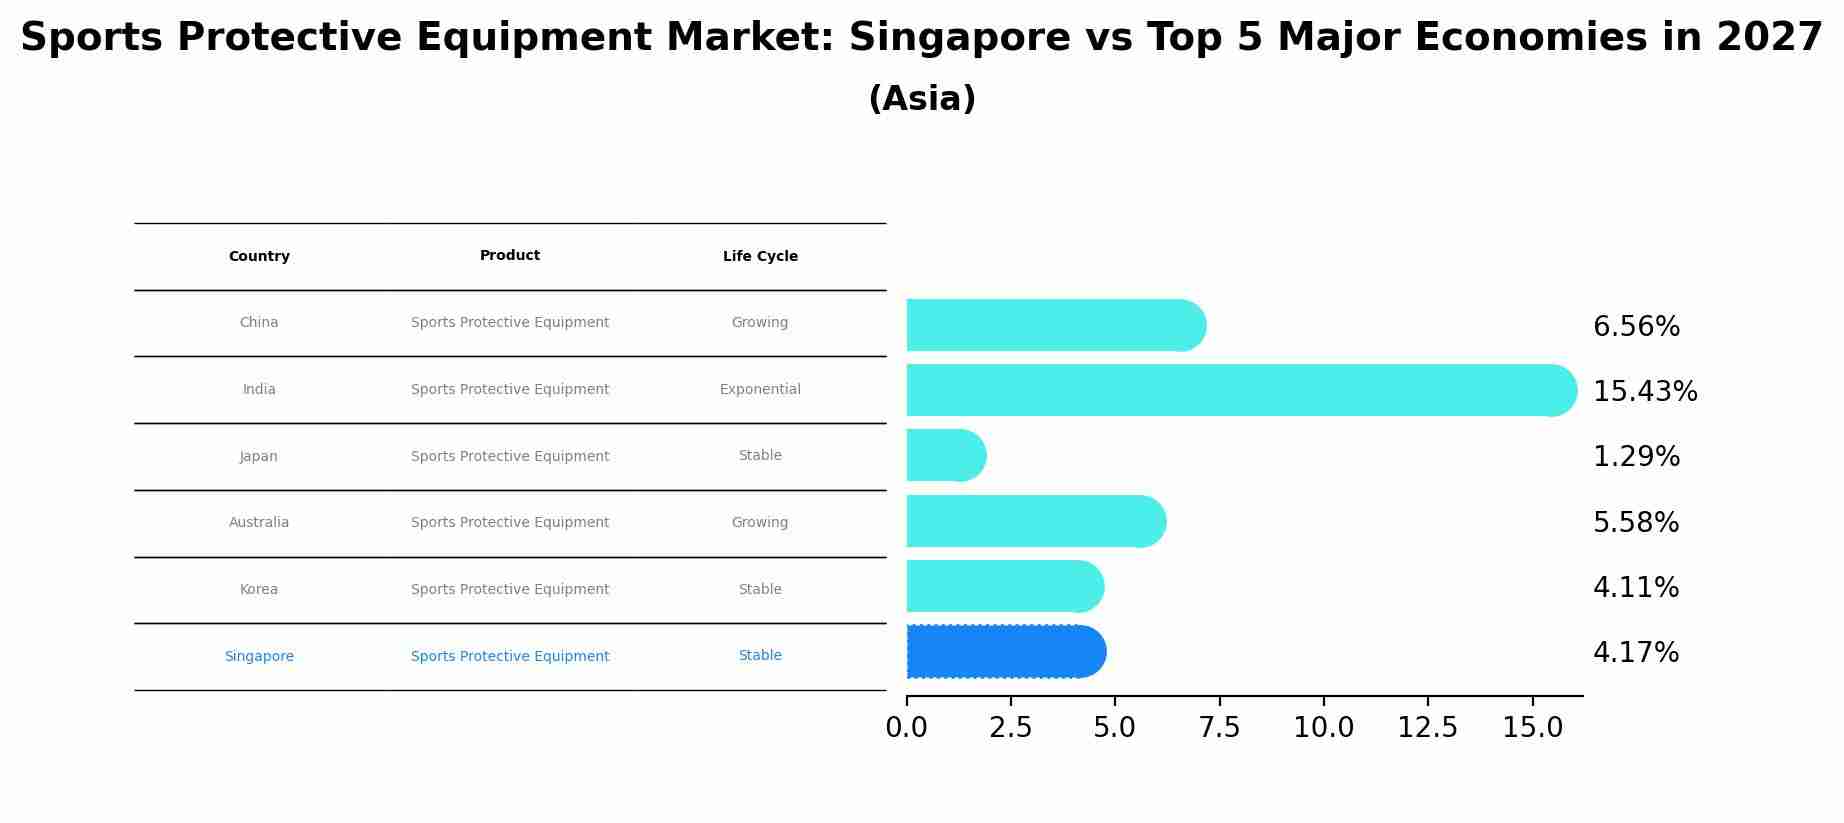
Sports Protective Equipment Market: Singapore vs Top 5 Major Economies in 2027 (Asia)
The Sports Protective Equipment market in Singapore is projected to grow at a stable growth rate of 4.17% by 2027, within the Asia region led by China, along with other countries like India, Japan, Australia and South Korea, collectively shaping a dynamic and evolving market environment driven by innovation and increasing adoption of emerging technologies.
The Singapore Sports Protective Equipment Market is expected to grow at a Compound Annual Growth Rate (CAGR) of 8.7% during the forecast period 2020-2026. This growth can be attributed to increasing awareness regarding personal safety, rise in participation levels in different sports activities and surge in spending on sporting goods & services. Factors such as rising prevalence of health issues due to unhealthy lifestyle, adoption of modern technology for manufacturing protective equipment and various government initiatives promoting sport are further projected to drive market growth. However, limited options available for specific sports activities may hamper the market growth over the forecast period 2020-2026
In terms of type, pads & guards segment holds significant share owing to its primary use across diverse kinds of sports activity including baseball/softball, football and ice hockey among others. Moreover, shift towards customized protective equipment will offer lucrative opportunities for players operating in the Singapore Sports Protective Equipment Market over the next few years. Furthermore, manufacturers are focusing on developing innovative products with enhanced protection ability which is expected to fuel market demand over the coming years
Key Highlights of the Report:
- Singapore Sports Protective Equipment Market Outlook
- Market Size of Singapore Sports Protective Equipment Market, 2019
- Forecast of Singapore Sports Protective Equipment Market, 2026
- Historical Data and Forecast of Singapore Sports Protective Equipment Revenues & Volume for the Period 2016 - 2026
- Singapore Sports Protective Equipment Market Trend Evolution
- Singapore Sports Protective Equipment Market Drivers and Challenges
- Singapore Sports Protective Equipment Price Trends
- Singapore Sports Protective Equipment Porter's Five Forces
- Singapore Sports Protective Equipment Industry Life Cycle
- Historical Data and Forecast of Singapore Sports Protective Equipment Market Revenues & Volume By Product Type for the Period 2016 - 2026
- Historical Data and Forecast of Singapore Sports Protective Equipment Market Revenues & Volume By Helmets & Other Headgear for the Period 2016 - 2026
- Historical Data and Forecast of Singapore Sports Protective Equipment Market Revenues & Volume By Pads, Guards, Chest Protectors, & Gloves for the Period 2016 - 2026
- Historical Data and Forecast of Singapore Sports Protective Equipment Market Revenues & Volume By Protective Eyewear for the Period 2016 - 2026
- Historical Data and Forecast of Singapore Sports Protective Equipment Market Revenues & Volume By Face Protection & Mouth Guards for the Period 2016 - 2026
- Historical Data and Forecast of Singapore Sports Protective Equipment Market Revenues & Volume By Area of Protection for the Period 2016 - 2026
- Historical Data and Forecast of Singapore Sports Protective Equipment Market Revenues & Volume By Head & Face Protective Equipment for the Period 2016 - 2026
- Historical Data and Forecast of Singapore Sports Protective Equipment Market Revenues & Volume By Trunk & Thorax Protective Equipment for the Period 2016 - 2026
- Historical Data and Forecast of Singapore Sports Protective Equipment Market Revenues & Volume By Upper Extremity Protective Equipment for the Period 2016 - 2026
- Historical Data and Forecast of Singapore Sports Protective Equipment Market Revenues & Volume By Lower Extremity Protective Equipment for the Period 2016 - 2026
- Historical Data and Forecast of Singapore Sports Protective Equipment Market Revenues & Volume By Distribution Channel for the Period 2016 - 2026
- Historical Data and Forecast of Singapore Sports Protective Equipment Market Revenues & Volume By Specialty Retail Stores for the Period 2016 - 2026
- Historical Data and Forecast of Singapore Sports Protective Equipment Market Revenues & Volume By Multi-Retail Stores for the Period 2016 - 2026
- Historical Data and Forecast of Singapore Sports Protective Equipment Market Revenues & Volume By Online Stores & Others for the Period 2016 - 2026
- Singapore Sports Protective Equipment Import Export Trade Statistics
- Market Opportunity Assessment By Product Type
- Market Opportunity Assessment By Area of Protection
- Market Opportunity Assessment By Distribution Channel
- Singapore Sports Protective Equipment Top Companies Market Share
- Singapore Sports Protective Equipment Competitive Benchmarking By Technical and Operational Parameters
- Singapore Sports Protective Equipment Company Profiles
- Singapore Sports Protective Equipment Key Strategic Recommendations
Frequently Asked Questions About the Market Study (FAQs):
6Wresearch actively monitors the Singapore Sports Protective Equipment Market and publishes its comprehensive annual report, highlighting emerging trends, growth drivers, revenue analysis, and forecast outlook. Our insights help businesses to make data-backed strategic decisions with ongoing market dynamics. Our analysts track relevent industries related to the Singapore Sports Protective Equipment Market, allowing our clients with actionable intelligence and reliable forecasts tailored to emerging regional needs.
Yes, we provide customisation as per your requirements. To learn more, feel free to contact us on sales@6wresearch.com
1 Executive Summary |
2 Introduction |
2.1 Key Highlights of the Report |
2.2 Report Description |
2.3 Market Scope & Segmentation |
2.4 Research Methodology |
2.5 Assumptions |
3 Singapore Sports Protective Equipment Market Overview |
3.1 Singapore Country Macro Economic Indicators |
3.2 Singapore Sports Protective Equipment Market Revenues & Volume, 2019 & 2026F |
3.3 Singapore Sports Protective Equipment Market - Industry Life Cycle |
3.4 Singapore Sports Protective Equipment Market - Porter's Five Forces |
3.5 Singapore Sports Protective Equipment Market Revenues & Volume Share, By Product Type, 2019 & 2026F |
3.6 Singapore Sports Protective Equipment Market Revenues & Volume Share, By Area of Protection, 2019 & 2026F |
3.7 Singapore Sports Protective Equipment Market Revenues & Volume Share, By Distribution Channel, 2019 & 2026F |
4 Singapore Sports Protective Equipment Market Dynamics |
4.1 Impact Analysis |
4.2 Market Drivers |
4.3 Market Restraints |
5 Singapore Sports Protective Equipment Market Trends |
6 Singapore Sports Protective Equipment Market, By Types |
6.1 Singapore Sports Protective Equipment Market, By Product Type |
6.1.1 Overview and Analysis |
6.1.2 Singapore Sports Protective Equipment Market Revenues & Volume, By Product Type, 2016 - 2026F |
6.1.3 Singapore Sports Protective Equipment Market Revenues & Volume, By Helmets & Other Headgear , 2016 - 2026F |
6.1.4 Singapore Sports Protective Equipment Market Revenues & Volume, By Pads, Guards, Chest Protectors, & Gloves, 2016 - 2026F |
6.1.5 Singapore Sports Protective Equipment Market Revenues & Volume, By Protective Eyewear, 2016 - 2026F |
6.1.6 Singapore Sports Protective Equipment Market Revenues & Volume, By Face Protection & Mouth Guards , 2016 - 2026F |
6.2 Singapore Sports Protective Equipment Market, By Area of Protection |
6.2.1 Overview and Analysis |
6.2.2 Singapore Sports Protective Equipment Market Revenues & Volume, By Head & Face Protective Equipment, 2016 - 2026F |
6.2.3 Singapore Sports Protective Equipment Market Revenues & Volume, By Trunk & Thorax Protective Equipment, 2016 - 2026F |
6.2.4 Singapore Sports Protective Equipment Market Revenues & Volume, By Upper Extremity Protective Equipment, 2016 - 2026F |
6.2.5 Singapore Sports Protective Equipment Market Revenues & Volume, By Lower Extremity Protective Equipment, 2016 - 2026F |
6.3 Singapore Sports Protective Equipment Market, By Distribution Channel |
6.3.1 Overview and Analysis |
6.3.2 Singapore Sports Protective Equipment Market Revenues & Volume, By Specialty Retail Stores, 2016 - 2026F |
6.3.3 Singapore Sports Protective Equipment Market Revenues & Volume, By Multi-Retail Stores, 2016 - 2026F |
6.3.4 Singapore Sports Protective Equipment Market Revenues & Volume, By Online Stores & Others, 2016 - 2026F |
7 Singapore Sports Protective Equipment Market Import-Export Trade Statistics |
7.1 Singapore Sports Protective Equipment Market Export to Major Countries |
7.2 Singapore Sports Protective Equipment Market Imports from Major Countries |
8 Singapore Sports Protective Equipment Market Key Performance Indicators |
9 Singapore Sports Protective Equipment Market - Opportunity Assessment |
9.1 Singapore Sports Protective Equipment Market Opportunity Assessment, By Product Type, 2019 & 2026F |
9.2 Singapore Sports Protective Equipment Market Opportunity Assessment, By Area of Protection, 2019 & 2026F |
9.3 Singapore Sports Protective Equipment Market Opportunity Assessment, By Distribution Channel, 2019 & 2026F |
10 Singapore Sports Protective Equipment Market - Competitive Landscape |
10.1 Singapore Sports Protective Equipment Market Revenue Share, By Companies, 2019 |
10.2 Singapore Sports Protective Equipment Market Competitive Benchmarking, By Operating and Technical Parameters |
11 Company Profiles |
12 Recommendations |
13 Disclaimer |
Global Go To Market Strategy - 2030
Export potential enables firms to identify high-growth global markets with greater confidence by combining advanced trade intelligence with a structured quantitative methodology. The framework analyzes emerging demand trends and country-level import patterns while integrating macroeconomic and trade datasets such as GDP and population forecasts, bilateral import–export flows, tariff structures, elasticity differentials between developed and developing economies, geographic distance, and import demand projections. Using weighted trade values from 2020–2024 as the base period to project country-to-country export potential for 2030, these inputs are operationalized through calculated drivers such as gravity model parameters, tariff impact factors, and projected GDP per-capita growth. Through an analysis of hidden potentials, demand hotspots, and market conditions that are most favorable to success, this method enables firms to focus on target countries, maximize returns, and global expansion with data, backed by accuracy.
By factoring in the projected importer demand gap that is currently unmet and could be potential opportunity, it identifies the potential for the Exporter (Country) among 190 countries, against the general trade analysis, which identifies the biggest importer or exporter.
To discover high-growth global markets and optimize your business strategy:
Click Here
Pricing
- Single User License$ 1,995
- Department License$ 2,400
- Site License$ 3,120
- Global License$ 3,795

Leadership Perspectives from Industry Events
Search
Thought Leadership and Analyst Meet


Our Clients
6WResearch In News
- India Air Conditioner Market Set for Strong Rebound in 2026 After Weather-Led Correction and GST-Driven Recovery: 6Wresearch
- ADAS in India: How Automatic Emergency Braking, Blind Spot Detection & Driver Monitoring are Transforming Road Safety
- Doha a strategic location for EV manufacturing hub: IPA Qatar
- Demand for luxury TVs surging in the GCC, says Samsung
- Empowering Growth: The Thriving Journey of Bangladesh’s Cable Industry
- Demand for luxury TVs surging in the GCC, says Samsung
Latest Reports
- Nicaragua RPG Gaming Market (2026-2032)
- New Zealand RPG Gaming Market (2026-2032)
- Netherlands RPG Gaming Market (2026-2032)
- Nauru RPG Gaming Market (2026-2032)
- Namibia RPG Gaming Market (2026-2032)
- Mozambique RPG Gaming Market (2026-2032)
- Montenegro RPG Gaming Market (2026-2032)
- Mongolia RPG Gaming Market (2026-2032)
- Monaco RPG Gaming Market (2026-2032)
- Micronesia RPG Gaming Market (2026-2032)
Industry Events and Analyst Meet

EV India Expo 2026

HIMTEX 2026

India Refining Summit 2026

India EV Show 2026

EV tech India Expo 2026
Whitepaper
- Middle East & Africa Commercial Security Market Click here to view more.
- Middle East & Africa Fire Safety Systems & Equipment Market Click here to view more.
- GCC Drone Market Click here to view more.
- Middle East Lighting Fixture Market Click here to view more.
- GCC Physical & Perimeter Security Market Click here to view more.