Slovenia Aerosol Container Market (2026-2032) | Share, Segmentation, Companies, Growth, Industry, Forecast, Analysis, Size & Revenue, Trends, Outlook, Value, Competitive Landscape
Market Forecast By Product (Metal, Glass, Plastic), By Application (Personal Care, Household, Medical, Paint) And Competitive Landscape
| Product Code: ETC9309850 | Publication Date: Sep 2024 | Updated Date: Apr 2026 | Product Type: Market Research Report | |
| Publisher: 6Wresearch | Author: Sumit Sagar | No. of Pages: 75 | No. of Figures: 35 | No. of Tables: 20 |
Slovenia Aerosol Container Market Size (2020-2030)
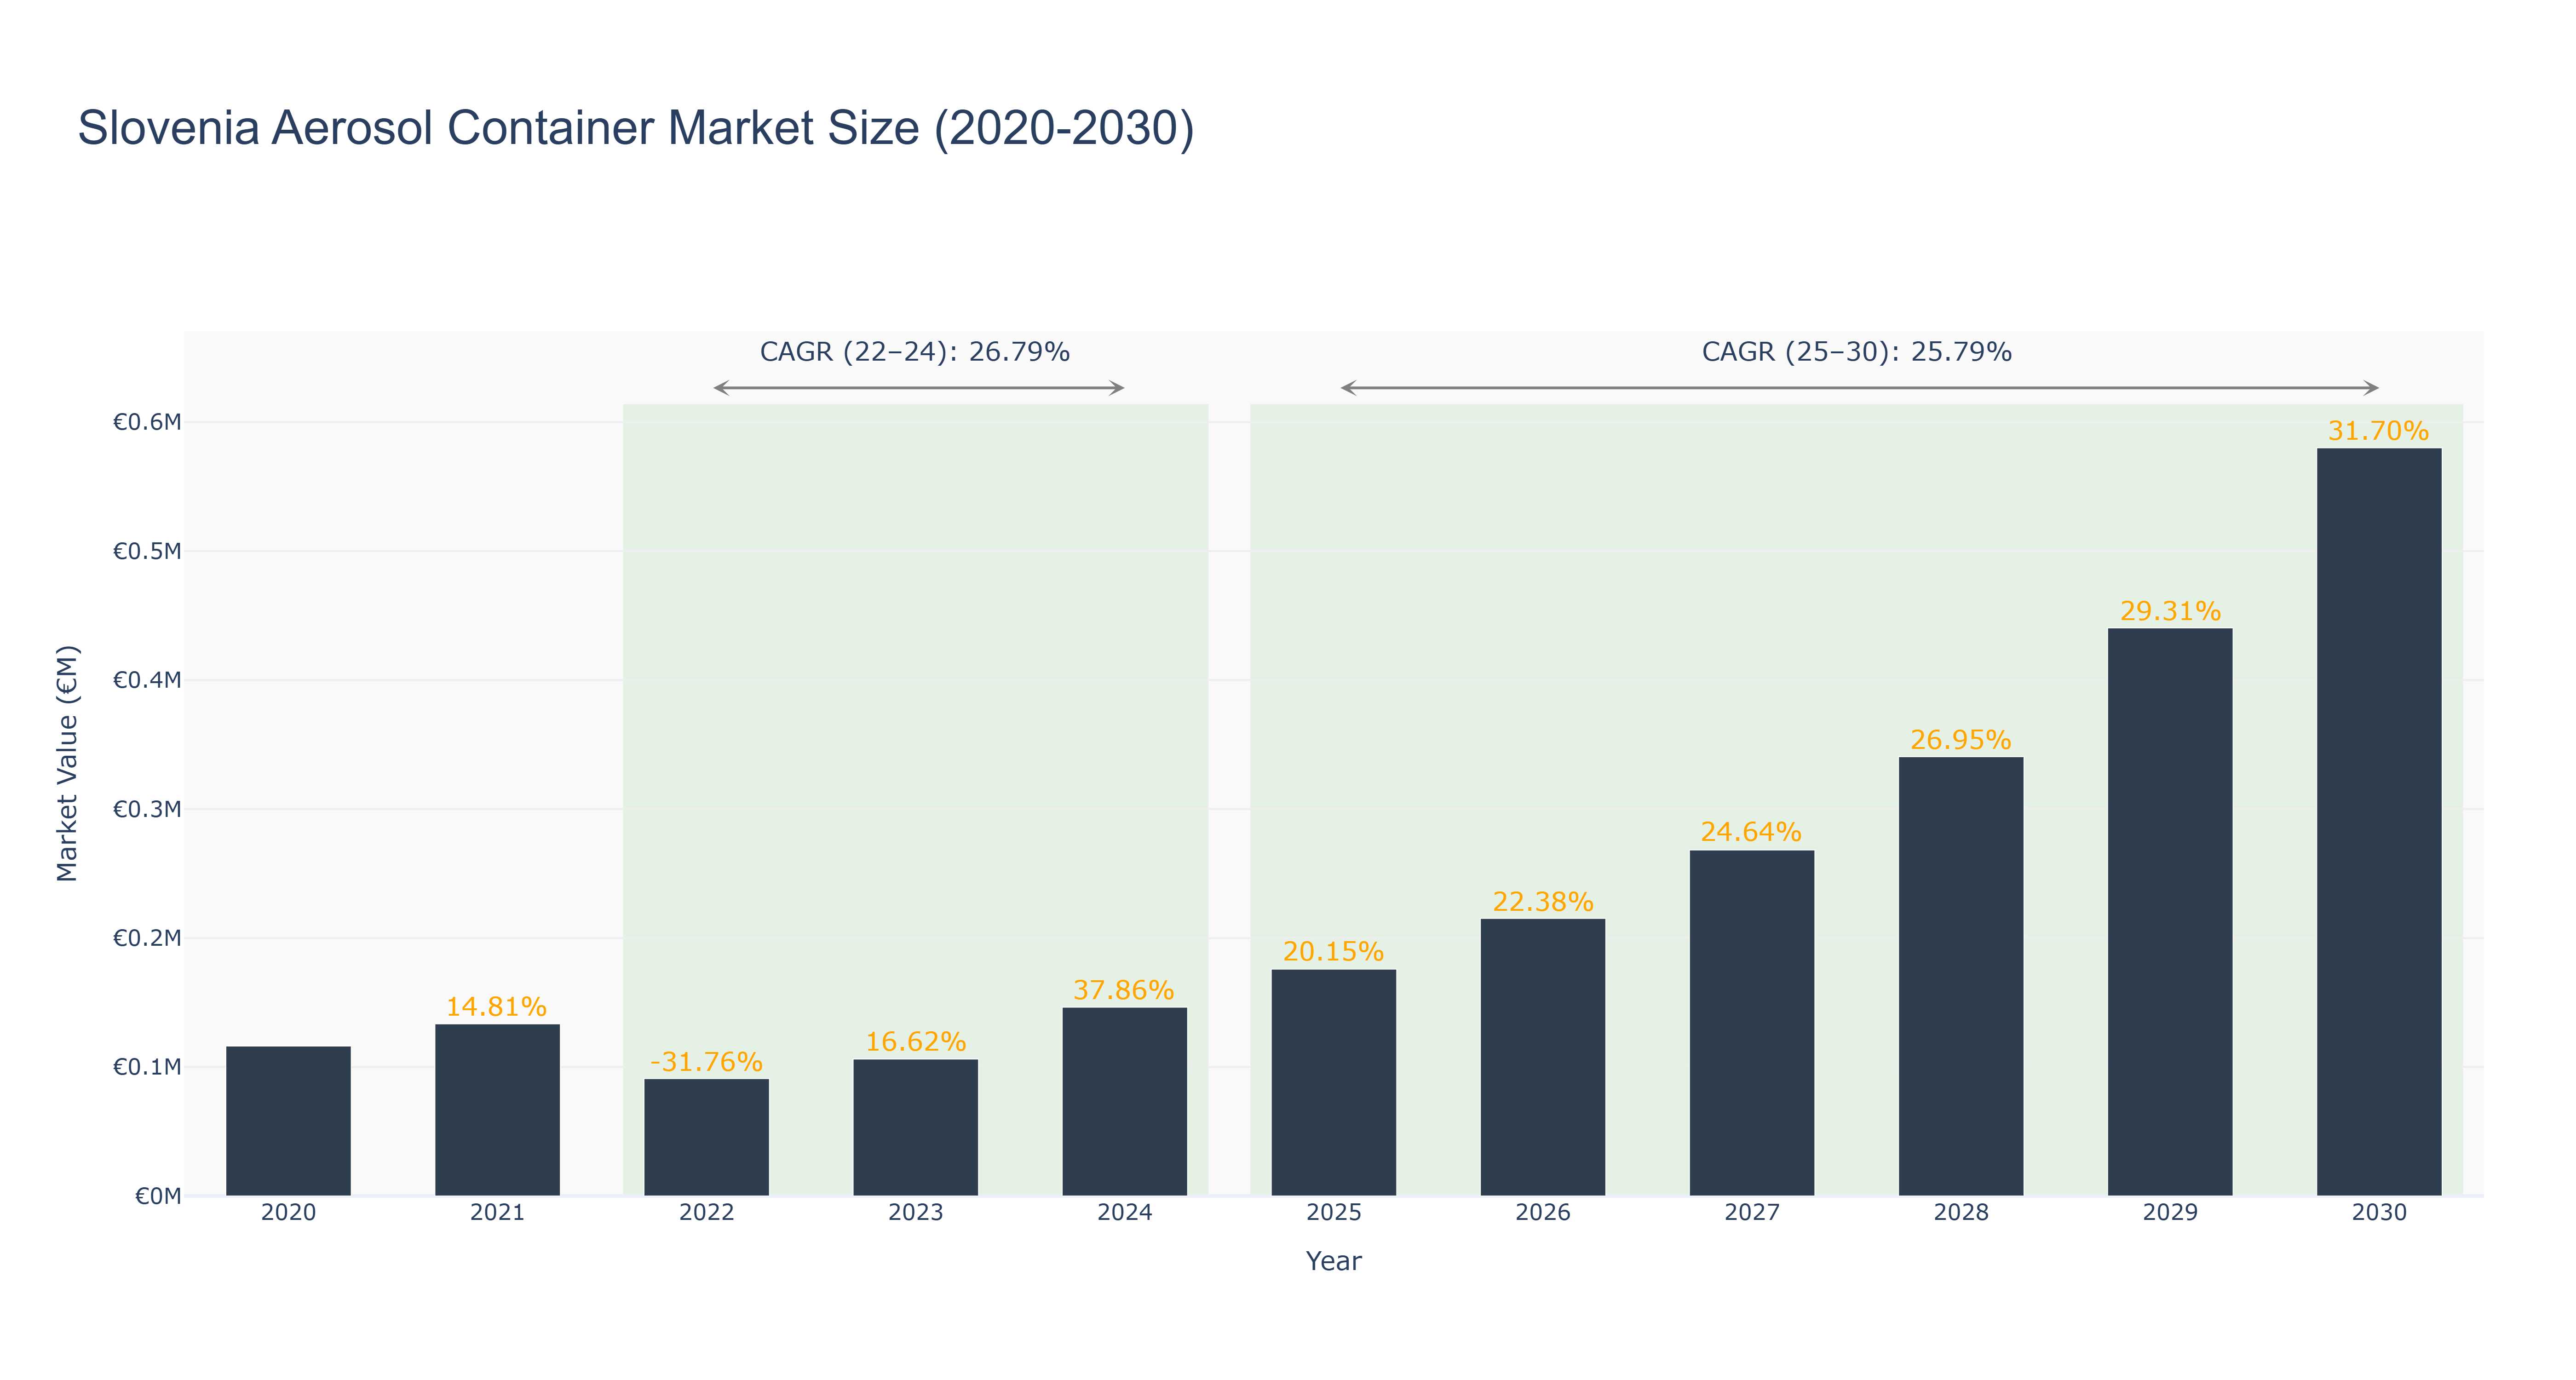
The Slovenia Aerosol Container Market experienced a fluctuating trend over the past decade. The peak market size was €0.58 million in 2030, showcasing a steady growth trajectory. From 2020 to 2024, the market size ranged from €0.12 million to €0.15 million, with a notable decline in 2022 due to a -31.76% growth rate. However, the market rebounded swiftly, with a significant spike in 2024 with a growth rate of 37.86%. Looking ahead, the forecasted market size from 2025 to 2030 is expected to continue growing steadily, with a CAGR of 25.79% post-2024. The market's growth can be attributed to increasing demand for aerosol containers in various industries, including cosmetics and pharmaceuticals. In the near future, Slovenia is set to launch a sustainable packaging initiative, aiming to enhance eco-friendly practices in the aerosol container market.
Slovenia Aerosol Container Market: Production & Trade Performance (2019-2025)
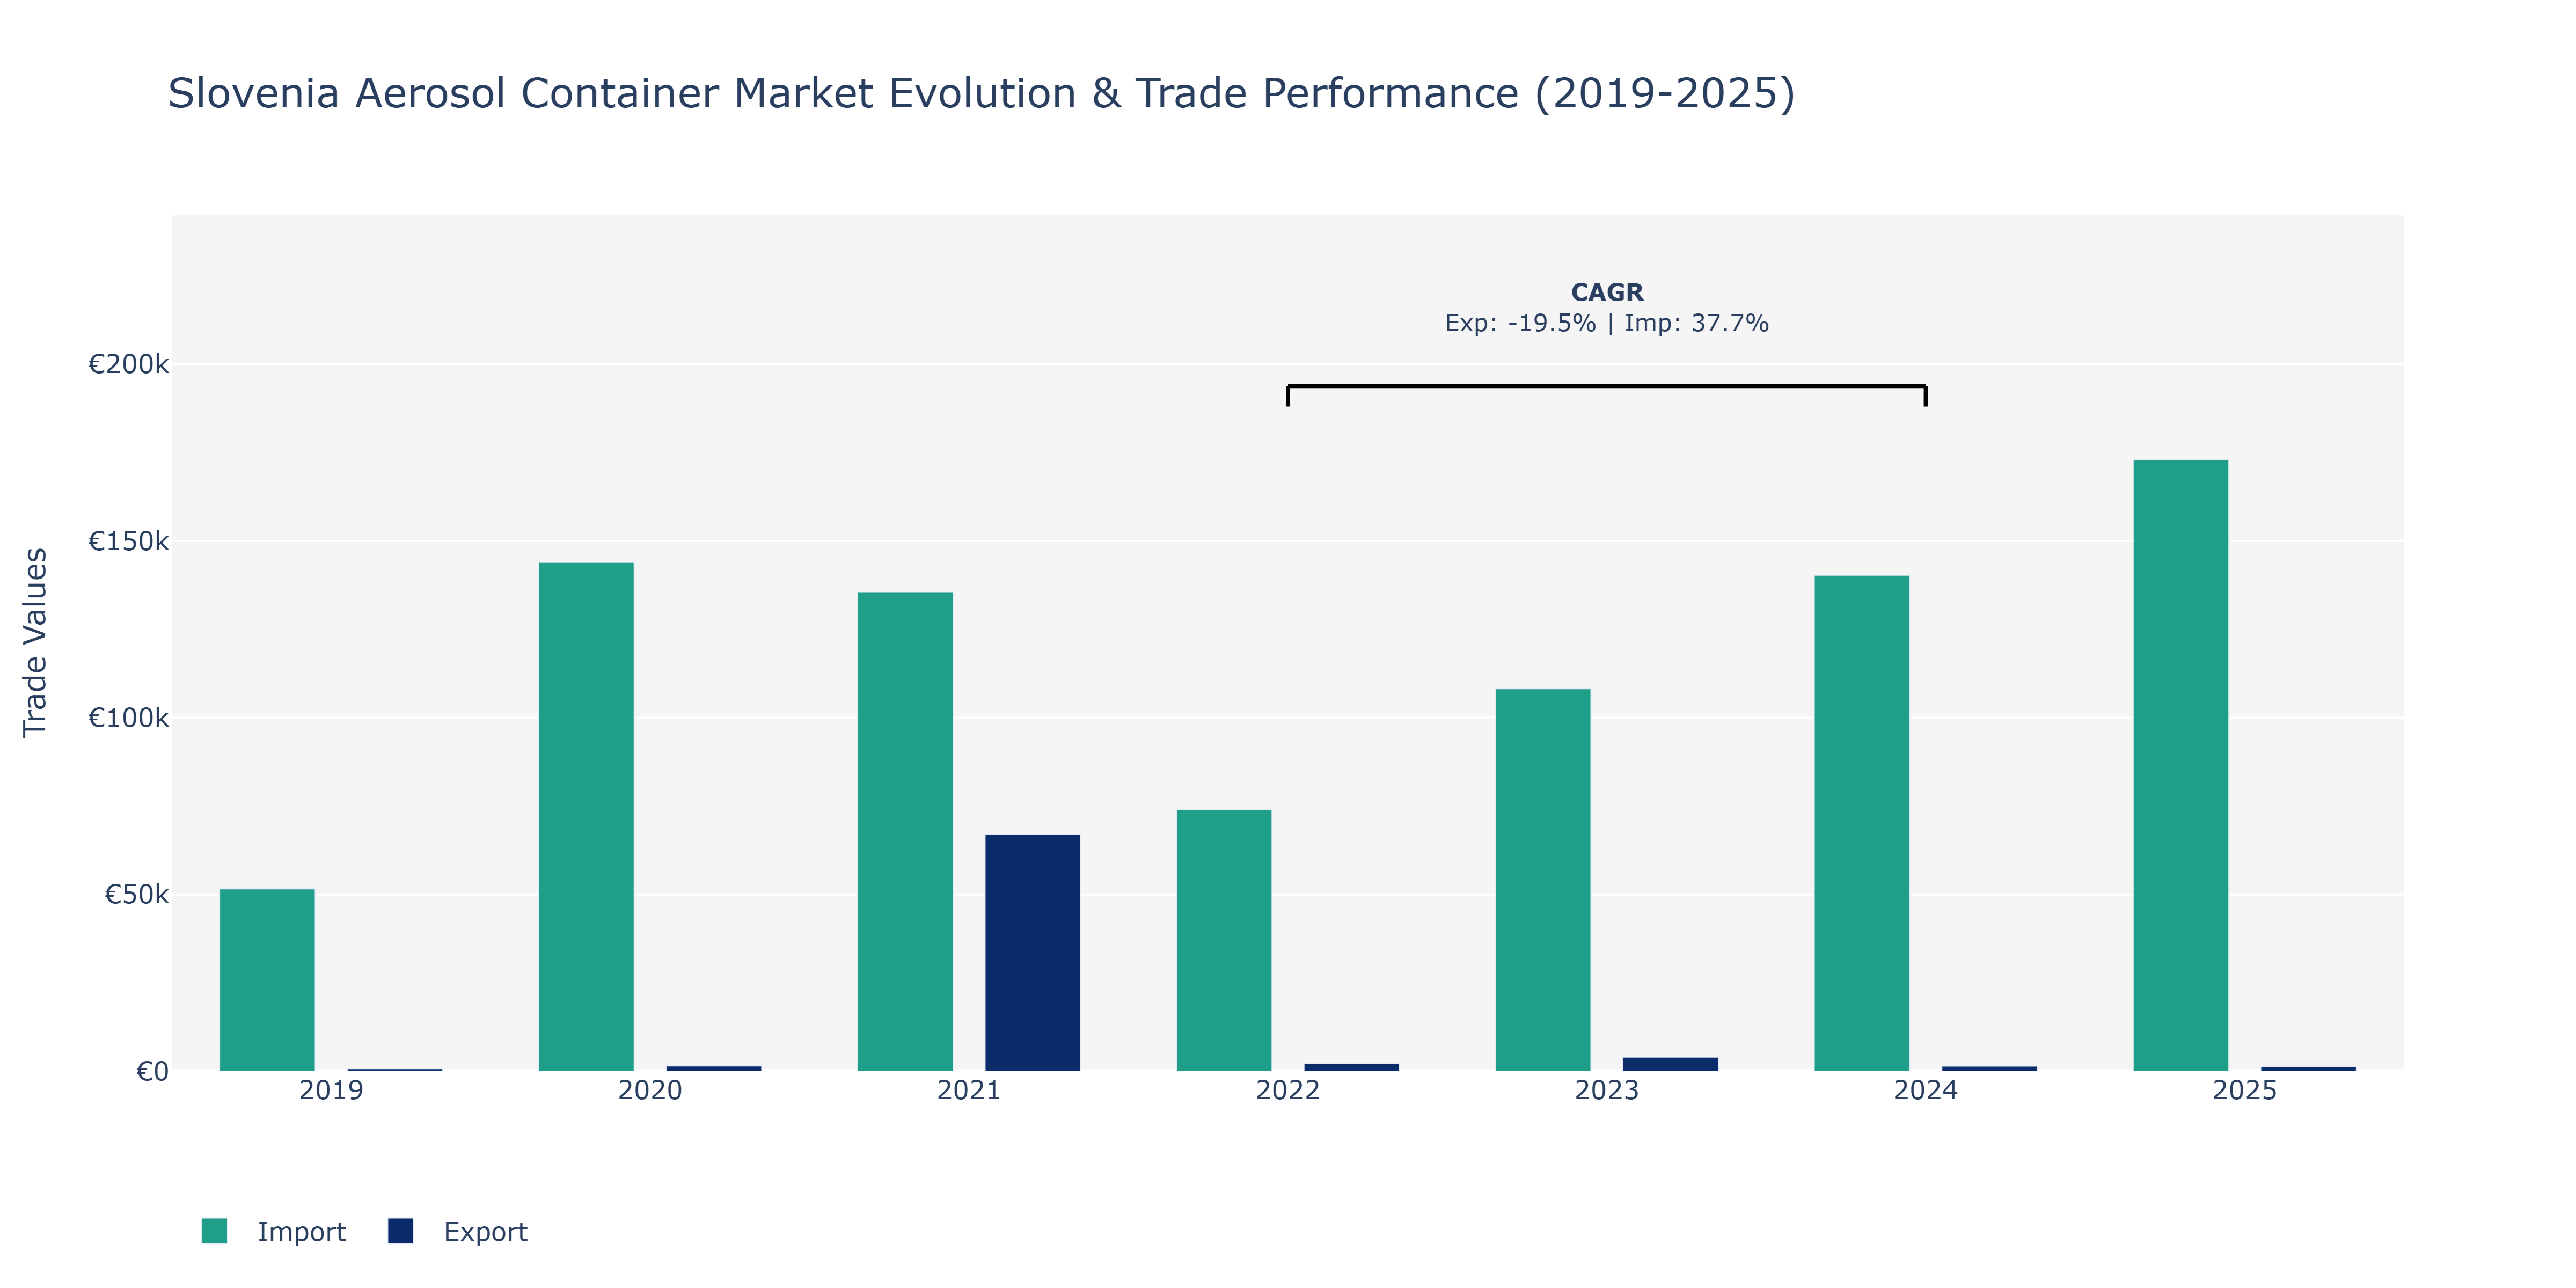
Between 2019 and 2025, Slovenia's Aerosol Container Market demonstrated notable shifts in both Exports and Imports. Exports saw an initial surge from €710 million in 2019 to €66.98 thousand in 2021, showcasing a substantial increase. However, a subsequent decline was observed in 2022 before stabilizing around €1.2 thousand in the following years. Imports, on the other hand, experienced a steady upward trajectory, rising from €51.58 thousand in 2019 to €173.08 thousand in 2025. The peak import value was recorded in 2025, reflecting a consistent growth trend. These fluctuations can be attributed to various factors such as evolving consumer preferences, economic conditions impacting trade flows, and possibly shifts in domestic production capacities affecting the need for imports. Such market dynamics highlight the importance of staying agile in response to changing global trade landscapes and the need for market players to adapt their strategies accordingly to maintain competitiveness.
Key Highlights of the Report:
- Slovenia Aerosol Container Market Outlook
- Market Size of Slovenia Aerosol Container Market, 2025
- Forecast of Slovenia Aerosol Container Market, 2032
- Historical Data and Forecast of Slovenia Aerosol Container Revenues & Volume for the Period 2022-2032F
- Slovenia Aerosol Container Market Trend Evolution
- Slovenia Aerosol Container Market Drivers and Challenges
- Slovenia Aerosol Container Price Trends
- Slovenia Aerosol Container Porter's Five Forces
- Slovenia Aerosol Container Industry Life Cycle
- Historical Data and Forecast of Slovenia Aerosol Container Market Revenues & Volume By Product for the Period 2022-2032F
- Historical Data and Forecast of Slovenia Aerosol Container Market Revenues & Volume By Metal for the Period 2022-2032F
- Historical Data and Forecast of Slovenia Aerosol Container Market Revenues & Volume By Glass for the Period 2022-2032F
- Historical Data and Forecast of Slovenia Aerosol Container Market Revenues & Volume By Plastic for the Period 2022-2032F
- Historical Data and Forecast of Slovenia Aerosol Container Market Revenues & Volume By Application for the Period 2022-2032F
- Historical Data and Forecast of Slovenia Aerosol Container Market Revenues & Volume By Personal Care for the Period 2022-2032F
- Historical Data and Forecast of Slovenia Aerosol Container Market Revenues & Volume By Household for the Period 2022-2032F
- Historical Data and Forecast of Slovenia Aerosol Container Market Revenues & Volume By Medical for the Period 2022-2032F
- Historical Data and Forecast of Slovenia Aerosol Container Market Revenues & Volume By Paint for the Period 2022-2032F
- Slovenia Aerosol Container Import Export Trade Statistics
- Market Opportunity Assessment By Product
- Market Opportunity Assessment By Application
- Slovenia Aerosol Container Top Companies Market Share
- Slovenia Aerosol Container Competitive Benchmarking By Technical and Operational Parameters
- Slovenia Aerosol Container Company Profiles
- Slovenia Aerosol Container Key Strategic Recommendations
Frequently Asked Questions About the Market Study (FAQs):
6Wresearch actively monitors the Slovenia Aerosol Container Market and publishes its comprehensive annual report, highlighting emerging trends, growth drivers, revenue analysis, and forecast outlook. Our insights help businesses to make data-backed strategic decisions with ongoing market dynamics. Our analysts track relevent industries related to the Slovenia Aerosol Container Market, allowing our clients with actionable intelligence and reliable forecasts tailored to emerging regional needs.
Yes, we provide customisation as per your requirements. To learn more, feel free to contact us on sales@6wresearch.com
1 Executive Summary |
2 Introduction |
2.1 Key Highlights of the Report |
2.2 Report Description |
2.3 Market Scope & Segmentation |
2.4 Research Methodology |
2.5 Assumptions |
3 Slovenia Aerosol Container Market Overview |
3.1 Slovenia Country Macro Economic Indicators |
3.2 Slovenia Aerosol Container Market Revenues & Volume, 2022 & 2032F |
3.3 Slovenia Aerosol Container Market - Industry Life Cycle |
3.4 Slovenia Aerosol Container Market - Porter's Five Forces |
3.5 Slovenia Aerosol Container Market Revenues & Volume Share, By Product, 2022 & 2032F |
3.6 Slovenia Aerosol Container Market Revenues & Volume Share, By Application, 2022 & 2032F |
4 Slovenia Aerosol Container Market Dynamics |
4.1 Impact Analysis |
4.2 Market Drivers |
4.2.1 Increase in demand for aerosol containers in the personal care and household products industries |
4.2.2 Growing popularity of aerosol packaging due to its convenience and ease of use |
4.2.3 Innovation in aerosol container design and materials leading to enhanced product differentiation |
4.3 Market Restraints |
4.3.1 Environmental concerns related to aerosol containers and their impact on the environment |
4.3.2 Stringent regulations and restrictions on certain ingredients used in aerosol products |
4.3.3 Fluctuating raw material prices affecting production costs of aerosol containers |
5 Slovenia Aerosol Container Market Trends |
6 Slovenia Aerosol Container Market, By Types |
6.1 Slovenia Aerosol Container Market, By Product |
6.1.1 Overview and Analysis |
6.1.2 Slovenia Aerosol Container Market Revenues & Volume, By Product, 2022-2032F |
6.1.3 Slovenia Aerosol Container Market Revenues & Volume, By Metal, 2022-2032F |
6.1.4 Slovenia Aerosol Container Market Revenues & Volume, By Glass, 2022-2032F |
6.1.5 Slovenia Aerosol Container Market Revenues & Volume, By Plastic, 2022-2032F |
6.2 Slovenia Aerosol Container Market, By Application |
6.2.1 Overview and Analysis |
6.2.2 Slovenia Aerosol Container Market Revenues & Volume, By Personal Care, 2022-2032F |
6.2.3 Slovenia Aerosol Container Market Revenues & Volume, By Household, 2022-2032F |
6.2.4 Slovenia Aerosol Container Market Revenues & Volume, By Medical, 2022-2032F |
6.2.5 Slovenia Aerosol Container Market Revenues & Volume, By Paint, 2022-2032F |
7 Slovenia Aerosol Container Market Import-Export Trade Statistics |
7.1 Slovenia Aerosol Container Market Export to Major Countries |
7.2 Slovenia Aerosol Container Market Imports from Major Countries |
8 Slovenia Aerosol Container Market Key Performance Indicators |
8.1 Percentage of aerosol containers made from recyclable materials |
8.2 Number of new product launches utilizing aerosol containers |
8.3 Rate of adoption of sustainable practices in aerosol container manufacturing and disposal |
8.4 Customer satisfaction levels with aerosol container design and functionality |
9 Slovenia Aerosol Container Market - Opportunity Assessment |
9.1 Slovenia Aerosol Container Market Opportunity Assessment, By Product, 2022 & 2032F |
9.2 Slovenia Aerosol Container Market Opportunity Assessment, By Application, 2022 & 2032F |
10 Slovenia Aerosol Container Market - Competitive Landscape |
10.1 Slovenia Aerosol Container Market Revenue Share, By Companies, 2025 |
10.2 Slovenia Aerosol Container Market Competitive Benchmarking, By Operating and Technical Parameters |
11 Company Profiles |
12 Recommendations |
13 Disclaimer |
Export potential assessment - trade Analytics for 2030
Export potential enables firms to identify high-growth global markets with greater confidence by combining advanced trade intelligence with a structured quantitative methodology. The framework analyzes emerging demand trends and country-level import patterns while integrating macroeconomic and trade datasets such as GDP and population forecasts, bilateral import–export flows, tariff structures, elasticity differentials between developed and developing economies, geographic distance, and import demand projections. Using weighted trade values from 2020–2024 as the base period to project country-to-country export potential for 2030, these inputs are operationalized through calculated drivers such as gravity model parameters, tariff impact factors, and projected GDP per-capita growth. Through an analysis of hidden potentials, demand hotspots, and market conditions that are most favorable to success, this method enables firms to focus on target countries, maximize returns, and global expansion with data, backed by accuracy.
By factoring in the projected importer demand gap that is currently unmet and could be potential opportunity, it identifies the potential for the Exporter (Country) among 190 countries, against the general trade analysis, which identifies the biggest importer or exporter.
To discover high-growth global markets and optimize your business strategy:
Click Here
Pricing
- Single User License$ 1,995
- Department License$ 2,400
- Site License$ 3,120
- Global License$ 3,795

Search
Thought Leadership and Analyst Meet


Our Clients
Latest Reports
- India Ultrasonic Smart Water Meter Market (2026-2032) | Outlook, Competition, Drivers, Trends, Demand, Competitive, Strategic Insights, Companies, Challenges, Strategy, Consumer Insights, Analysis, Opportunities, Growth, Size, Share, Industry, Revenue, Segments, Value, Segmentation, Supply, Forecast, Restraints,
- India Electromagnetic Bulk Flow Meter Market (2026-2032) | Analysis, Challenges, Strategic Insights, Supply, Forecast, Growth, Share, Consumer Insights, Competitive, Value, Outlook, Size & Demand,
- India Battery Powered Bulk Flow Meter Market (2026-2032) | Outlook, Analysis, Competitive Landscape, Growth, Size, Trends, Value, Revenue, Companies, Segmentation, Share & Forecast
- Bosnia and Herzegovina Fuel-Efficient Winglets Market (2026-2032) | Growth, Competition, Strategy, Restraints, Trends, Challenges, segmentation, Value, Outlook, Investment Opportunities, Analysis, Revenue, Companies, Insights, Pricing, Size, Drivers, Demand, Share, Forecast
- Canada Cloud CFD Market (2026-2032) | Size & Revenue, Industry, Growth, Competitive Landscape, Forecast, Segmentation, Value, Outlook, Trends, Share, Analysis, Companies
- Taiwan Food Delivery Platform Market (2026-2032) | Companies, Outlook, Analysis, Trends, Value, Revenue, Segmentation, Share, Forecast, Competitive Landscape, Growth, Size & Forecast
- United Kingdom (UK) Long-term Care Insurance Market (2026-2032) | Growth, Share, Consumer Insights, Drivers, Opportunities, Competition, Pricing Analysis, Segments, Restraints, Companies, Competitive, Value, Outlook, Size, Demand, Analysis, Challenges, Strategic Insights, Investment Trends, Revenue, Trends, Supply, Forecast
- United Kingdom (UK) Long Term Care Market (2026-2032) | Companies, Outlook, Analysis, Trends, Value, Revenue, Segmentation, Share, Forecast, Competitive Landscape, Growth, Size & Forecast
- Iraq Insulation and Waterproofing Market (2026-2032) | Outlook, Drivers, Growth, Size, Share, Industry, Revenue, Trends, Demand, Competitive, Strategic Insights, Opportunities, Segments, Companies, Challenges, Strategy, Consumer Insights, Analysis, Investment Trends, Value, Segmentation, Forecast, Restraints
- India Switchgear Market Outlook (2026-2032) | Size, Share, Trends, Growth, Revenue, Forecast, Analysis, Value, Outlook
Industry Events and Analyst Meet

HIMTEX 2026

India Refining Summit 2026

India EV Show 2026

EV tech India Expo 2026

Auto Tech Asia 2026
Whitepaper
- Middle East & Africa Commercial Security Market Click here to view more.
- Middle East & Africa Fire Safety Systems & Equipment Market Click here to view more.
- GCC Drone Market Click here to view more.
- Middle East Lighting Fixture Market Click here to view more.
- GCC Physical & Perimeter Security Market Click here to view more.
6WResearch In News
- Doha a strategic location for EV manufacturing hub: IPA Qatar
- Demand for luxury TVs surging in the GCC, says Samsung
- Empowering Growth: The Thriving Journey of Bangladesh’s Cable Industry
- Demand for luxury TVs surging in the GCC, says Samsung
- Video call with a traditional healer? Once unthinkable, it’s now common in South Africa
- Intelligent Buildings To Smooth GCC’s Path To Net Zero