Slovenia Benzene Market (2026-2032) | Outlook, Industry, Share, Analysis, Companies, Growth, Trends, Segmentation, Forecast, Size, Value & Revenue
Market Forecast By Derivative (Alkyl Benzene, Cumene, Cyclohexane, Ethyl Benzene, Nitro Benzene, Aniline, Toluene, Others), By Applications (Solvent, Chemical Intermediates, Surfactants, Plastics, Rubber Manufacturing, Detergent, Explosives, Others) And Competitive Landscape
| Product Code: ETC4753521 | Publication Date: Nov 2023 | Updated Date: Apr 2026 | Product Type: Market Research Report | |
| Publisher: 6Wresearch | Author: Shubham Padhi | No. of Pages: 60 | No. of Figures: 30 | No. of Tables: 5 |
Slovenia Benzene Market Size (2020-2030)
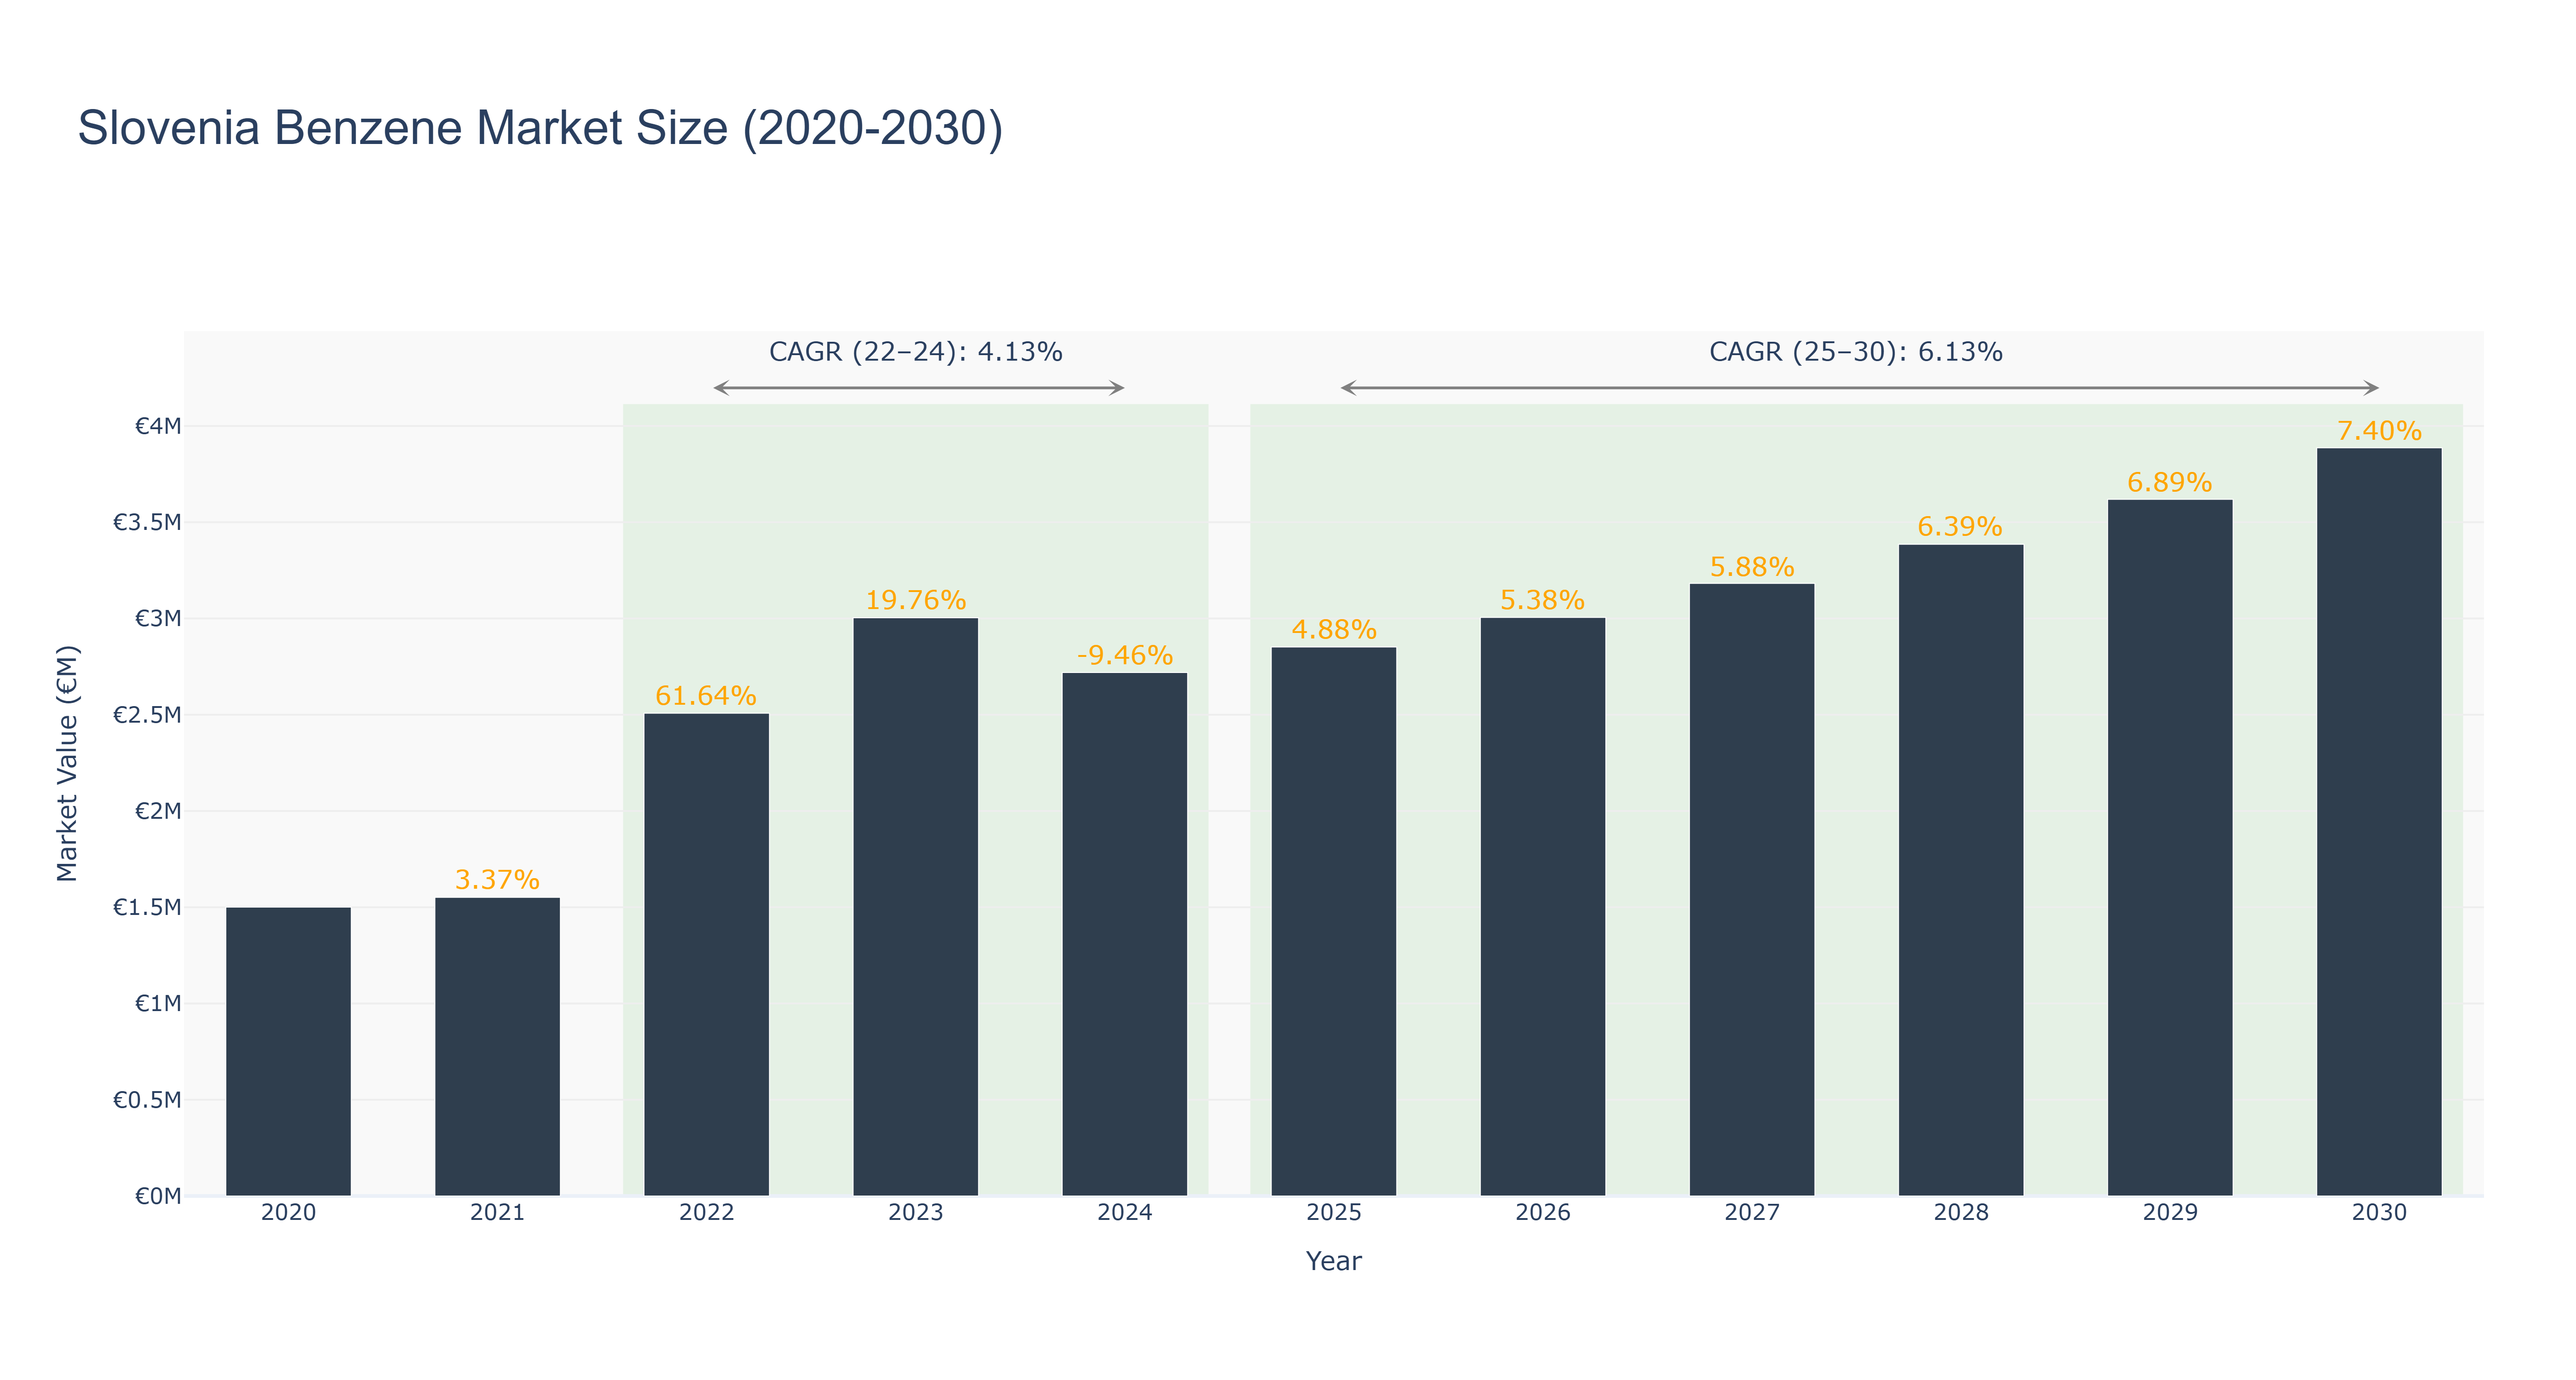
Slovenia Benzene Market has shown a steady growth trend over the years. The peak market size of €3.89 million is forecasted for 2030, with a CAGR of 6.13% from 2025 to 2030. The market experienced a slight decline in 2024 to €2.72 million, attributed to a negative growth rate of -9.46%. However, from 2025 onwards, the market rebounded with positive growth rates, indicating a resilient market. The CAGR from 2022 to 2024 was 4.13%, showcasing a moderate growth phase. Industry drivers such as increasing demand for benzene in various sectors like chemicals, plastics, and pharmaceuticals have contributed to this growth trajectory. In the near future, Slovenia is set to invest in renewable energy projects to reduce carbon emissions, which could further boost the benzene market by attracting environmentally conscious consumers and investors.
Slovenia Benzene Market: Production & Trade Performance (2019-2025)
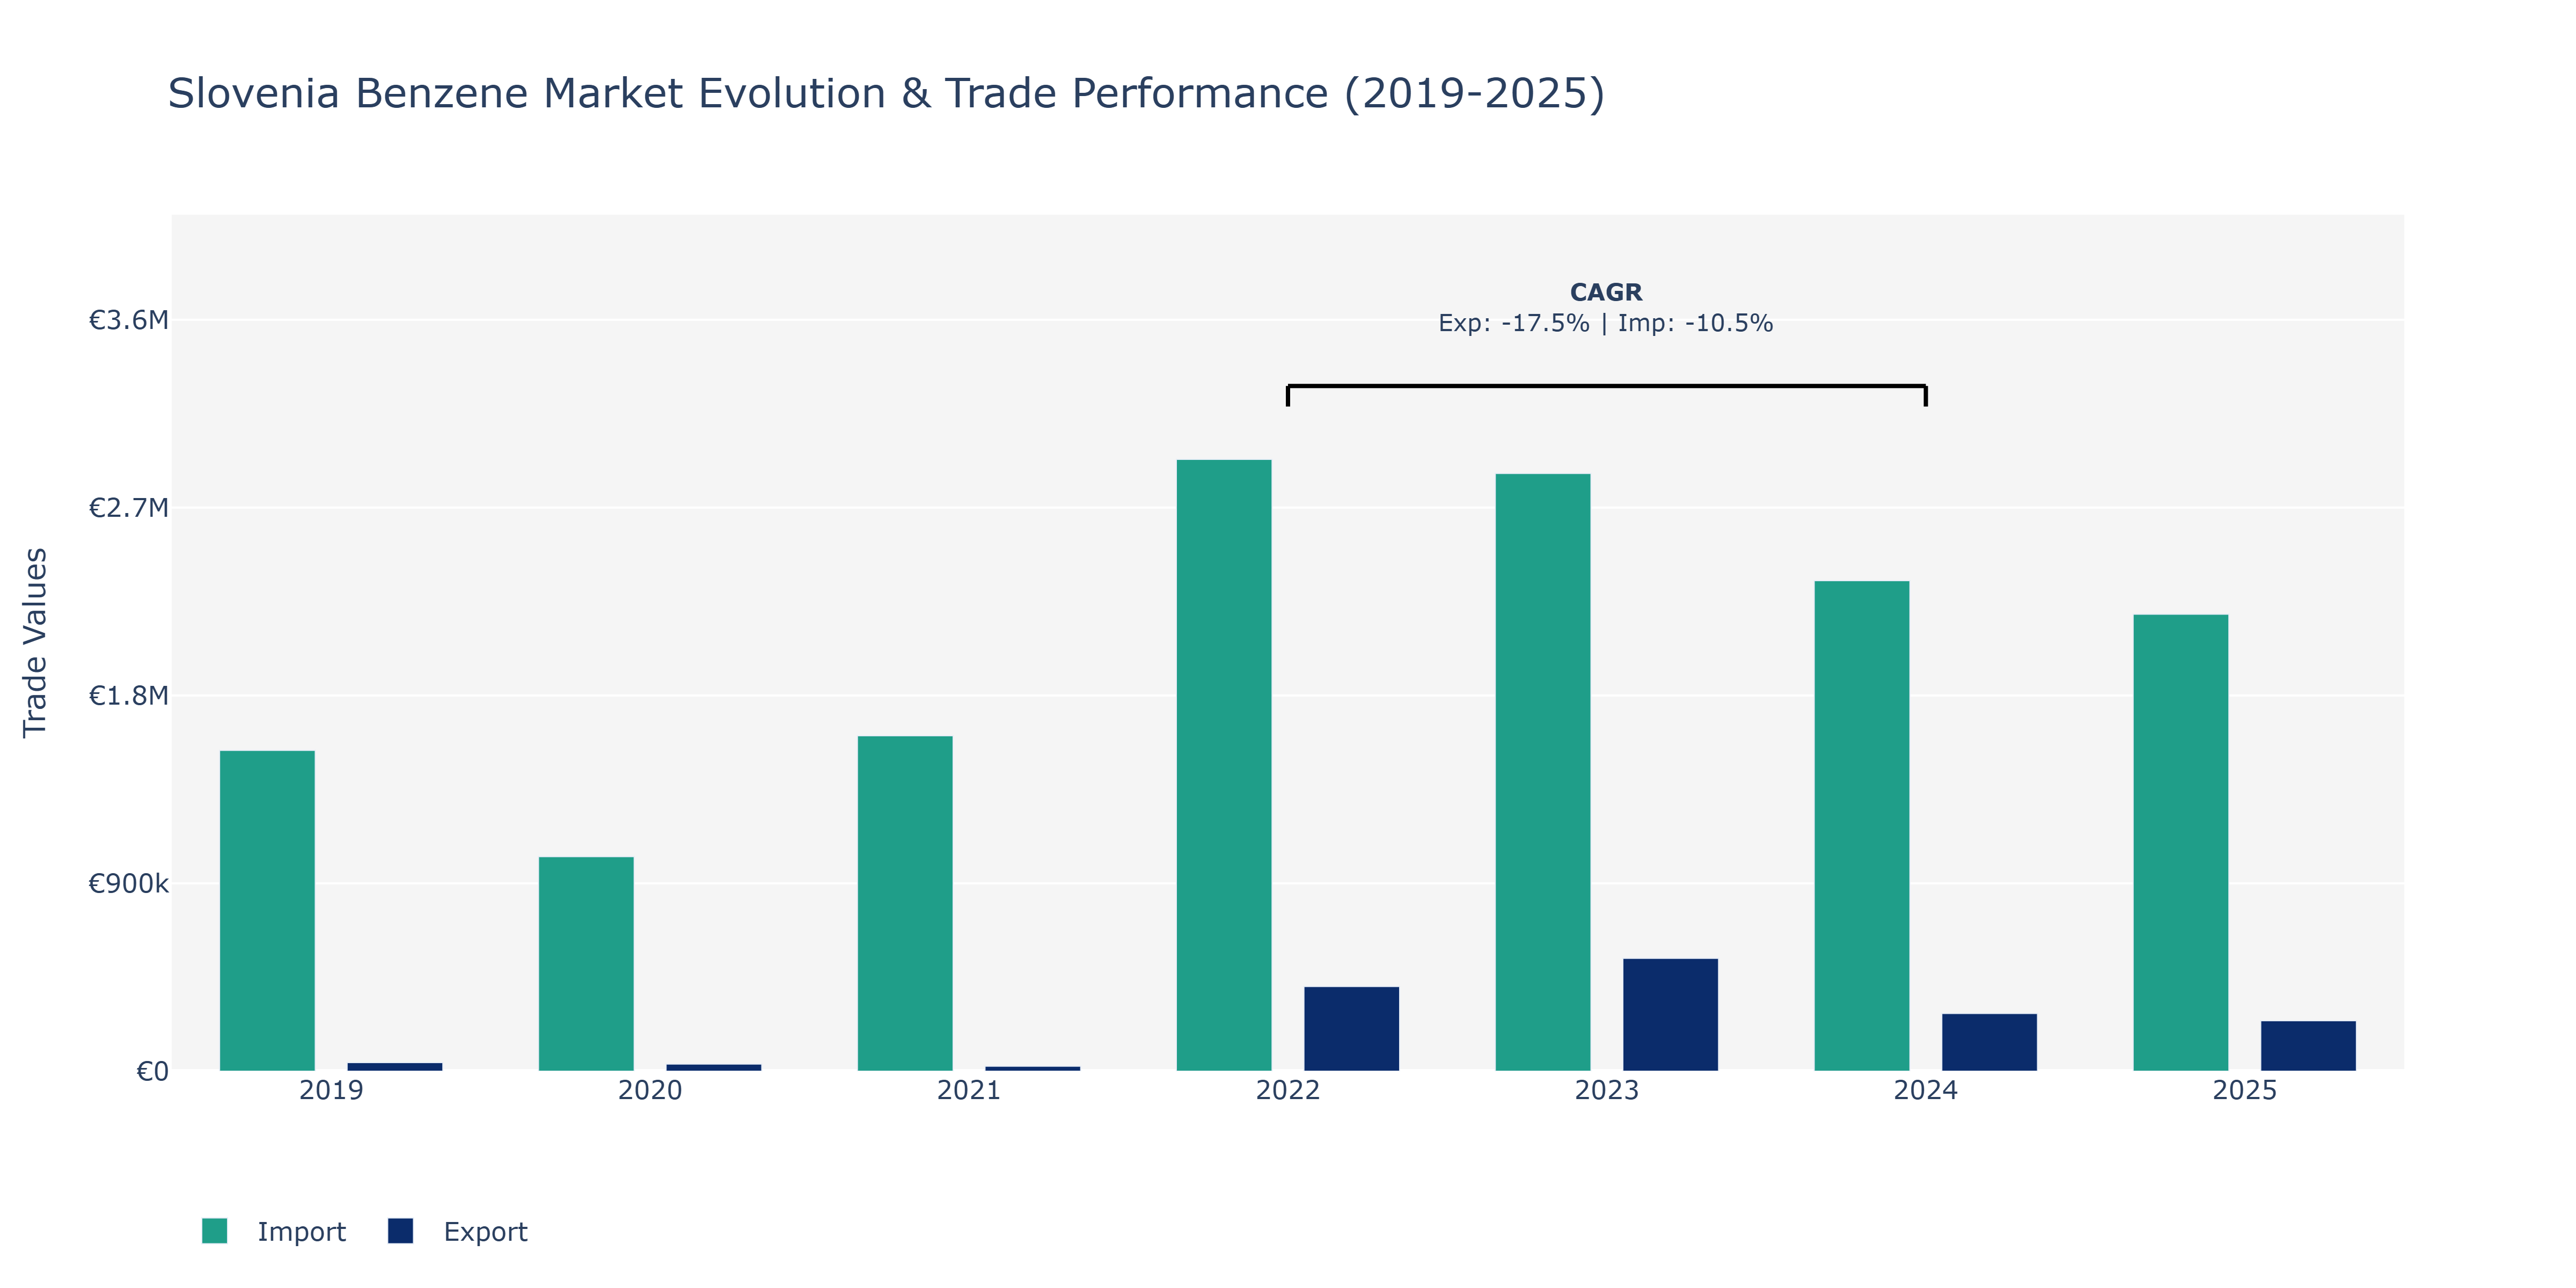
The Slovenia Benzene Market witnessed notable fluctuations in both Exports and Imports from 2019 to 2025. In 2019, Imports stood substantially higher than Exports, with Imports totaling €1.54 million compared to Exports of €41.14 thousand. The following year, 2020, marked a decline in both Exports, which decreased to €34.36 thousand, and Imports, which decreased to €1.03 million. The year 2021 saw a further decrease in Exports to €23.55 thousand, while Imports spiked to €1.61 million. The market experienced a significant rebound in 2022, with Exports soaring to €405.72 thousand and Imports to €2.93 million. However, by 2024, Exports dropped to €276.13 thousand, and Imports decreased to €2.35 million. By 2025, Exports further decreased to €241.31 thousand, while Imports declined to €2.19 million. These fluctuations could be attributed to various factors such as global demand shifts, price volatility, and geopolitical factors impacting trade relationships. The market may have experienced challenges amidst changing consumer preferences, regulatory changes, and economic conditions, influencing the trading dynamics of benzene in Slovenia.
Key Highlights of the Report:
- Slovenia Benzene Market Outlook
- Market Size of Slovenia Benzene Market, 2025
- Forecast of Slovenia Benzene Market, 2032
- Historical Data and Forecast of Slovenia Benzene Revenues & Volume for the Period 2022-2032F
- Slovenia Benzene Market Trend Evolution
- Slovenia Benzene Market Drivers and Challenges
- Slovenia Benzene Price Trends
- Slovenia Benzene Porter`s Five Forces
- Slovenia Benzene Industry Life Cycle
- Historical Data and Forecast of Slovenia Benzene Market Revenues & Volume By Derivative for the Period 2022-2032F
- Historical Data and Forecast of Slovenia Benzene Market Revenues & Volume By Alkyl Benzene for the Period 2022-2032F
- Historical Data and Forecast of Slovenia Benzene Market Revenues & Volume By Cumene for the Period 2022-2032F
- Historical Data and Forecast of Slovenia Benzene Market Revenues & Volume By Cyclohexane for the Period 2022-2032F
- Historical Data and Forecast of Slovenia Benzene Market Revenues & Volume By Ethyl Benzene for the Period 2022-2032F
- Historical Data and Forecast of Slovenia Benzene Market Revenues & Volume By Nitro Benzene for the Period 2022-2032F
- Historical Data and Forecast of Slovenia Benzene Market Revenues & Volume By Aniline for the Period 2022-2032F
- Historical Data and Forecast of Slovenia Benzene Market Revenues & Volume By Toluene for the Period 2022-2032F
- Historical Data and Forecast of Slovenia Alkyl Benzene Benzene Market Revenues & Volume By Others for the Period 2022-2032F
- Historical Data and Forecast of Slovenia Benzene Market Revenues & Volume By Applications for the Period 2022-2032F
- Historical Data and Forecast of Slovenia Benzene Market Revenues & Volume By Solvent for the Period 2022-2032F
- Historical Data and Forecast of Slovenia Benzene Market Revenues & Volume By Chemical Intermediates for the Period 2022-2032F
- Historical Data and Forecast of Slovenia Benzene Market Revenues & Volume By Surfactants for the Period 2022-2032F
- Historical Data and Forecast of Slovenia Benzene Market Revenues & Volume By Plastics for the Period 2022-2032F
- Historical Data and Forecast of Slovenia Benzene Market Revenues & Volume By Rubber Manufacturing for the Period 2022-2032F
- Historical Data and Forecast of Slovenia Benzene Market Revenues & Volume By Detergent for the Period 2022-2032F
- Historical Data and Forecast of Slovenia Benzene Market Revenues & Volume By Explosives for the Period 2022-2032F
- Historical Data and Forecast of Slovenia Benzene Market Revenues & Volume By Others for the Period 2022-2032F
- Slovenia Benzene Import Export Trade Statistics
- Market Opportunity Assessment By Derivative
- Market Opportunity Assessment By Applications
- Slovenia Benzene Top Companies Market Share
- Slovenia Benzene Competitive Benchmarking By Technical and Operational Parameters
- Slovenia Benzene Company Profiles
- Slovenia Benzene Key Strategic Recommendations
Frequently Asked Questions About the Market Study (FAQs):
6Wresearch actively monitors the Slovenia Benzene Market and publishes its comprehensive annual report, highlighting emerging trends, growth drivers, revenue analysis, and forecast outlook. Our insights help businesses to make data-backed strategic decisions with ongoing market dynamics. Our analysts track relevent industries related to the Slovenia Benzene Market, allowing our clients with actionable intelligence and reliable forecasts tailored to emerging regional needs.
Yes, we provide customisation as per your requirements. To learn more, feel free to contact us on sales@6wresearch.com
1 Executive Summary |
2 Introduction |
2.1 Key Highlights of the Report |
2.2 Report Description |
2.3 Market Scope & Segmentation |
2.4 Research Methodology |
2.5 Assumptions |
3 Slovenia Benzene Market Overview |
3.1 Slovenia Country Macro Economic Indicators |
3.2 Slovenia Benzene Market Revenues & Volume, 2022 & 2032F |
3.3 Slovenia Benzene Market - Industry Life Cycle |
3.4 Slovenia Benzene Market - Porter's Five Forces |
3.5 Slovenia Benzene Market Revenues & Volume Share, By Derivative, 2022 & 2032F |
3.6 Slovenia Benzene Market Revenues & Volume Share, By Applications, 2022 & 2032F |
4 Slovenia Benzene Market Dynamics |
4.1 Impact Analysis |
4.2 Market Drivers |
4.2.1 Increasing demand for benzene derivatives in various industries such as automotive, construction, and electronics. |
4.2.2 Growing investments in infrastructure development projects in Slovenia. |
4.2.3 Favorable government regulations supporting the production and use of benzene in the country. |
4.3 Market Restraints |
4.3.1 Volatility in raw material prices affecting the production cost of benzene. |
4.3.2 Environmental concerns and regulations related to benzene production and emissions. |
4.3.3 Competition from alternative chemicals and materials in the market. |
5 Slovenia Benzene Market Trends |
6 Slovenia Benzene Market Segmentations |
6.1 Slovenia Benzene Market, By Derivative |
6.1.1 Overview and Analysis |
6.1.2 Slovenia Benzene Market Revenues & Volume, By Alkyl Benzene, 2022-2032F |
6.1.3 Slovenia Benzene Market Revenues & Volume, By Cumene, 2022-2032F |
6.1.4 Slovenia Benzene Market Revenues & Volume, By Cyclohexane, 2022-2032F |
6.1.5 Slovenia Benzene Market Revenues & Volume, By Ethyl Benzene, 2022-2032F |
6.1.6 Slovenia Benzene Market Revenues & Volume, By Nitro Benzene, 2022-2032F |
6.1.7 Slovenia Benzene Market Revenues & Volume, By Aniline, 2022-2032F |
6.1.9 Slovenia Benzene Market Revenues & Volume, By Others, 2022-2032F |
6.1.10 Slovenia Benzene Market Revenues & Volume, By Others, 2022-2032F |
6.2 Slovenia Benzene Market, By Applications |
6.2.1 Overview and Analysis |
6.2.2 Slovenia Benzene Market Revenues & Volume, By Solvent, 2022-2032F |
6.2.3 Slovenia Benzene Market Revenues & Volume, By Chemical Intermediates, 2022-2032F |
6.2.4 Slovenia Benzene Market Revenues & Volume, By Surfactants, 2022-2032F |
6.2.5 Slovenia Benzene Market Revenues & Volume, By Plastics, 2022-2032F |
6.2.6 Slovenia Benzene Market Revenues & Volume, By Rubber Manufacturing, 2022-2032F |
6.2.7 Slovenia Benzene Market Revenues & Volume, By Detergent, 2022-2032F |
6.2.8 Slovenia Benzene Market Revenues & Volume, By Others, 2022-2032F |
6.2.9 Slovenia Benzene Market Revenues & Volume, By Others, 2022-2032F |
7 Slovenia Benzene Market Import-Export Trade Statistics |
7.1 Slovenia Benzene Market Export to Major Countries |
7.2 Slovenia Benzene Market Imports from Major Countries |
8 Slovenia Benzene Market Key Performance Indicators |
8.1 Average selling price of benzene in Slovenia. |
8.2 Capacity utilization rate of benzene production facilities. |
8.3 Number of new product developments or innovations in benzene derivatives. |
8.4 Environmental compliance metrics related to benzene production. |
8.5 Percentage of benzene imports versus domestic production for Slovenia. |
9 Slovenia Benzene Market - Opportunity Assessment |
9.1 Slovenia Benzene Market Opportunity Assessment, By Derivative, 2022 & 2032F |
9.2 Slovenia Benzene Market Opportunity Assessment, By Applications, 2022 & 2032F |
10 Slovenia Benzene Market - Competitive Landscape |
10.1 Slovenia Benzene Market Revenue Share, By Companies, 2025 |
10.2 Slovenia Benzene Market Competitive Benchmarking, By Operating and Technical Parameters |
11 Company Profiles |
12 Recommendations | 13 Disclaimer |
Export potential assessment - trade Analytics for 2030
Export potential enables firms to identify high-growth global markets with greater confidence by combining advanced trade intelligence with a structured quantitative methodology. The framework analyzes emerging demand trends and country-level import patterns while integrating macroeconomic and trade datasets such as GDP and population forecasts, bilateral import–export flows, tariff structures, elasticity differentials between developed and developing economies, geographic distance, and import demand projections. Using weighted trade values from 2020–2024 as the base period to project country-to-country export potential for 2030, these inputs are operationalized through calculated drivers such as gravity model parameters, tariff impact factors, and projected GDP per-capita growth. Through an analysis of hidden potentials, demand hotspots, and market conditions that are most favorable to success, this method enables firms to focus on target countries, maximize returns, and global expansion with data, backed by accuracy.
By factoring in the projected importer demand gap that is currently unmet and could be potential opportunity, it identifies the potential for the Exporter (Country) among 190 countries, against the general trade analysis, which identifies the biggest importer or exporter.
To discover high-growth global markets and optimize your business strategy:
Click Here
Pricing
- Single User License$ 1,995
- Department License$ 2,400
- Site License$ 3,120
- Global License$ 3,795

Search
Thought Leadership and Analyst Meet


Our Clients
Latest Reports
- India Electromagnetic Bulk Flow Meter Market (2026-2032) | Analysis, Challenges, Strategic Insights, Supply, Forecast, Growth, Share, Consumer Insights, Competitive, Value, Outlook, Size & Demand,
- India Battery Powered Bulk Flow Meter Market (2026-2032) | Outlook, Analysis, Competitive Landscape, Growth, Size, Trends, Value, Revenue, Companies, Segmentation, Share & Forecast
- Bosnia and Herzegovina Fuel-Efficient Winglets Market (2026-2032) | Growth, Competition, Strategy, Restraints, Trends, Challenges, segmentation, Value, Outlook, Investment Opportunities, Analysis, Revenue, Companies, Insights, Pricing, Size, Drivers, Demand, Share, Forecast
- Canada Cloud CFD Market (2026-2032) | Size & Revenue, Industry, Growth, Competitive Landscape, Forecast, Segmentation, Value, Outlook, Trends, Share, Analysis, Companies
- Taiwan Food Delivery Platform Market (2026-2032) | Companies, Outlook, Analysis, Trends, Value, Revenue, Segmentation, Share, Forecast, Competitive Landscape, Growth, Size & Forecast
- United Kingdom (UK) Long-term Care Insurance Market (2026-2032) | Growth, Share, Consumer Insights, Drivers, Opportunities, Competition, Pricing Analysis, Segments, Restraints, Companies, Competitive, Value, Outlook, Size, Demand, Analysis, Challenges, Strategic Insights, Investment Trends, Revenue, Trends, Supply, Forecast
- United Kingdom (UK) Long Term Care Market (2026-2032) | Companies, Outlook, Analysis, Trends, Value, Revenue, Segmentation, Share, Forecast, Competitive Landscape, Growth, Size & Forecast
- Iraq Insulation and Waterproofing Market (2026-2032) | Outlook, Drivers, Growth, Size, Share, Industry, Revenue, Trends, Demand, Competitive, Strategic Insights, Opportunities, Segments, Companies, Challenges, Strategy, Consumer Insights, Analysis, Investment Trends, Value, Segmentation, Forecast, Restraints
- India Switchgear Market Outlook (2026-2032) | Size, Share, Trends, Growth, Revenue, Forecast, Analysis, Value, Outlook
- Pakistan Contraceptive Implants Market (2025-2031) | Demand, Growth, Size, Share, Industry, Pricing Analysis, Competitive, Strategic Insights, Strategy, Consumer Insights, Analysis, Investment Trends, Opportunities, Revenue, Segments, Value, Segmentation, Supply, Forecast, Restraints, Outlook, Competition, Drivers, Trends, Companies, Challenges
Industry Events and Analyst Meet

India EV Show 2026

EV tech India Expo 2026

Auto Tech Asia 2026

Battery Tech India 2026

Smart Production Solutions Guangzhou 2026
Whitepaper
- Middle East & Africa Commercial Security Market Click here to view more.
- Middle East & Africa Fire Safety Systems & Equipment Market Click here to view more.
- GCC Drone Market Click here to view more.
- Middle East Lighting Fixture Market Click here to view more.
- GCC Physical & Perimeter Security Market Click here to view more.
6WResearch In News
- Doha a strategic location for EV manufacturing hub: IPA Qatar
- Demand for luxury TVs surging in the GCC, says Samsung
- Empowering Growth: The Thriving Journey of Bangladesh’s Cable Industry
- Demand for luxury TVs surging in the GCC, says Samsung
- Video call with a traditional healer? Once unthinkable, it’s now common in South Africa
- Intelligent Buildings To Smooth GCC’s Path To Net Zero