Slovenia Cyanuric Acid Market (2026-2032) | Consumer Insights, Competition, Supply, Restraints, Forecast, Industry, Investment Trends, Size, Share, Strategy, Strategic Insights, Value, Outlook, Challenges, Companies, Growth, Pricing Analysis, Opportunities, Trends, Revenue, Segmentation, Drivers, Analysis, Competitive, Demand, Segments
Market Forecast By Product Type (Granular Cyanuric Acid, Liquid Cyanuric Acid, Tablet Form Cyanuric Acid, Powdered Cyanuric Acid), By Technology Type (Chemical Stabilization, Aqueous Formulation, Slow Release Technology, High Purity Form), By End User (Swimming Pool Owners, Water Treatment Plants, Agriculture Sector, Industrial Users), By Application (Chlorine Stabilization in Pools, UV Protection for Water Treatment, Herbicide and Pesticide Applications, Chemical Manufacturing Processes) And Competitive Landscape
| Product Code: ETC11687460 | Publication Date: Apr 2025 | Updated Date: Apr 2026 | Product Type: Market Research Report | |
| Publisher: 6Wresearch | Author: Bhawna Singh | No. of Pages: 65 | No. of Figures: 34 | No. of Tables: 19 |
Slovenia Cyanuric Acid Market Size (2020-2030)
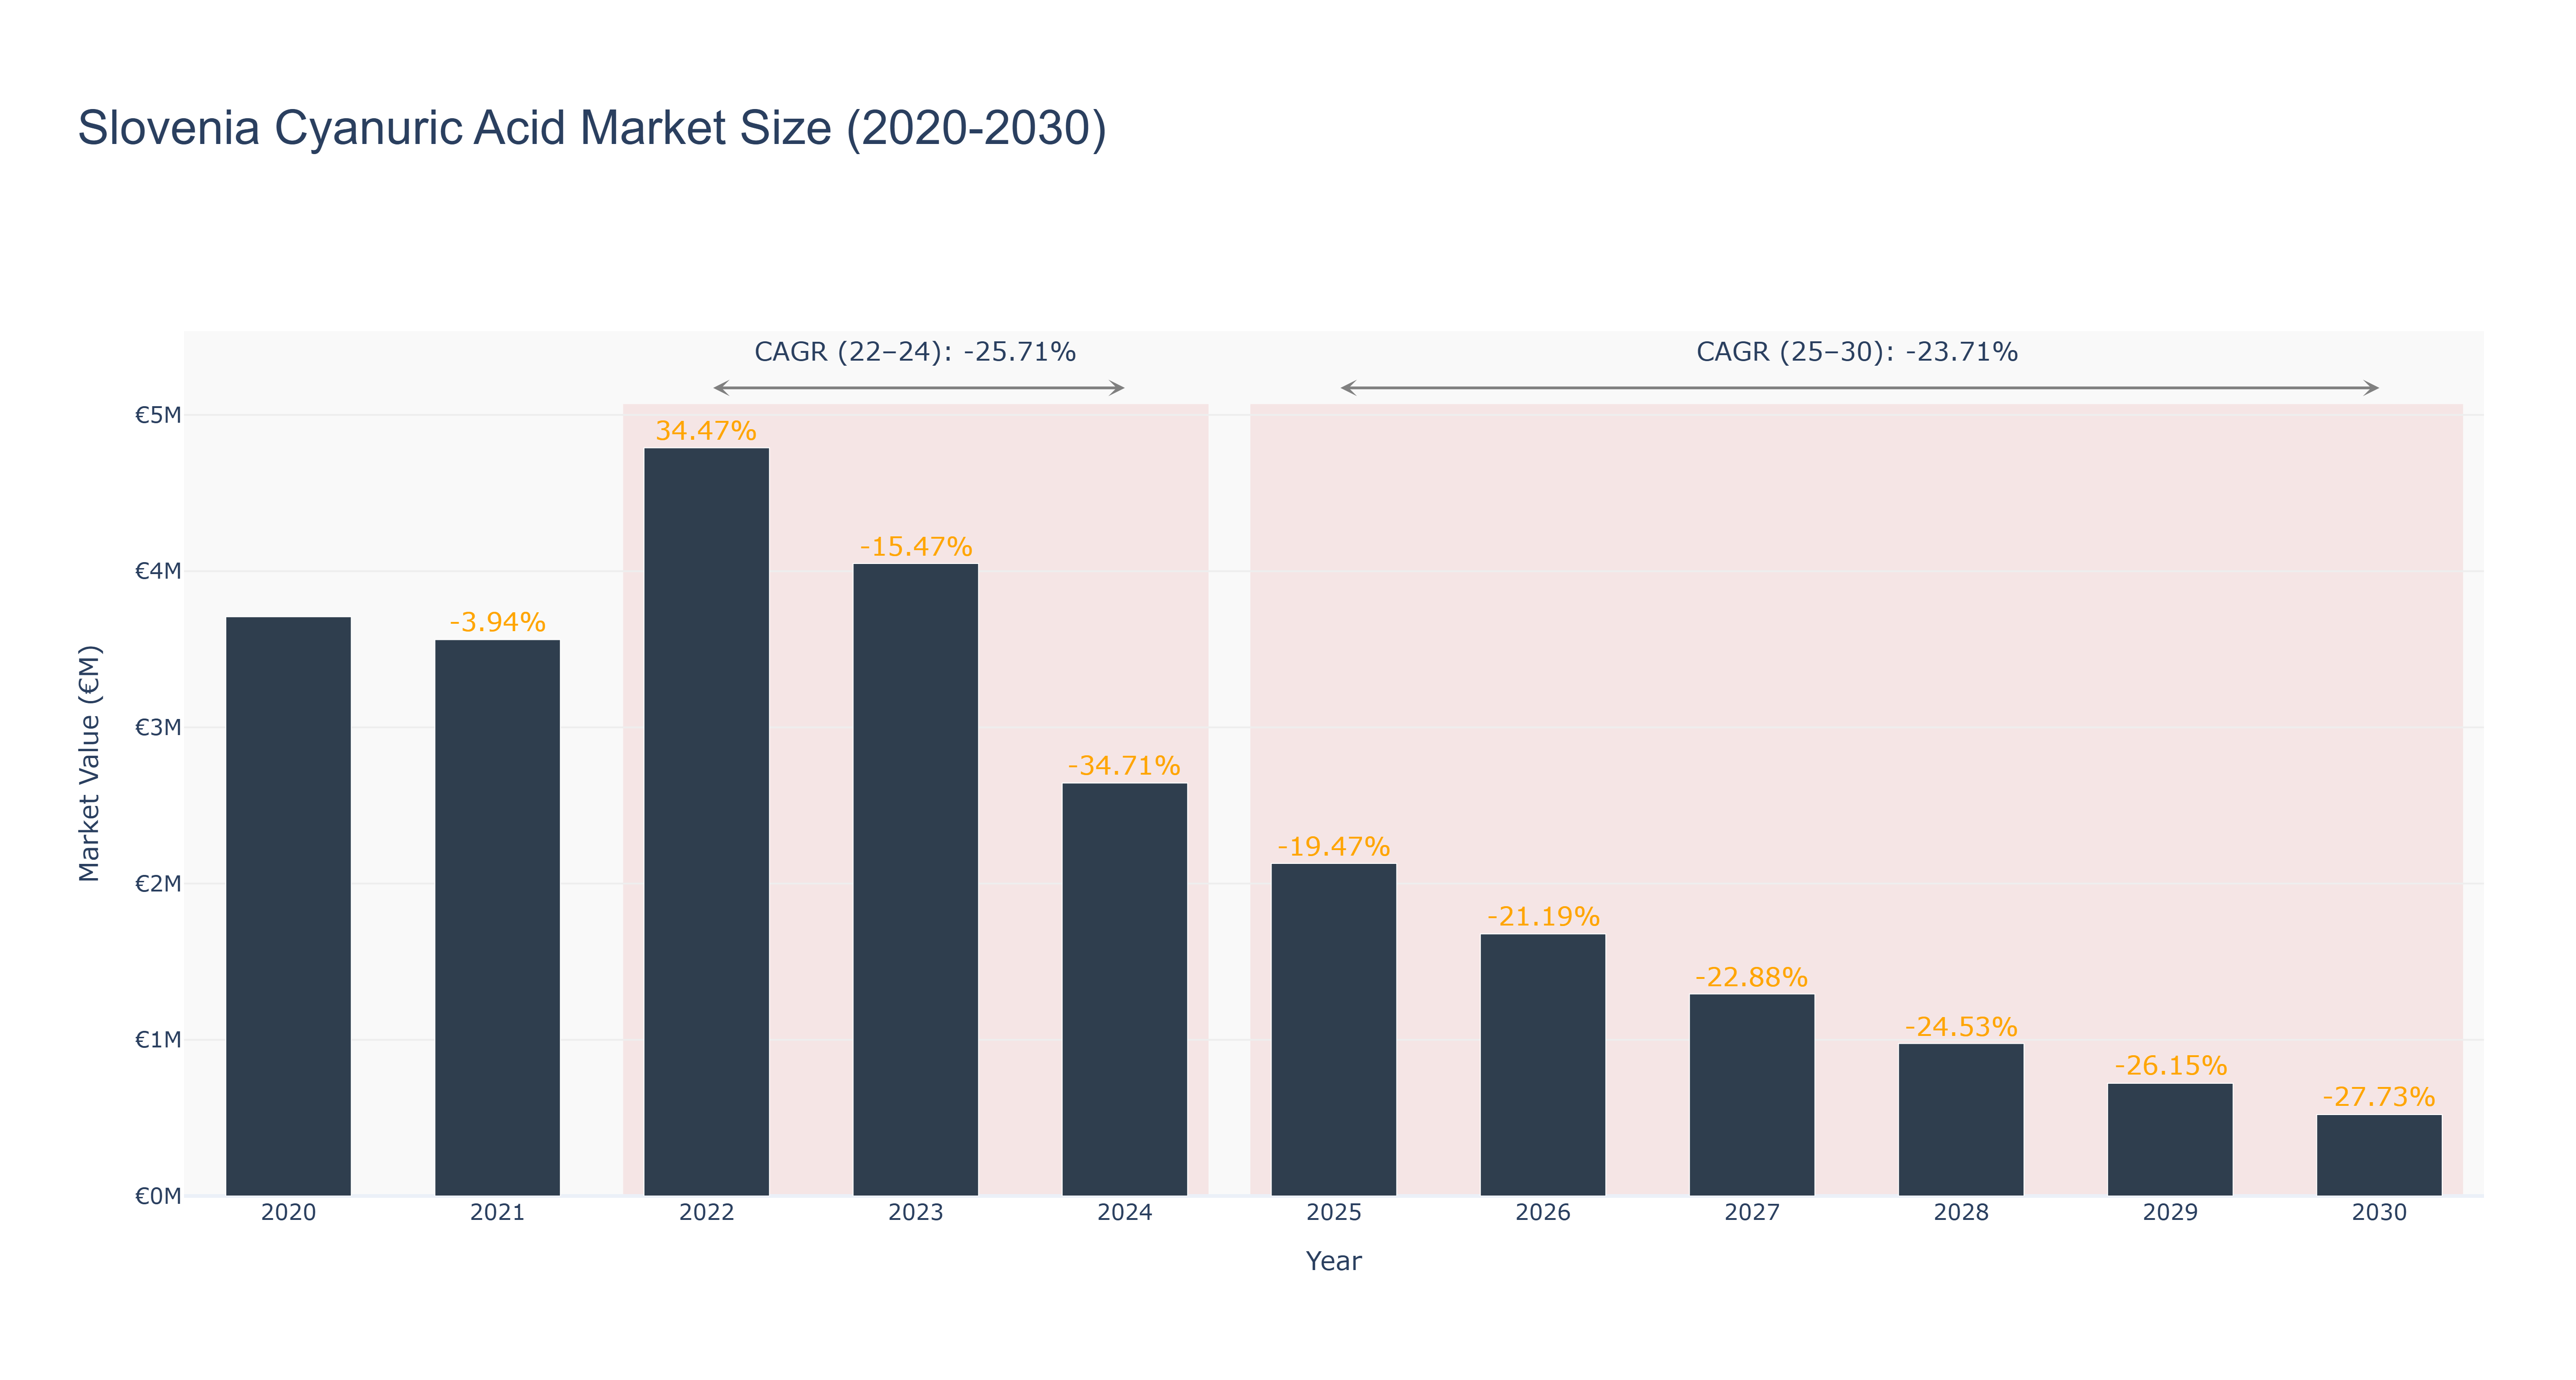
The Slovenia Cyanuric Acid Market saw a peak market size of €4.79 million in 2022, exhibiting a remarkable growth of 34.47% compared to the previous year. However, this upward trend was short-lived, as the market subsequently declined to €4.05 million in 2023 and further to €2.64 million in 2024, reflecting a CAGR of -25.71% for the actual period from 2022 to 2024. The projected outlook from 2025 to 2030 shows a continued contraction, with forecasted market sizes decreasing from €2.13 million in 2025 to €521.12 thousand by 2030, resulting in a CAGR of -23.71%. This decline can be attributed to shifting industry dynamics, including reduced demand for cyanuric acid in agricultural applications and increasing regulatory pressures. While no significant upcoming projects have been identified, macroeconomic factors such as fluctuating raw material prices and environmental regulations will likely influence market trends moving forward.
Slovenia Cyanuric Acid Market: Production & Trade Performance (2019-2025)
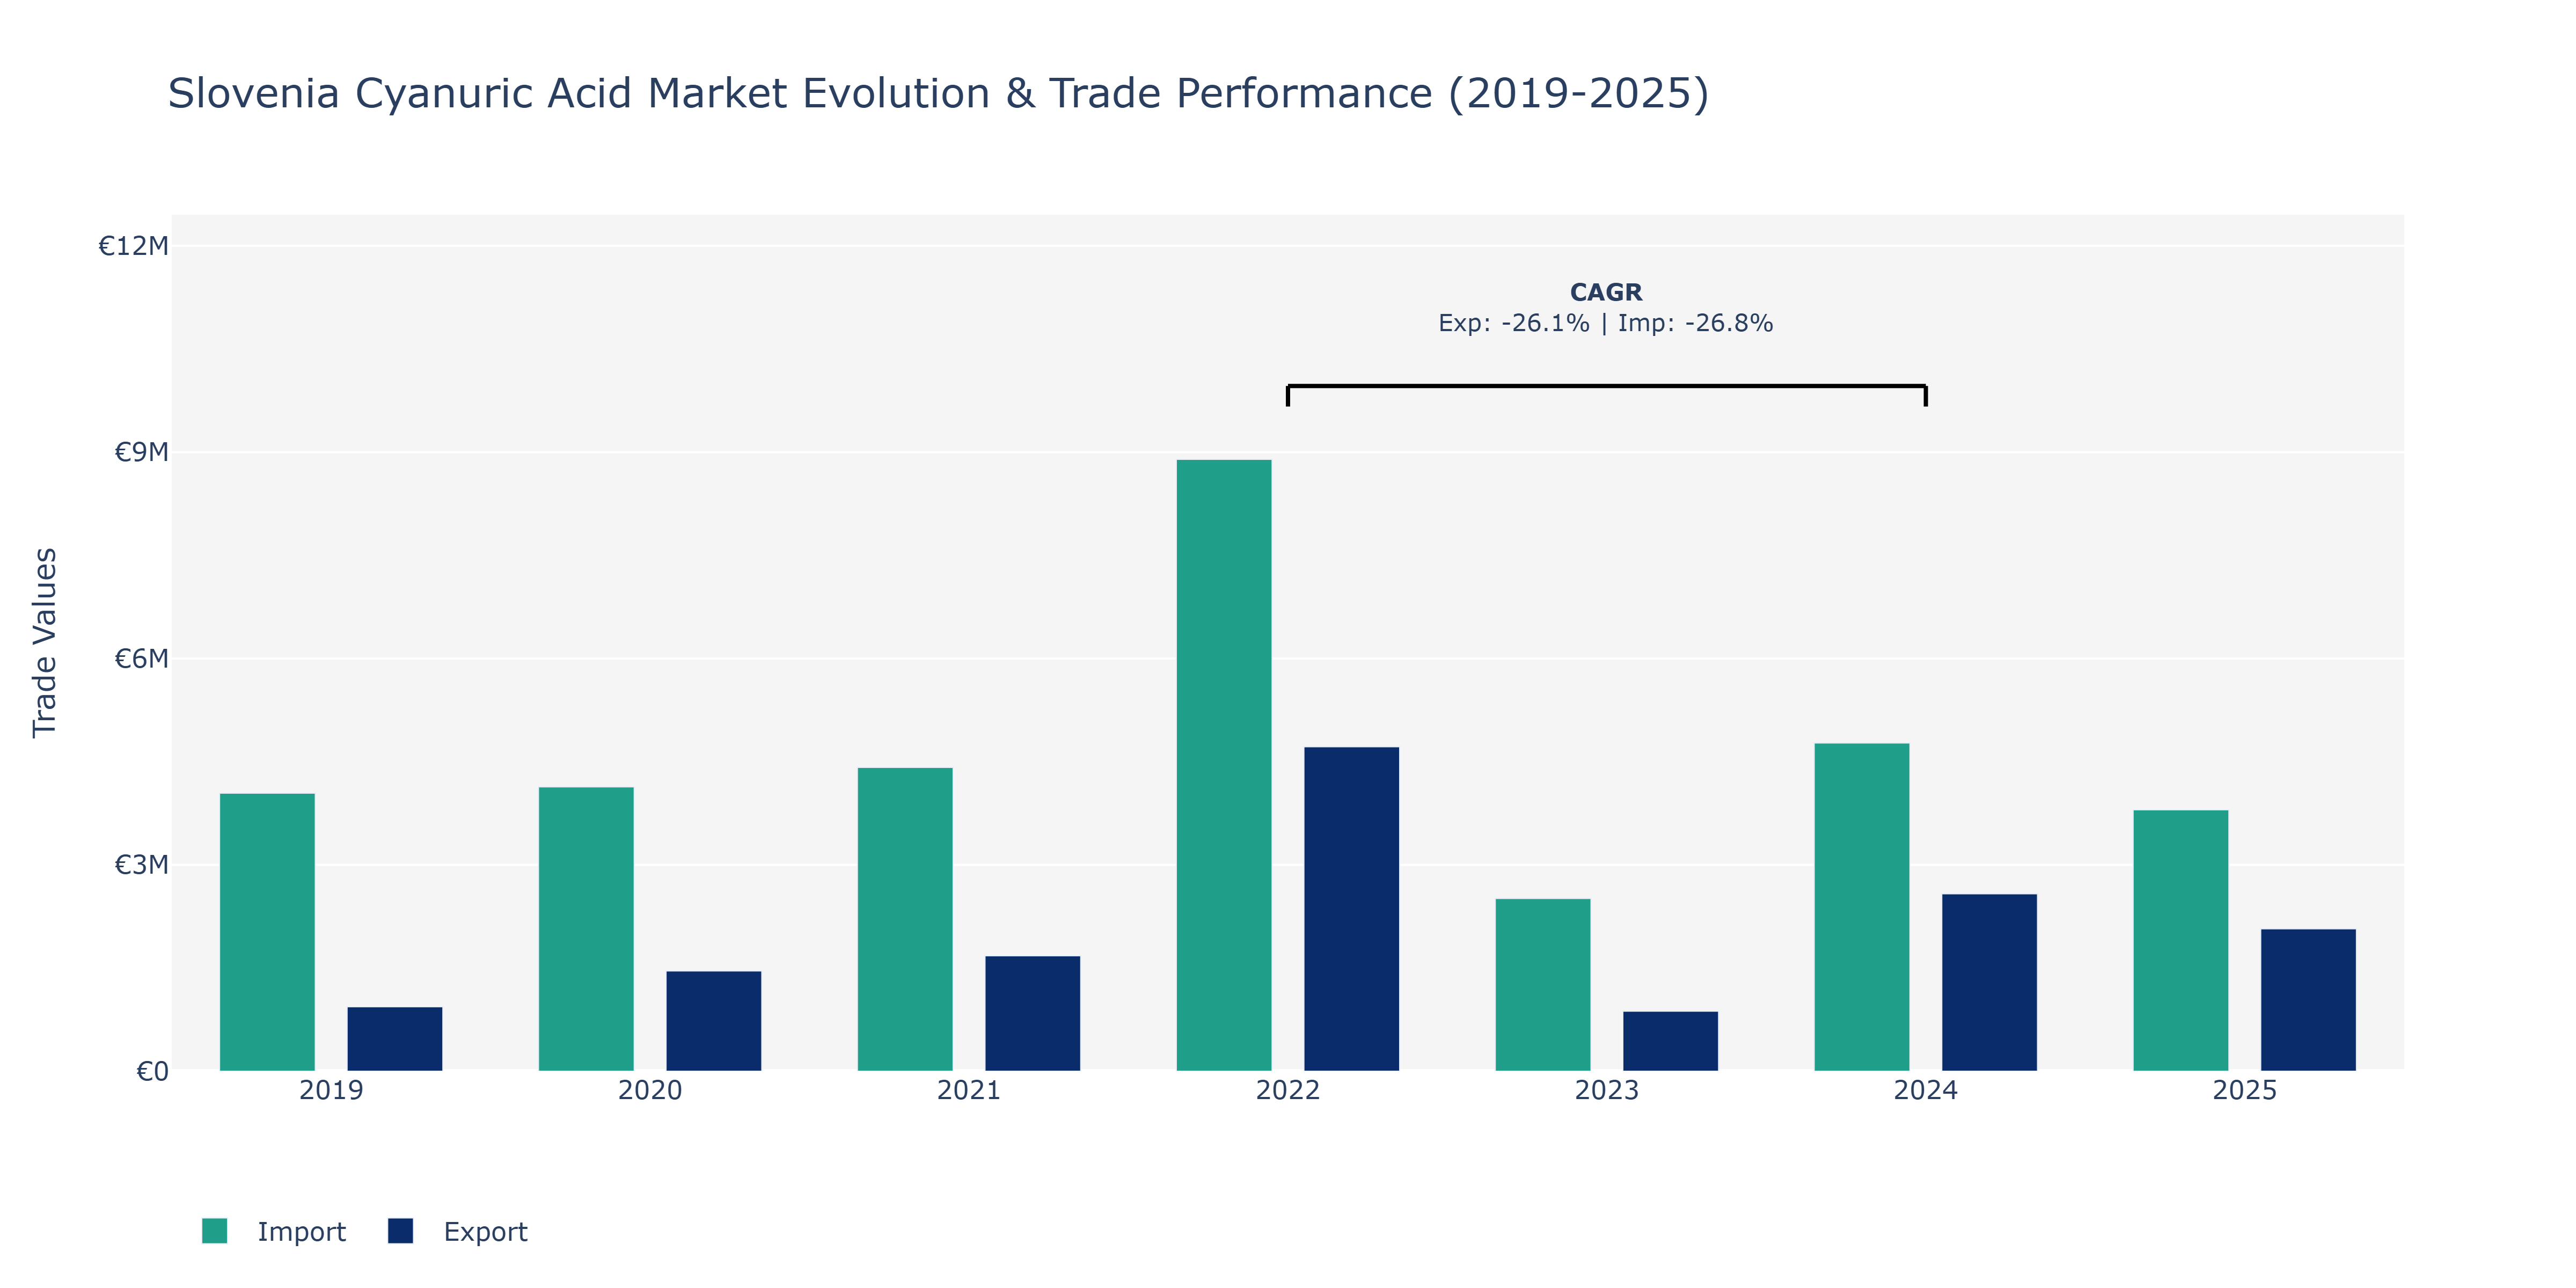
In the Slovenia Cyanuric Acid Market, exports and imports experienced notable fluctuations during the analyzed period. From 2019 to 2021, both exports and imports showed a consistent upward trend, with exports increasing from €935.33 thousand to €1.68 million and imports rising from €4.04 million to €4.42 million. However, in 2022, a significant surge was observed in exports, reaching €4.72 million, while imports surged to €8.9 million. This spike could be attributed to increased demand for cyanuric acid in various industries, such as water treatment and agriculture, necessitating higher import volumes to meet domestic needs. Subsequently, in 2023, both exports and imports saw a sharp decline, possibly due to market saturation or regulatory changes impacting trade flows. The market rebounded in 2024, showcasing a recovery in both metrics. The negative CAGR for exports and imports from 2022 to 2024 at -26.05% and -26.76%, respectively, indicates a temporary setback possibly influenced by global economic conditions or shifts in supply chain dynamics. To sustain growth, stakeholders in the Slovenia Cyanuric Acid Market may need to focus on diversifying export markets and optimizing import processes to navigate future uncertainties and leverage emerging opportunities in the chemical industry.
Key Highlights of the Report:
- Slovenia Cyanuric Acid Market Outlook
- Market Size of Slovenia Cyanuric Acid Market, 2025
- Forecast of Slovenia Cyanuric Acid Market, 2032
- Historical Data and Forecast of Slovenia Cyanuric Acid Revenues & Volume for the Period 2022-2032F
- Slovenia Cyanuric Acid Market Trend Evolution
- Slovenia Cyanuric Acid Market Drivers and Challenges
- Slovenia Cyanuric Acid Price Trends
- Slovenia Cyanuric Acid Porter's Five Forces
- Slovenia Cyanuric Acid Industry Life Cycle
- Historical Data and Forecast of Slovenia Cyanuric Acid Market Revenues & Volume By Product Type for the Period 2022-2032F
- Historical Data and Forecast of Slovenia Cyanuric Acid Market Revenues & Volume By Granular Cyanuric Acid for the Period 2022-2032F
- Historical Data and Forecast of Slovenia Cyanuric Acid Market Revenues & Volume By Liquid Cyanuric Acid for the Period 2022-2032F
- Historical Data and Forecast of Slovenia Cyanuric Acid Market Revenues & Volume By Tablet Form Cyanuric Acid for the Period 2022-2032F
- Historical Data and Forecast of Slovenia Cyanuric Acid Market Revenues & Volume By Powdered Cyanuric Acid for the Period 2022-2032F
- Historical Data and Forecast of Slovenia Cyanuric Acid Market Revenues & Volume By Technology Type for the Period 2022-2032F
- Historical Data and Forecast of Slovenia Cyanuric Acid Market Revenues & Volume By Chemical Stabilization for the Period 2022-2032F
- Historical Data and Forecast of Slovenia Cyanuric Acid Market Revenues & Volume By Aqueous Formulation for the Period 2022-2032F
- Historical Data and Forecast of Slovenia Cyanuric Acid Market Revenues & Volume By Slow Release Technology for the Period 2022-2032F
- Historical Data and Forecast of Slovenia Cyanuric Acid Market Revenues & Volume By High Purity Form for the Period 2022-2032F
- Historical Data and Forecast of Slovenia Cyanuric Acid Market Revenues & Volume By End User for the Period 2022-2032F
- Historical Data and Forecast of Slovenia Cyanuric Acid Market Revenues & Volume By Swimming Pool Owners for the Period 2022-2032F
- Historical Data and Forecast of Slovenia Cyanuric Acid Market Revenues & Volume By Water Treatment Plants for the Period 2022-2032F
- Historical Data and Forecast of Slovenia Cyanuric Acid Market Revenues & Volume By Agriculture Sector for the Period 2022-2032F
- Historical Data and Forecast of Slovenia Cyanuric Acid Market Revenues & Volume By Industrial Users for the Period 2022-2032F
- Historical Data and Forecast of Slovenia Cyanuric Acid Market Revenues & Volume By Application for the Period 2022-2032F
- Historical Data and Forecast of Slovenia Cyanuric Acid Market Revenues & Volume By Chlorine Stabilization in Pools for the Period 2022-2032F
- Historical Data and Forecast of Slovenia Cyanuric Acid Market Revenues & Volume By UV Protection for Water Treatment for the Period 2022-2032F
- Historical Data and Forecast of Slovenia Cyanuric Acid Market Revenues & Volume By Herbicide and Pesticide Applications for the Period 2022-2032F
- Historical Data and Forecast of Slovenia Cyanuric Acid Market Revenues & Volume By Chemical Manufacturing Processes for the Period 2022-2032F
- Slovenia Cyanuric Acid Import Export Trade Statistics
- Market Opportunity Assessment By Product Type
- Market Opportunity Assessment By Technology Type
- Market Opportunity Assessment By End User
- Market Opportunity Assessment By Application
- Slovenia Cyanuric Acid Top Companies Market Share
- Slovenia Cyanuric Acid Competitive Benchmarking By Technical and Operational Parameters
- Slovenia Cyanuric Acid Company Profiles
- Slovenia Cyanuric Acid Key Strategic Recommendations
Frequently Asked Questions About the Market Study (FAQs):
6Wresearch actively monitors the Slovenia Cyanuric Acid Market and publishes its comprehensive annual report, highlighting emerging trends, growth drivers, revenue analysis, and forecast outlook. Our insights help businesses to make data-backed strategic decisions with ongoing market dynamics. Our analysts track relevent industries related to the Slovenia Cyanuric Acid Market, allowing our clients with actionable intelligence and reliable forecasts tailored to emerging regional needs.
Yes, we provide customisation as per your requirements. To learn more, feel free to contact us on sales@6wresearch.com
1 Executive Summary |
2 Introduction |
2.1 Key Highlights of the Report |
2.2 Report Description |
2.3 Market Scope & Segmentation |
2.4 Research Methodology |
2.5 Assumptions |
3 Slovenia Cyanuric Acid Market Overview |
3.1 Slovenia Country Macro Economic Indicators |
3.2 Slovenia Cyanuric Acid Market Revenues & Volume, 2022 & 2032F |
3.3 Slovenia Cyanuric Acid Market - Industry Life Cycle |
3.4 Slovenia Cyanuric Acid Market - Porter's Five Forces |
3.5 Slovenia Cyanuric Acid Market Revenues & Volume Share, By Product Type, 2022 & 2032F |
3.6 Slovenia Cyanuric Acid Market Revenues & Volume Share, By Technology Type, 2022 & 2032F |
3.7 Slovenia Cyanuric Acid Market Revenues & Volume Share, By End User, 2022 & 2032F |
3.8 Slovenia Cyanuric Acid Market Revenues & Volume Share, By Application, 2022 & 2032F |
4 Slovenia Cyanuric Acid Market Dynamics |
4.1 Impact Analysis |
4.2 Market Drivers |
4.3 Market Restraints |
5 Slovenia Cyanuric Acid Market Trends |
6 Slovenia Cyanuric Acid Market, By Types |
6.1 Slovenia Cyanuric Acid Market, By Product Type |
6.1.1 Overview and Analysis |
6.1.2 Slovenia Cyanuric Acid Market Revenues & Volume, By Product Type, 2022 - 2032F |
6.1.3 Slovenia Cyanuric Acid Market Revenues & Volume, By Granular Cyanuric Acid, 2022 - 2032F |
6.1.4 Slovenia Cyanuric Acid Market Revenues & Volume, By Liquid Cyanuric Acid, 2022 - 2032F |
6.1.5 Slovenia Cyanuric Acid Market Revenues & Volume, By Tablet Form Cyanuric Acid, 2022 - 2032F |
6.1.6 Slovenia Cyanuric Acid Market Revenues & Volume, By Powdered Cyanuric Acid, 2022 - 2032F |
6.2 Slovenia Cyanuric Acid Market, By Technology Type |
6.2.1 Overview and Analysis |
6.2.2 Slovenia Cyanuric Acid Market Revenues & Volume, By Chemical Stabilization, 2022 - 2032F |
6.2.3 Slovenia Cyanuric Acid Market Revenues & Volume, By Aqueous Formulation, 2022 - 2032F |
6.2.4 Slovenia Cyanuric Acid Market Revenues & Volume, By Slow Release Technology, 2022 - 2032F |
6.2.5 Slovenia Cyanuric Acid Market Revenues & Volume, By High Purity Form, 2022 - 2032F |
6.3 Slovenia Cyanuric Acid Market, By End User |
6.3.1 Overview and Analysis |
6.3.2 Slovenia Cyanuric Acid Market Revenues & Volume, By Swimming Pool Owners, 2022 - 2032F |
6.3.3 Slovenia Cyanuric Acid Market Revenues & Volume, By Water Treatment Plants, 2022 - 2032F |
6.3.4 Slovenia Cyanuric Acid Market Revenues & Volume, By Agriculture Sector, 2022 - 2032F |
6.3.5 Slovenia Cyanuric Acid Market Revenues & Volume, By Industrial Users, 2022 - 2032F |
6.4 Slovenia Cyanuric Acid Market, By Application |
6.4.1 Overview and Analysis |
6.4.2 Slovenia Cyanuric Acid Market Revenues & Volume, By Chlorine Stabilization in Pools, 2022 - 2032F |
6.4.3 Slovenia Cyanuric Acid Market Revenues & Volume, By UV Protection for Water Treatment, 2022 - 2032F |
6.4.4 Slovenia Cyanuric Acid Market Revenues & Volume, By Herbicide and Pesticide Applications, 2022 - 2032F |
6.4.5 Slovenia Cyanuric Acid Market Revenues & Volume, By Chemical Manufacturing Processes, 2022 - 2032F |
7 Slovenia Cyanuric Acid Market Import-Export Trade Statistics |
7.1 Slovenia Cyanuric Acid Market Export to Major Countries |
7.2 Slovenia Cyanuric Acid Market Imports from Major Countries |
8 Slovenia Cyanuric Acid Market Key Performance Indicators |
9 Slovenia Cyanuric Acid Market - Opportunity Assessment |
9.1 Slovenia Cyanuric Acid Market Opportunity Assessment, By Product Type, 2022 & 2032F |
9.2 Slovenia Cyanuric Acid Market Opportunity Assessment, By Technology Type, 2022 & 2032F |
9.3 Slovenia Cyanuric Acid Market Opportunity Assessment, By End User, 2022 & 2032F |
9.4 Slovenia Cyanuric Acid Market Opportunity Assessment, By Application, 2022 & 2032F |
10 Slovenia Cyanuric Acid Market - Competitive Landscape |
10.1 Slovenia Cyanuric Acid Market Revenue Share, By Companies, 2025 |
10.2 Slovenia Cyanuric Acid Market Competitive Benchmarking, By Operating and Technical Parameters |
11 Company Profiles |
12 Recommendations |
13 Disclaimer |
Export potential assessment - trade Analytics for 2030
Export potential enables firms to identify high-growth global markets with greater confidence by combining advanced trade intelligence with a structured quantitative methodology. The framework analyzes emerging demand trends and country-level import patterns while integrating macroeconomic and trade datasets such as GDP and population forecasts, bilateral import–export flows, tariff structures, elasticity differentials between developed and developing economies, geographic distance, and import demand projections. Using weighted trade values from 2020–2024 as the base period to project country-to-country export potential for 2030, these inputs are operationalized through calculated drivers such as gravity model parameters, tariff impact factors, and projected GDP per-capita growth. Through an analysis of hidden potentials, demand hotspots, and market conditions that are most favorable to success, this method enables firms to focus on target countries, maximize returns, and global expansion with data, backed by accuracy.
By factoring in the projected importer demand gap that is currently unmet and could be potential opportunity, it identifies the potential for the Exporter (Country) among 190 countries, against the general trade analysis, which identifies the biggest importer or exporter.
To discover high-growth global markets and optimize your business strategy:
Click Here
Pricing
- Single User License$ 1,995
- Department License$ 2,400
- Site License$ 3,120
- Global License$ 3,795

Search
Thought Leadership and Analyst Meet


Our Clients
Latest Reports
- Canada Cloud CFD Market (2026-2032) | Size & Revenue, Industry, Growth, Competitive Landscape, Forecast, Segmentation, Value, Outlook, Trends, Share, Analysis, Companies
- Taiwan Food Delivery Platform Market (2026-2032) | Companies, Outlook, Analysis, Trends, Value, Revenue, Segmentation, Share, Forecast, Competitive Landscape, Growth, Size & Forecast
- United Kingdom (UK) Long-term Care Insurance Market (2026-2032) | Growth, Share, Consumer Insights, Drivers, Opportunities, Competition, Pricing Analysis, Segments, Restraints, Companies, Competitive, Value, Outlook, Size, Demand, Analysis, Challenges, Strategic Insights, Investment Trends, Revenue, Trends, Supply, Forecast
- United Kingdom (UK) Long Term Care Market (2026-2032) | Companies, Outlook, Analysis, Trends, Value, Revenue, Segmentation, Share, Forecast, Competitive Landscape, Growth, Size & Forecast
- Iraq Insulation and Waterproofing Market (2026-2032) | Outlook, Drivers, Growth, Size, Share, Industry, Revenue, Trends, Demand, Competitive, Strategic Insights, Opportunities, Segments, Companies, Challenges, Strategy, Consumer Insights, Analysis, Investment Trends, Value, Segmentation, Forecast, Restraints
- India Switchgear Market Outlook (2026-2032) | Size, Share, Trends, Growth, Revenue, Forecast, Analysis, Value, Outlook
- Pakistan Contraceptive Implants Market (2025-2031) | Demand, Growth, Size, Share, Industry, Pricing Analysis, Competitive, Strategic Insights, Strategy, Consumer Insights, Analysis, Investment Trends, Opportunities, Revenue, Segments, Value, Segmentation, Supply, Forecast, Restraints, Outlook, Competition, Drivers, Trends, Companies, Challenges
- Sri Lanka Packaging Market (2026-2032) | Outlook, Competition, Drivers, Trends, Demand, Pricing Analysis, Competitive, Strategic Insights, Companies, Challenges, Strategy, Consumer Insights, Analysis, Investment Trends, Opportunities, Growth, Size, Share, Industry, Revenue, Segments, Value, Segmentation, Supply, Forecast, Restraints
- India Kids Watches Market (2026-2032) | Strategy, Consumer Insights, Analysis, Investment Trends, Opportunities, Growth, Size, Share, Industry, Revenue, Segments, Value, Segmentation, Supply, Forecast, Restraints, Outlook, Competition, Drivers, Trends, Demand, Pricing Analysis, Competitive, Strategic Insights, Companies, Challenges
- Saudi Arabia Core Assurance Service Market (2025-2031) | Strategy, Consumer Insights, Analysis, Investment Trends, Opportunities, Growth, Size, Share, Industry, Revenue, Segments, Value, Segmentation, Supply, Forecast, Restraints, Outlook, Competition, Drivers, Trends, Demand, Pricing Analysis, Competitive, Strategic Insights, Companies, Challenges
Industry Events and Analyst Meet

India EV Show 2026

EV tech India Expo 2026

Auto Tech Asia 2026

Battery Tech India 2026

Smart Production Solutions Guangzhou 2026
Whitepaper
- Middle East & Africa Commercial Security Market Click here to view more.
- Middle East & Africa Fire Safety Systems & Equipment Market Click here to view more.
- GCC Drone Market Click here to view more.
- Middle East Lighting Fixture Market Click here to view more.
- GCC Physical & Perimeter Security Market Click here to view more.
6WResearch In News
- Doha a strategic location for EV manufacturing hub: IPA Qatar
- Demand for luxury TVs surging in the GCC, says Samsung
- Empowering Growth: The Thriving Journey of Bangladesh’s Cable Industry
- Demand for luxury TVs surging in the GCC, says Samsung
- Video call with a traditional healer? Once unthinkable, it’s now common in South Africa
- Intelligent Buildings To Smooth GCC’s Path To Net Zero