Slovenia Liqueurs Market (2026-2032) | Industry, Companies, Analysis, Forecast, Value, Share, Segmentation, Outlook, Revenue, Size, Trends & Growth
Market Forecast By Type (Neutrals/Bitters, Creams, Fruit Flavored, Others), By Distribution Channel (Convenience Stores, On Premises, Retailers, Supermarkets), By Packaging (Glass, PET Bottle, Metal Can, Others) And Competitive Landscape
| Product Code: ETC5523838 | Publication Date: Nov 2023 | Updated Date: Apr 2026 | Product Type: Market Research Report | |
| Publisher: 6Wresearch | Author: Ravi Bhandari | No. of Pages: 60 | No. of Figures: 30 | No. of Tables: 5 |
Slovenia Liqueurs Market Size (2020-2030)
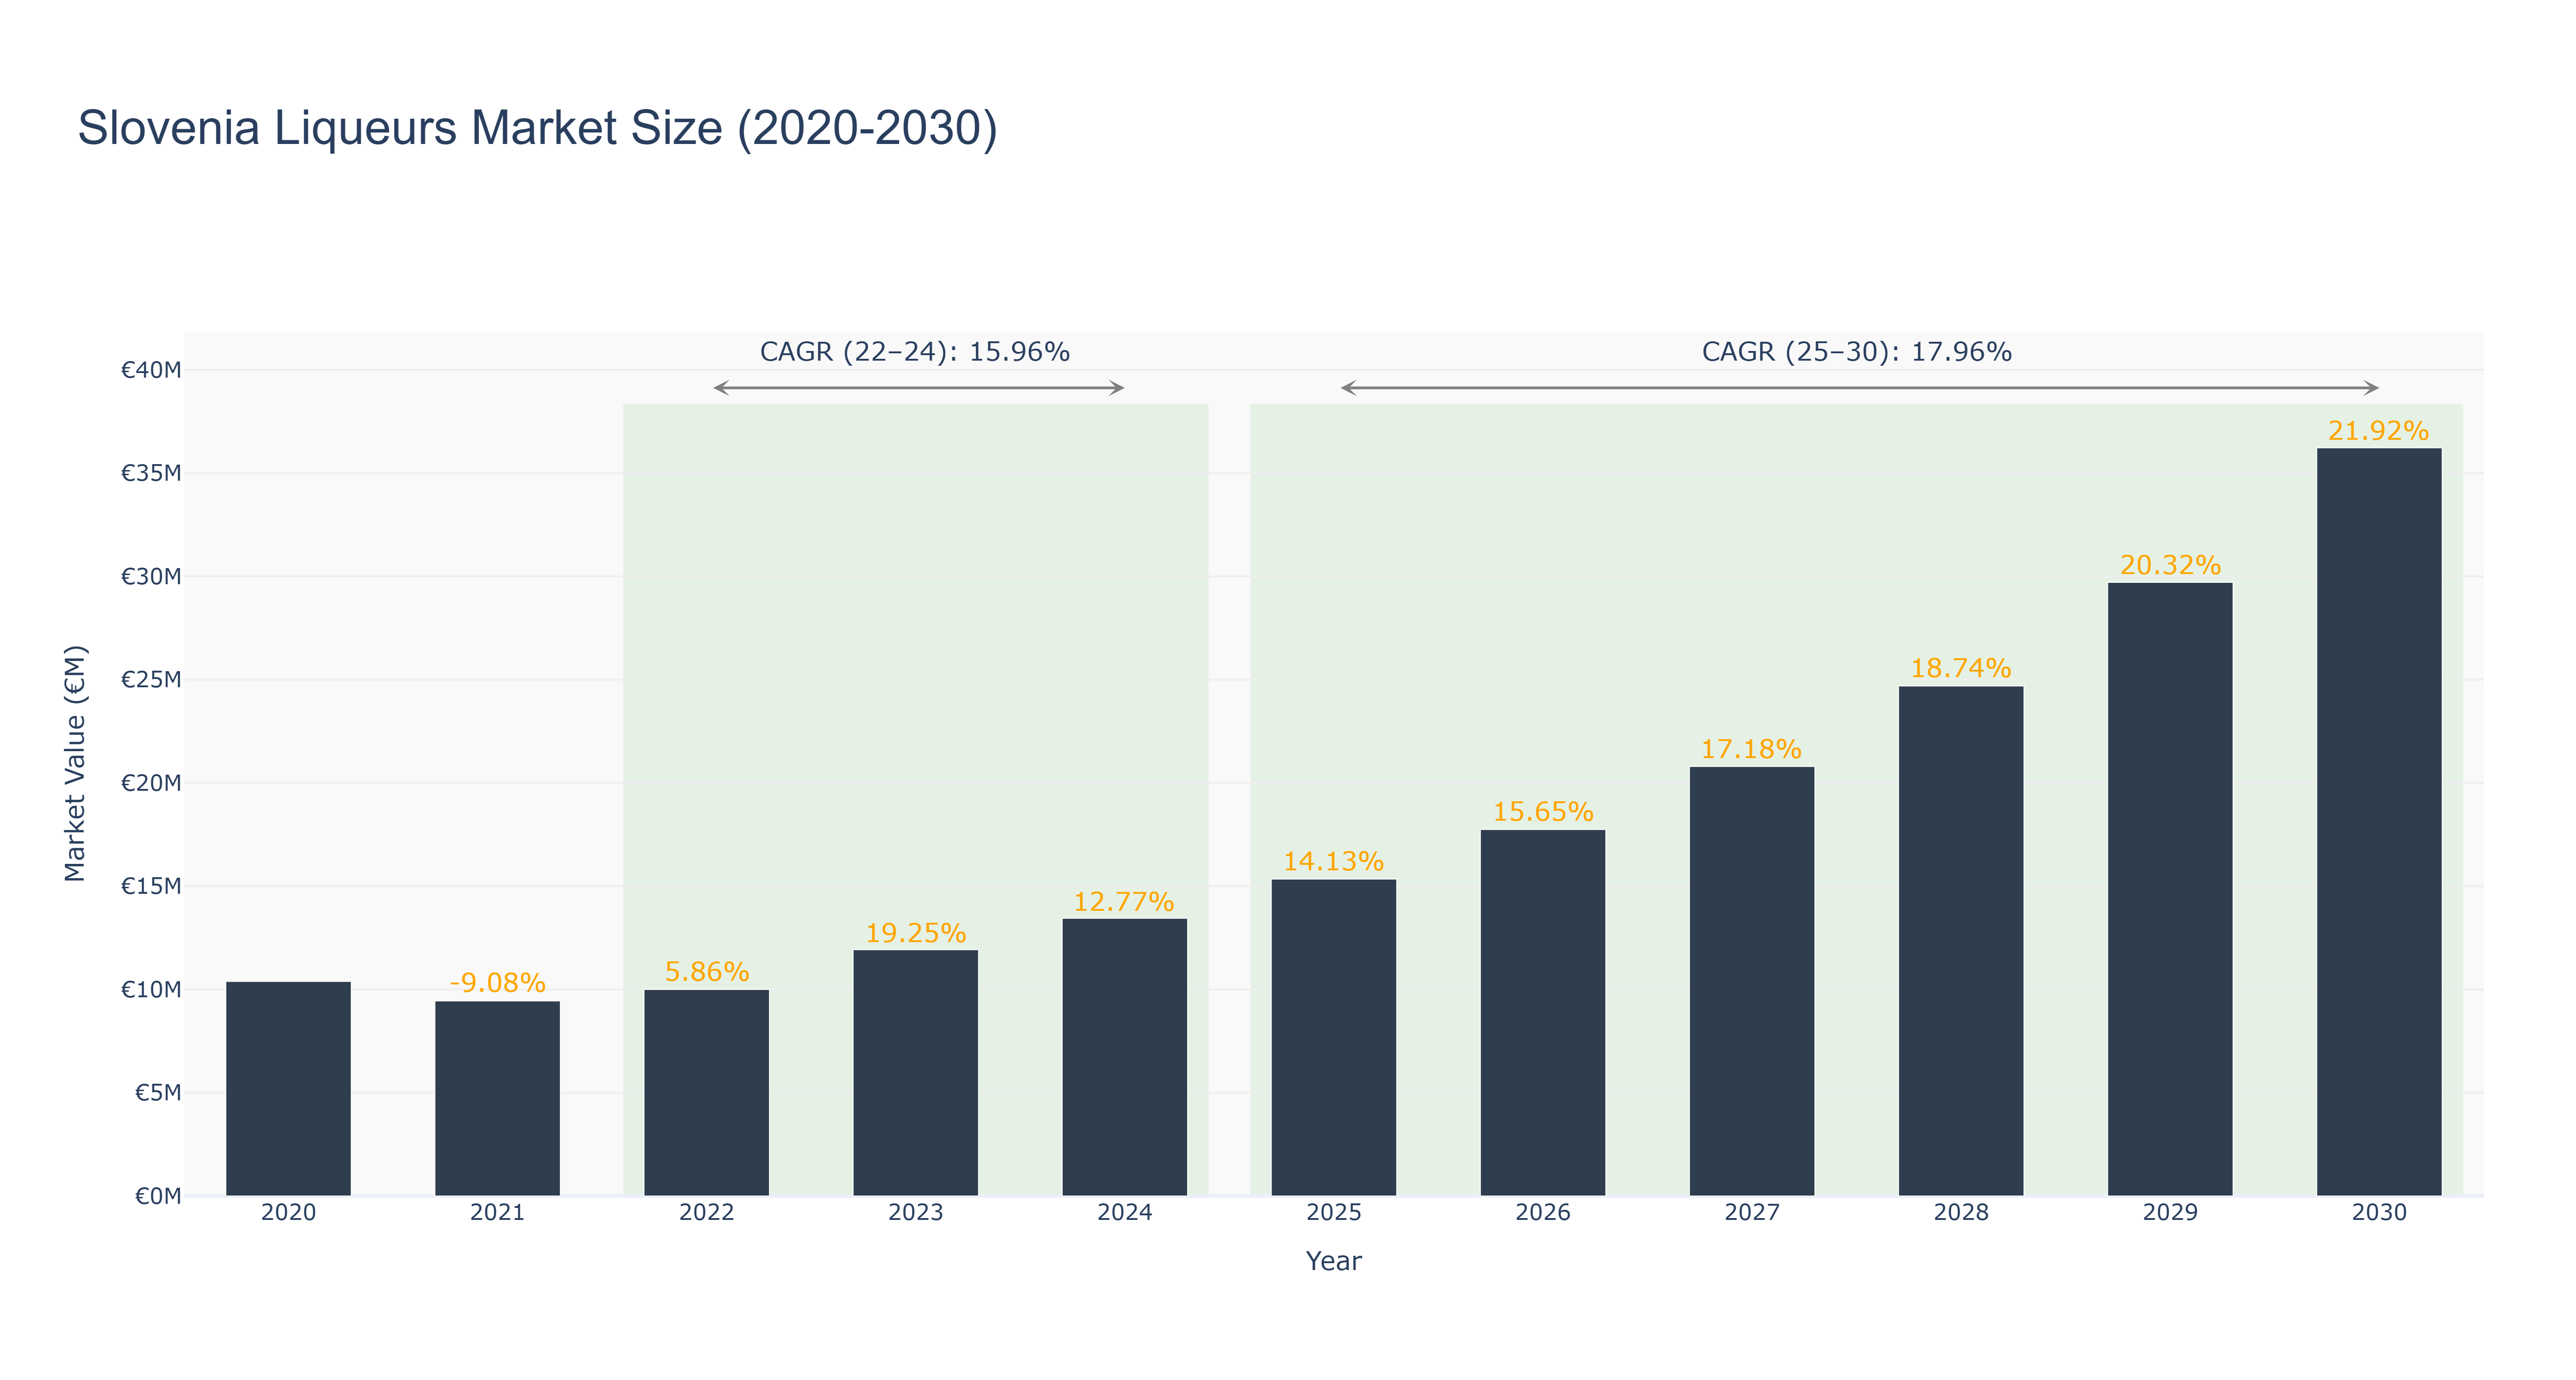
Slovenia Liqueurs Market has shown a steady growth trajectory over the years. The market peaked at €36.23 million in 2030 with a strong CAGR of 21.92% from 2025 to 2030. Notably, the market experienced a significant growth phase from 2022 to 2030, driven by increasing consumer demand for premium liqueurs and a growing trend towards craft spirits. The forecasted growth is attributed to the market's ability to innovate and cater to evolving consumer preferences. Recent developments in the market include collaborations with local distilleries to create unique flavors and expansion into international markets to capitalize on the growing global interest in artisanal spirits. This market trend showcases the resilience and adaptability of the Slovenia Liqueurs Market in meeting changing consumer needs and preferences.
Slovenia Liqueurs Market: Production & Trade Performance (2019-2025)
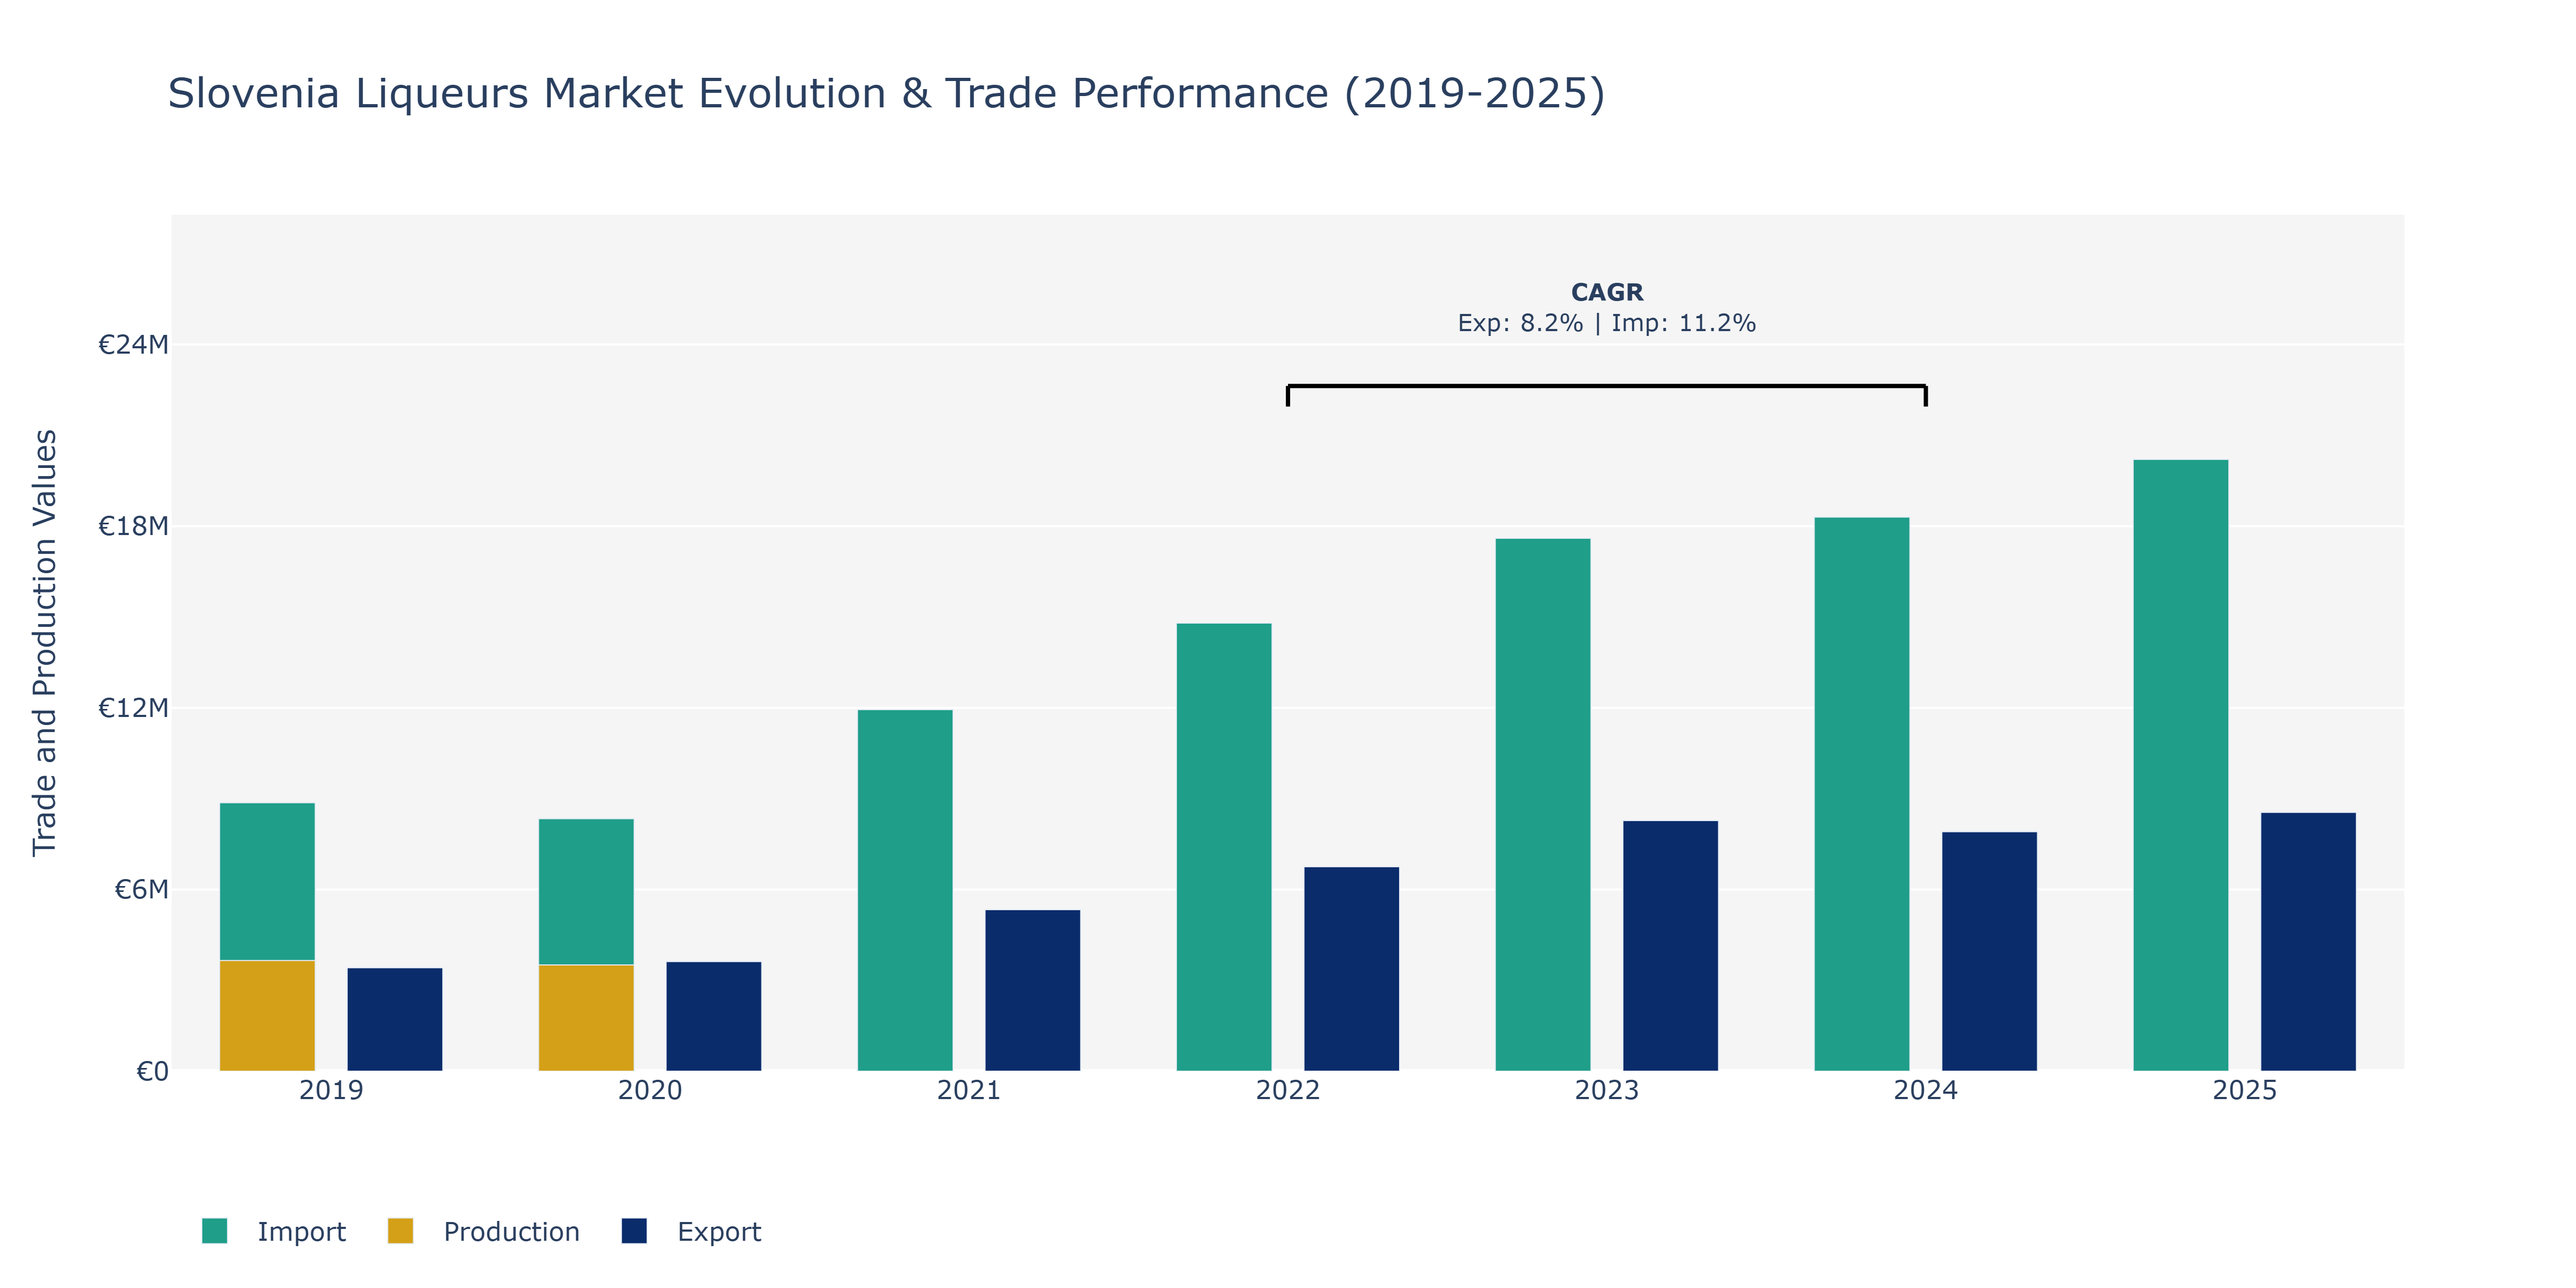
Between 2019 and 2025, Slovenia's Liqueurs Market experienced notable shifts in its key metrics. Exports demonstrated a consistent upward trajectory, rising from €3.41 million in 2019 to approximately €8.55 million in 2025, reflecting a growing international demand for Slovenian liqueurs. Conversely, imports fluctuated over the period, reaching a peak of around €20.20 million in 2025 after a drop in 2020. Production value also saw variations, declining from €3.65 million in 2019 to €3.51 million in 2020 before stabilizing around this level. The surge in exports can be attributed to the increasing popularity of Slovenian liqueurs globally, potentially driven by successful marketing strategies, product innovation, and expanding distribution networks. On the other hand, import fluctuations may be influenced by changing consumer preferences, economic conditions, and international trade agreements impacting the availability of foreign liqueurs in the domestic market.
Key Highlights of the Report:
- Slovenia Liqueurs Market Outlook
- Market Size of Slovenia Liqueurs Market, 2025
- Forecast of Slovenia Liqueurs Market, 2032
- Historical Data and Forecast of Slovenia Liqueurs Revenues & Volume for the Period 2022-2032F
- Slovenia Liqueurs Market Trend Evolution
- Slovenia Liqueurs Market Drivers and Challenges
- Slovenia Liqueurs Price Trends
- Slovenia Liqueurs Porter`s Five Forces
- Slovenia Liqueurs Industry Life Cycle
- Historical Data and Forecast of Slovenia Liqueurs Market Revenues & Volume By Type for the Period 2022-2032F
- Historical Data and Forecast of Slovenia Liqueurs Market Revenues & Volume By Neutrals/Bitters for the Period 2022-2032F
- Historical Data and Forecast of Slovenia Liqueurs Market Revenues & Volume By Creams for the Period 2022-2032F
- Historical Data and Forecast of Slovenia Liqueurs Market Revenues & Volume By Fruit Flavored for the Period 2022-2032F
- Historical Data and Forecast of Slovenia Liqueurs Market Revenues & Volume By Others for the Period 2022-2032F
- Historical Data and Forecast of Slovenia Liqueurs Market Revenues & Volume By Distribution Channel for the Period 2022-2032F
- Historical Data and Forecast of Slovenia Liqueurs Market Revenues & Volume By Convenience Stores for the Period 2022-2032F
- Historical Data and Forecast of Slovenia Liqueurs Market Revenues & Volume By On Premises for the Period 2022-2032F
- Historical Data and Forecast of Slovenia Liqueurs Market Revenues & Volume By Retailers for the Period 2022-2032F
- Historical Data and Forecast of Slovenia Liqueurs Market Revenues & Volume By Supermarkets for the Period 2022-2032F
- Historical Data and Forecast of Slovenia Liqueurs Market Revenues & Volume By Packaging for the Period 2022-2032F
- Historical Data and Forecast of Slovenia Liqueurs Market Revenues & Volume By Glass for the Period 2022-2032F
- Historical Data and Forecast of Slovenia Liqueurs Market Revenues & Volume By PET Bottle for the Period 2022-2032F
- Historical Data and Forecast of Slovenia Liqueurs Market Revenues & Volume By Metal Can for the Period 2022-2032F
- Historical Data and Forecast of Slovenia Liqueurs Market Revenues & Volume By Others for the Period 2022-2032F
- Slovenia Liqueurs Import Export Trade Statistics
- Market Opportunity Assessment By Type
- Market Opportunity Assessment By Distribution Channel
- Market Opportunity Assessment By Packaging
- Slovenia Liqueurs Top Companies Market Share
- Slovenia Liqueurs Competitive Benchmarking By Technical and Operational Parameters
- Slovenia Liqueurs Company Profiles
- Slovenia Liqueurs Key Strategic Recommendations
Frequently Asked Questions About the Market Study (FAQs):
6Wresearch actively monitors the Slovenia Liqueurs Market and publishes its comprehensive annual report, highlighting emerging trends, growth drivers, revenue analysis, and forecast outlook. Our insights help businesses to make data-backed strategic decisions with ongoing market dynamics. Our analysts track relevent industries related to the Slovenia Liqueurs Market, allowing our clients with actionable intelligence and reliable forecasts tailored to emerging regional needs.
Yes, we provide customisation as per your requirements. To learn more, feel free to contact us on sales@6wresearch.com
1 Executive Summary |
2 Introduction |
2.1 Key Highlights of the Report |
2.2 Report Description |
2.3 Market Scope & Segmentation |
2.4 Research Methodology |
2.5 Assumptions |
3 Slovenia Liqueurs Market Overview |
3.1 Slovenia Country Macro Economic Indicators |
3.2 Slovenia Liqueurs Market Revenues & Volume, 2022 & 2032F |
3.3 Slovenia Liqueurs Market - Industry Life Cycle |
3.4 Slovenia Liqueurs Market - Porter's Five Forces |
3.5 Slovenia Liqueurs Market Revenues & Volume Share, By Type, 2022 & 2032F |
3.6 Slovenia Liqueurs Market Revenues & Volume Share, By Distribution Channel, 2022 & 2032F |
3.7 Slovenia Liqueurs Market Revenues & Volume Share, By Packaging, 2022 & 2032F |
4 Slovenia Liqueurs Market Dynamics |
4.1 Impact Analysis |
4.2 Market Drivers |
4.2.1 Increasing consumer interest in craft and artisanal products |
4.2.2 Growing popularity of mixology and cocktail culture in Slovenia |
4.2.3 Rise in disposable income leading to higher spending on premium liqueurs |
4.3 Market Restraints |
4.3.1 Stringent regulations on alcohol advertising and marketing in Slovenia |
4.3.2 Competition from other alcoholic beverages like wine and beer |
4.3.3 Fluctuating raw material prices affecting production costs |
5 Slovenia Liqueurs Market Trends |
6 Slovenia Liqueurs Market Segmentations |
6.1 Slovenia Liqueurs Market, By Type |
6.1.1 Overview and Analysis |
6.1.2 Slovenia Liqueurs Market Revenues & Volume, By Neutrals/Bitters, 2022-2032F |
6.1.3 Slovenia Liqueurs Market Revenues & Volume, By Creams, 2022-2032F |
6.1.4 Slovenia Liqueurs Market Revenues & Volume, By Fruit Flavored, 2022-2032F |
6.1.5 Slovenia Liqueurs Market Revenues & Volume, By Others, 2022-2032F |
6.2 Slovenia Liqueurs Market, By Distribution Channel |
6.2.1 Overview and Analysis |
6.2.2 Slovenia Liqueurs Market Revenues & Volume, By Convenience Stores, 2022-2032F |
6.2.3 Slovenia Liqueurs Market Revenues & Volume, By On Premises, 2022-2032F |
6.2.4 Slovenia Liqueurs Market Revenues & Volume, By Retailers, 2022-2032F |
6.2.5 Slovenia Liqueurs Market Revenues & Volume, By Supermarkets, 2022-2032F |
6.3 Slovenia Liqueurs Market, By Packaging |
6.3.1 Overview and Analysis |
6.3.2 Slovenia Liqueurs Market Revenues & Volume, By Glass, 2022-2032F |
6.3.3 Slovenia Liqueurs Market Revenues & Volume, By PET Bottle, 2022-2032F |
6.3.4 Slovenia Liqueurs Market Revenues & Volume, By Metal Can, 2022-2032F |
6.3.5 Slovenia Liqueurs Market Revenues & Volume, By Others, 2022-2032F |
7 Slovenia Liqueurs Market Import-Export Trade Statistics |
7.1 Slovenia Liqueurs Market Export to Major Countries |
7.2 Slovenia Liqueurs Market Imports from Major Countries |
8 Slovenia Liqueurs Market Key Performance Indicators |
8.1 Number of new product launches in the liqueurs market |
8.2 Growth in the number of bars and restaurants offering a diverse selection of liqueurs |
8.3 Increase in social media engagement and influencer collaborations related to liqueur consumption |
9 Slovenia Liqueurs Market - Opportunity Assessment |
9.1 Slovenia Liqueurs Market Opportunity Assessment, By Type, 2022 & 2032F |
9.2 Slovenia Liqueurs Market Opportunity Assessment, By Distribution Channel, 2022 & 2032F |
9.3 Slovenia Liqueurs Market Opportunity Assessment, By Packaging, 2022 & 2032F |
10 Slovenia Liqueurs Market - Competitive Landscape |
10.1 Slovenia Liqueurs Market Revenue Share, By Companies, 2025 |
10.2 Slovenia Liqueurs Market Competitive Benchmarking, By Operating and Technical Parameters |
11 Company Profiles |
12 Recommendations | 13 Disclaimer |
Export potential assessment - trade Analytics for 2030
Export potential enables firms to identify high-growth global markets with greater confidence by combining advanced trade intelligence with a structured quantitative methodology. The framework analyzes emerging demand trends and country-level import patterns while integrating macroeconomic and trade datasets such as GDP and population forecasts, bilateral import–export flows, tariff structures, elasticity differentials between developed and developing economies, geographic distance, and import demand projections. Using weighted trade values from 2020–2024 as the base period to project country-to-country export potential for 2030, these inputs are operationalized through calculated drivers such as gravity model parameters, tariff impact factors, and projected GDP per-capita growth. Through an analysis of hidden potentials, demand hotspots, and market conditions that are most favorable to success, this method enables firms to focus on target countries, maximize returns, and global expansion with data, backed by accuracy.
By factoring in the projected importer demand gap that is currently unmet and could be potential opportunity, it identifies the potential for the Exporter (Country) among 190 countries, against the general trade analysis, which identifies the biggest importer or exporter.
To discover high-growth global markets and optimize your business strategy:
Click Here
Pricing
- Single User License$ 1,995
- Department License$ 2,400
- Site License$ 3,120
- Global License$ 3,795

Search
Thought Leadership and Analyst Meet


Our Clients
Latest Reports
- India Ultrasonic Smart Water Meter Market (2026-2032) | Outlook, Competition, Drivers, Trends, Demand, Competitive, Strategic Insights, Companies, Challenges, Strategy, Consumer Insights, Analysis, Opportunities, Growth, Size, Share, Industry, Revenue, Segments, Value, Segmentation, Supply, Forecast, Restraints,
- India Electromagnetic Bulk Flow Meter Market (2026-2032) | Analysis, Challenges, Strategic Insights, Supply, Forecast, Growth, Share, Consumer Insights, Competitive, Value, Outlook, Size & Demand,
- India Battery Powered Bulk Flow Meter Market (2026-2032) | Outlook, Analysis, Competitive Landscape, Growth, Size, Trends, Value, Revenue, Companies, Segmentation, Share & Forecast
- Bosnia and Herzegovina Fuel-Efficient Winglets Market (2026-2032) | Growth, Competition, Strategy, Restraints, Trends, Challenges, segmentation, Value, Outlook, Investment Opportunities, Analysis, Revenue, Companies, Insights, Pricing, Size, Drivers, Demand, Share, Forecast
- Canada Cloud CFD Market (2026-2032) | Size & Revenue, Industry, Growth, Competitive Landscape, Forecast, Segmentation, Value, Outlook, Trends, Share, Analysis, Companies
- Taiwan Food Delivery Platform Market (2026-2032) | Companies, Outlook, Analysis, Trends, Value, Revenue, Segmentation, Share, Forecast, Competitive Landscape, Growth, Size & Forecast
- United Kingdom (UK) Long-term Care Insurance Market (2026-2032) | Growth, Share, Consumer Insights, Drivers, Opportunities, Competition, Pricing Analysis, Segments, Restraints, Companies, Competitive, Value, Outlook, Size, Demand, Analysis, Challenges, Strategic Insights, Investment Trends, Revenue, Trends, Supply, Forecast
- United Kingdom (UK) Long Term Care Market (2026-2032) | Companies, Outlook, Analysis, Trends, Value, Revenue, Segmentation, Share, Forecast, Competitive Landscape, Growth, Size & Forecast
- Iraq Insulation and Waterproofing Market (2026-2032) | Outlook, Drivers, Growth, Size, Share, Industry, Revenue, Trends, Demand, Competitive, Strategic Insights, Opportunities, Segments, Companies, Challenges, Strategy, Consumer Insights, Analysis, Investment Trends, Value, Segmentation, Forecast, Restraints
- India Switchgear Market Outlook (2026-2032) | Size, Share, Trends, Growth, Revenue, Forecast, Analysis, Value, Outlook
Industry Events and Analyst Meet

HIMTEX 2026

India Refining Summit 2026

India EV Show 2026

EV tech India Expo 2026

Auto Tech Asia 2026
Whitepaper
- Middle East & Africa Commercial Security Market Click here to view more.
- Middle East & Africa Fire Safety Systems & Equipment Market Click here to view more.
- GCC Drone Market Click here to view more.
- Middle East Lighting Fixture Market Click here to view more.
- GCC Physical & Perimeter Security Market Click here to view more.
6WResearch In News
- Doha a strategic location for EV manufacturing hub: IPA Qatar
- Demand for luxury TVs surging in the GCC, says Samsung
- Empowering Growth: The Thriving Journey of Bangladesh’s Cable Industry
- Demand for luxury TVs surging in the GCC, says Samsung
- Video call with a traditional healer? Once unthinkable, it’s now common in South Africa
- Intelligent Buildings To Smooth GCC’s Path To Net Zero