Slovenia Mannequin Head Market (2026-2032) | Companies, Forecast, Share, Industry, Segmentation, Growth, Value, Size & Revenue, Outlook, Competitive Landscape, Analysis, Trends
Market Forecast By Type (Men, Women, Infants & Toddlers), By Application (Hairstyling & Barbering, Makeup Artistry, Wig & Hairpiece Design, Hat & Accessories) And Competitive Landscape
| Product Code: ETC9320891 | Publication Date: Sep 2024 | Updated Date: Apr 2026 | Product Type: Market Research Report | |
| Publisher: 6Wresearch | Author: Dhaval Chaurasia | No. of Pages: 75 | No. of Figures: 35 | No. of Tables: 20 |
Slovenia Mannequin Head Market Size (2020-2030)
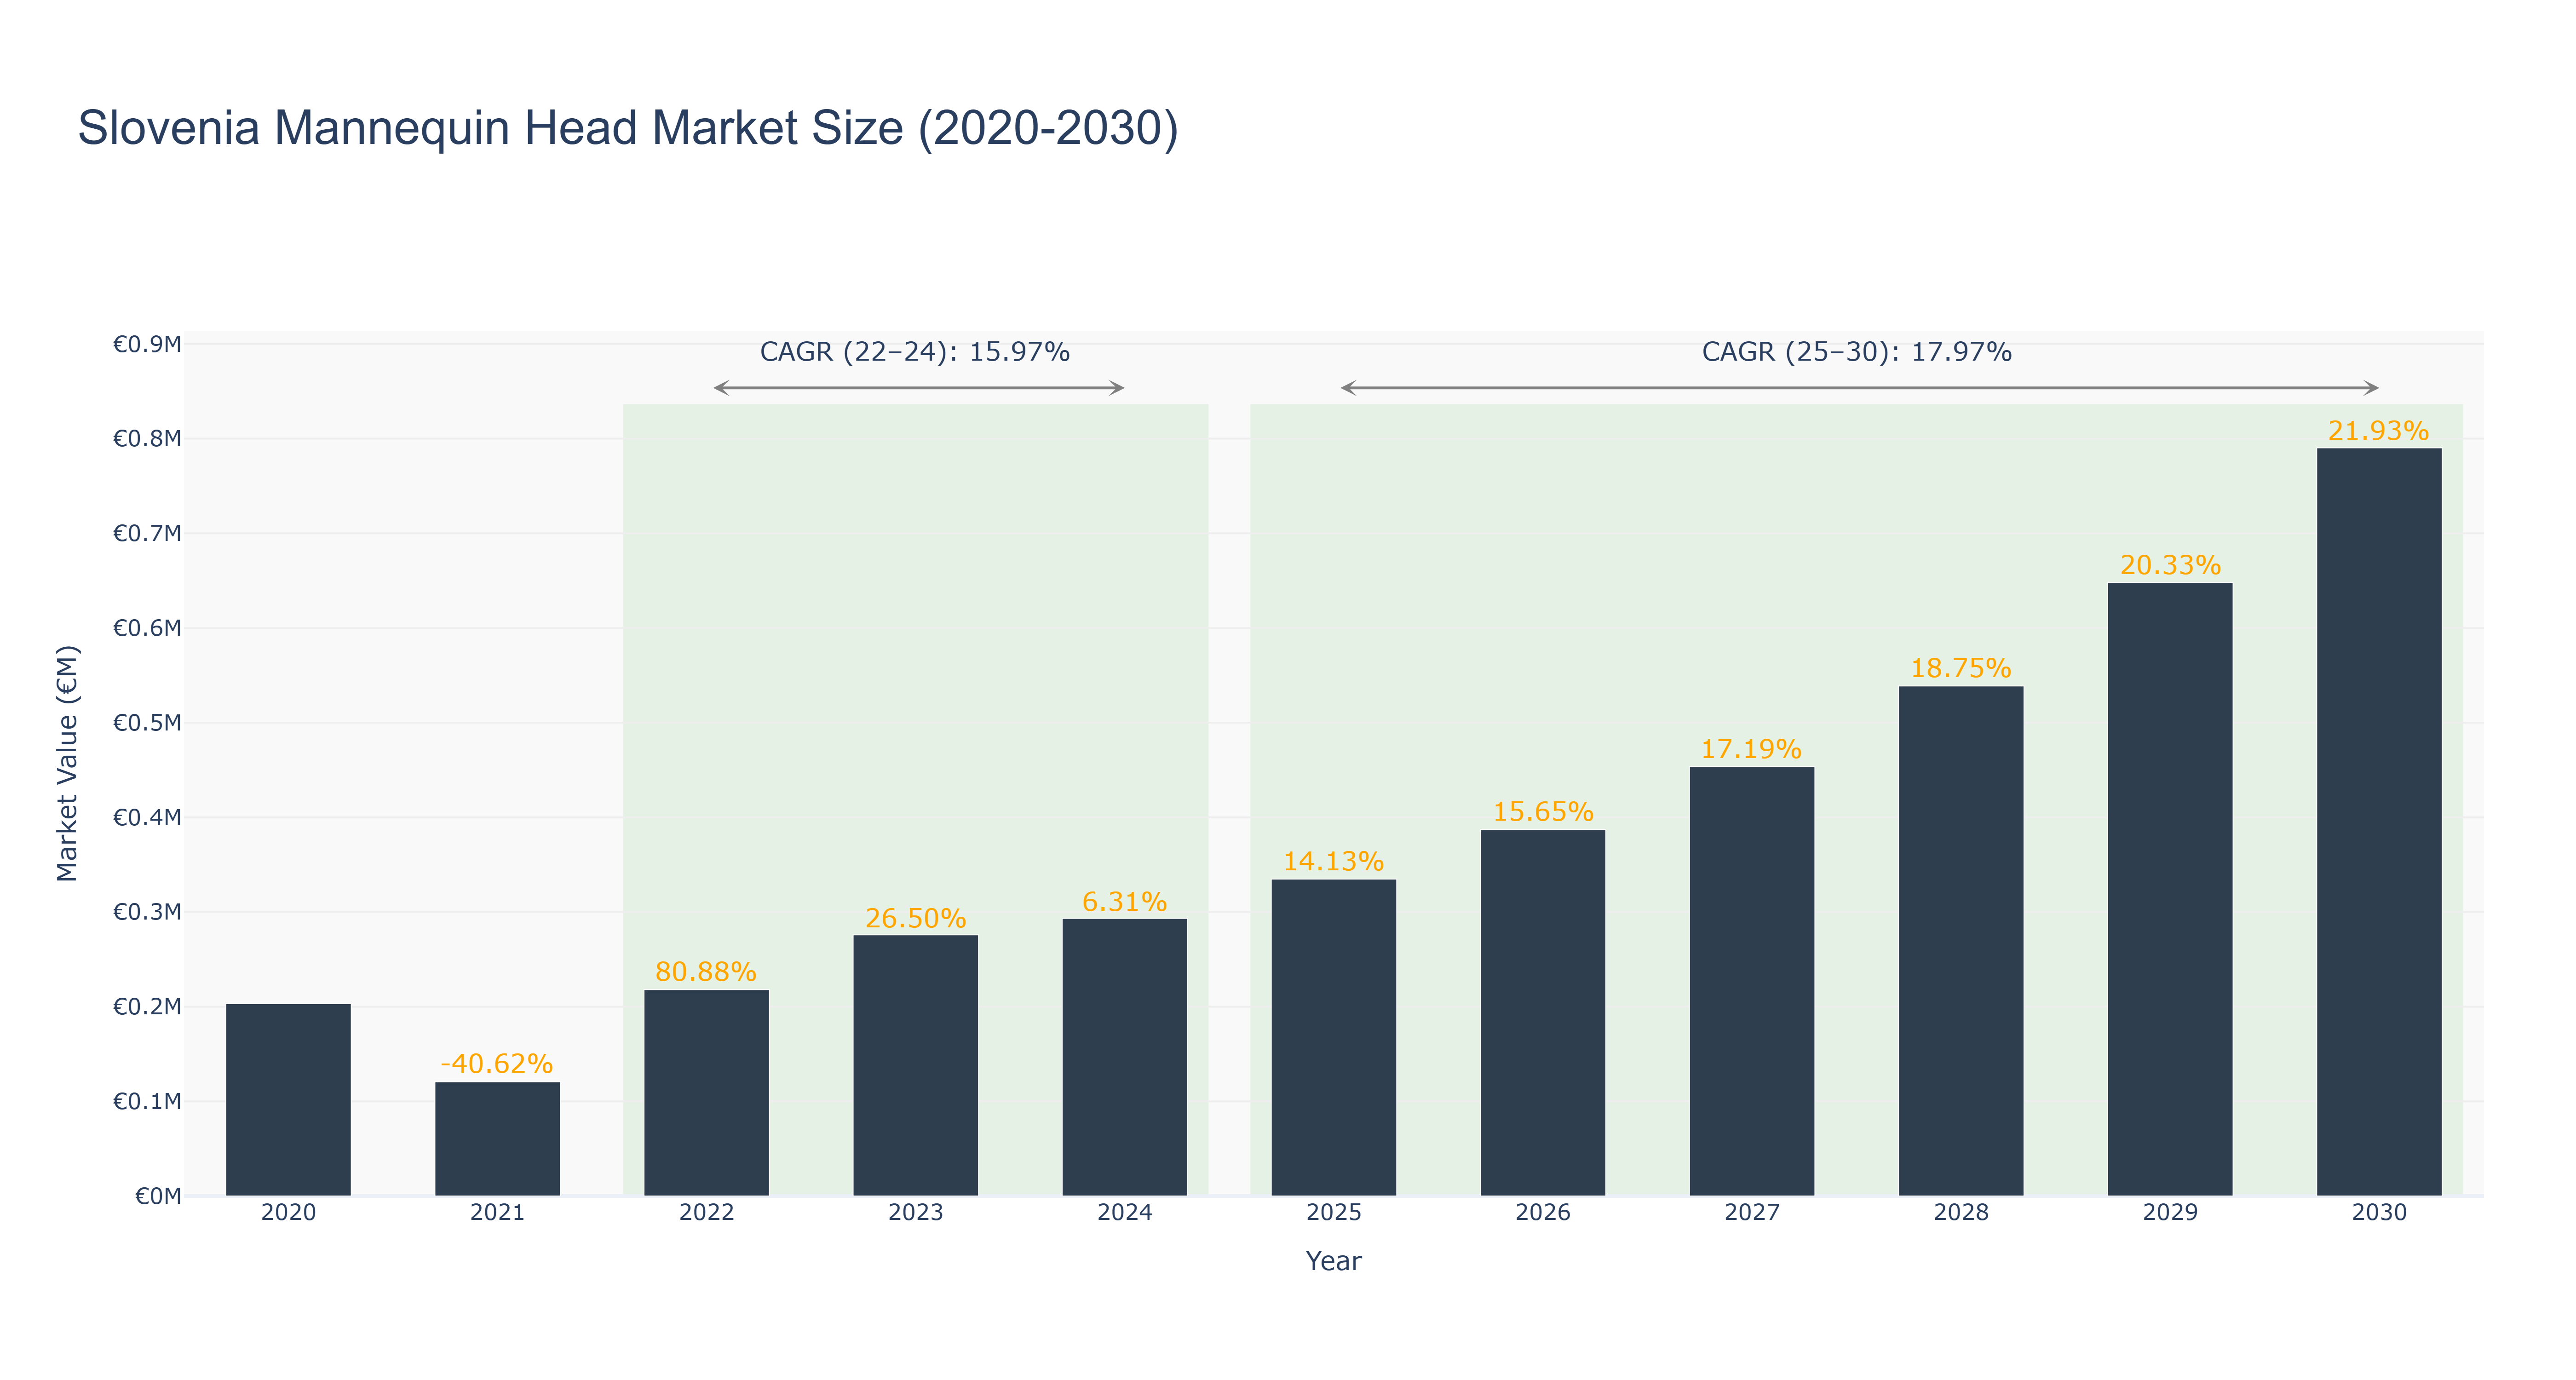
Slovenia's Mannequin Head Market has shown a fluctuating trend over the years. The peak market size of €0.79 million was achieved in 2030, with a steady growth trajectory. From 2020 to 2024, the market size decreased from €0.20 million to €0.29 million due to a decline in demand and economic challenges. However, from 2025 to 2030, a forecasted growth is expected, with the market size projected to reach €0.79 million by 2030. The CAGR for the periods 2022-24 and 2025-30 are 15.97% and 17.97% respectively. Industry drivers such as increased consumer spending on beauty products and advancements in mannequin technology are likely to fuel this growth. In the near future, Slovenia's Mannequin Head Market is set to witness the launch of innovative mannequin designs tailored to meet evolving customer preferences, driving further market expansion.
Slovenia Mannequin Head Market: Production & Trade Performance (2019-2025)
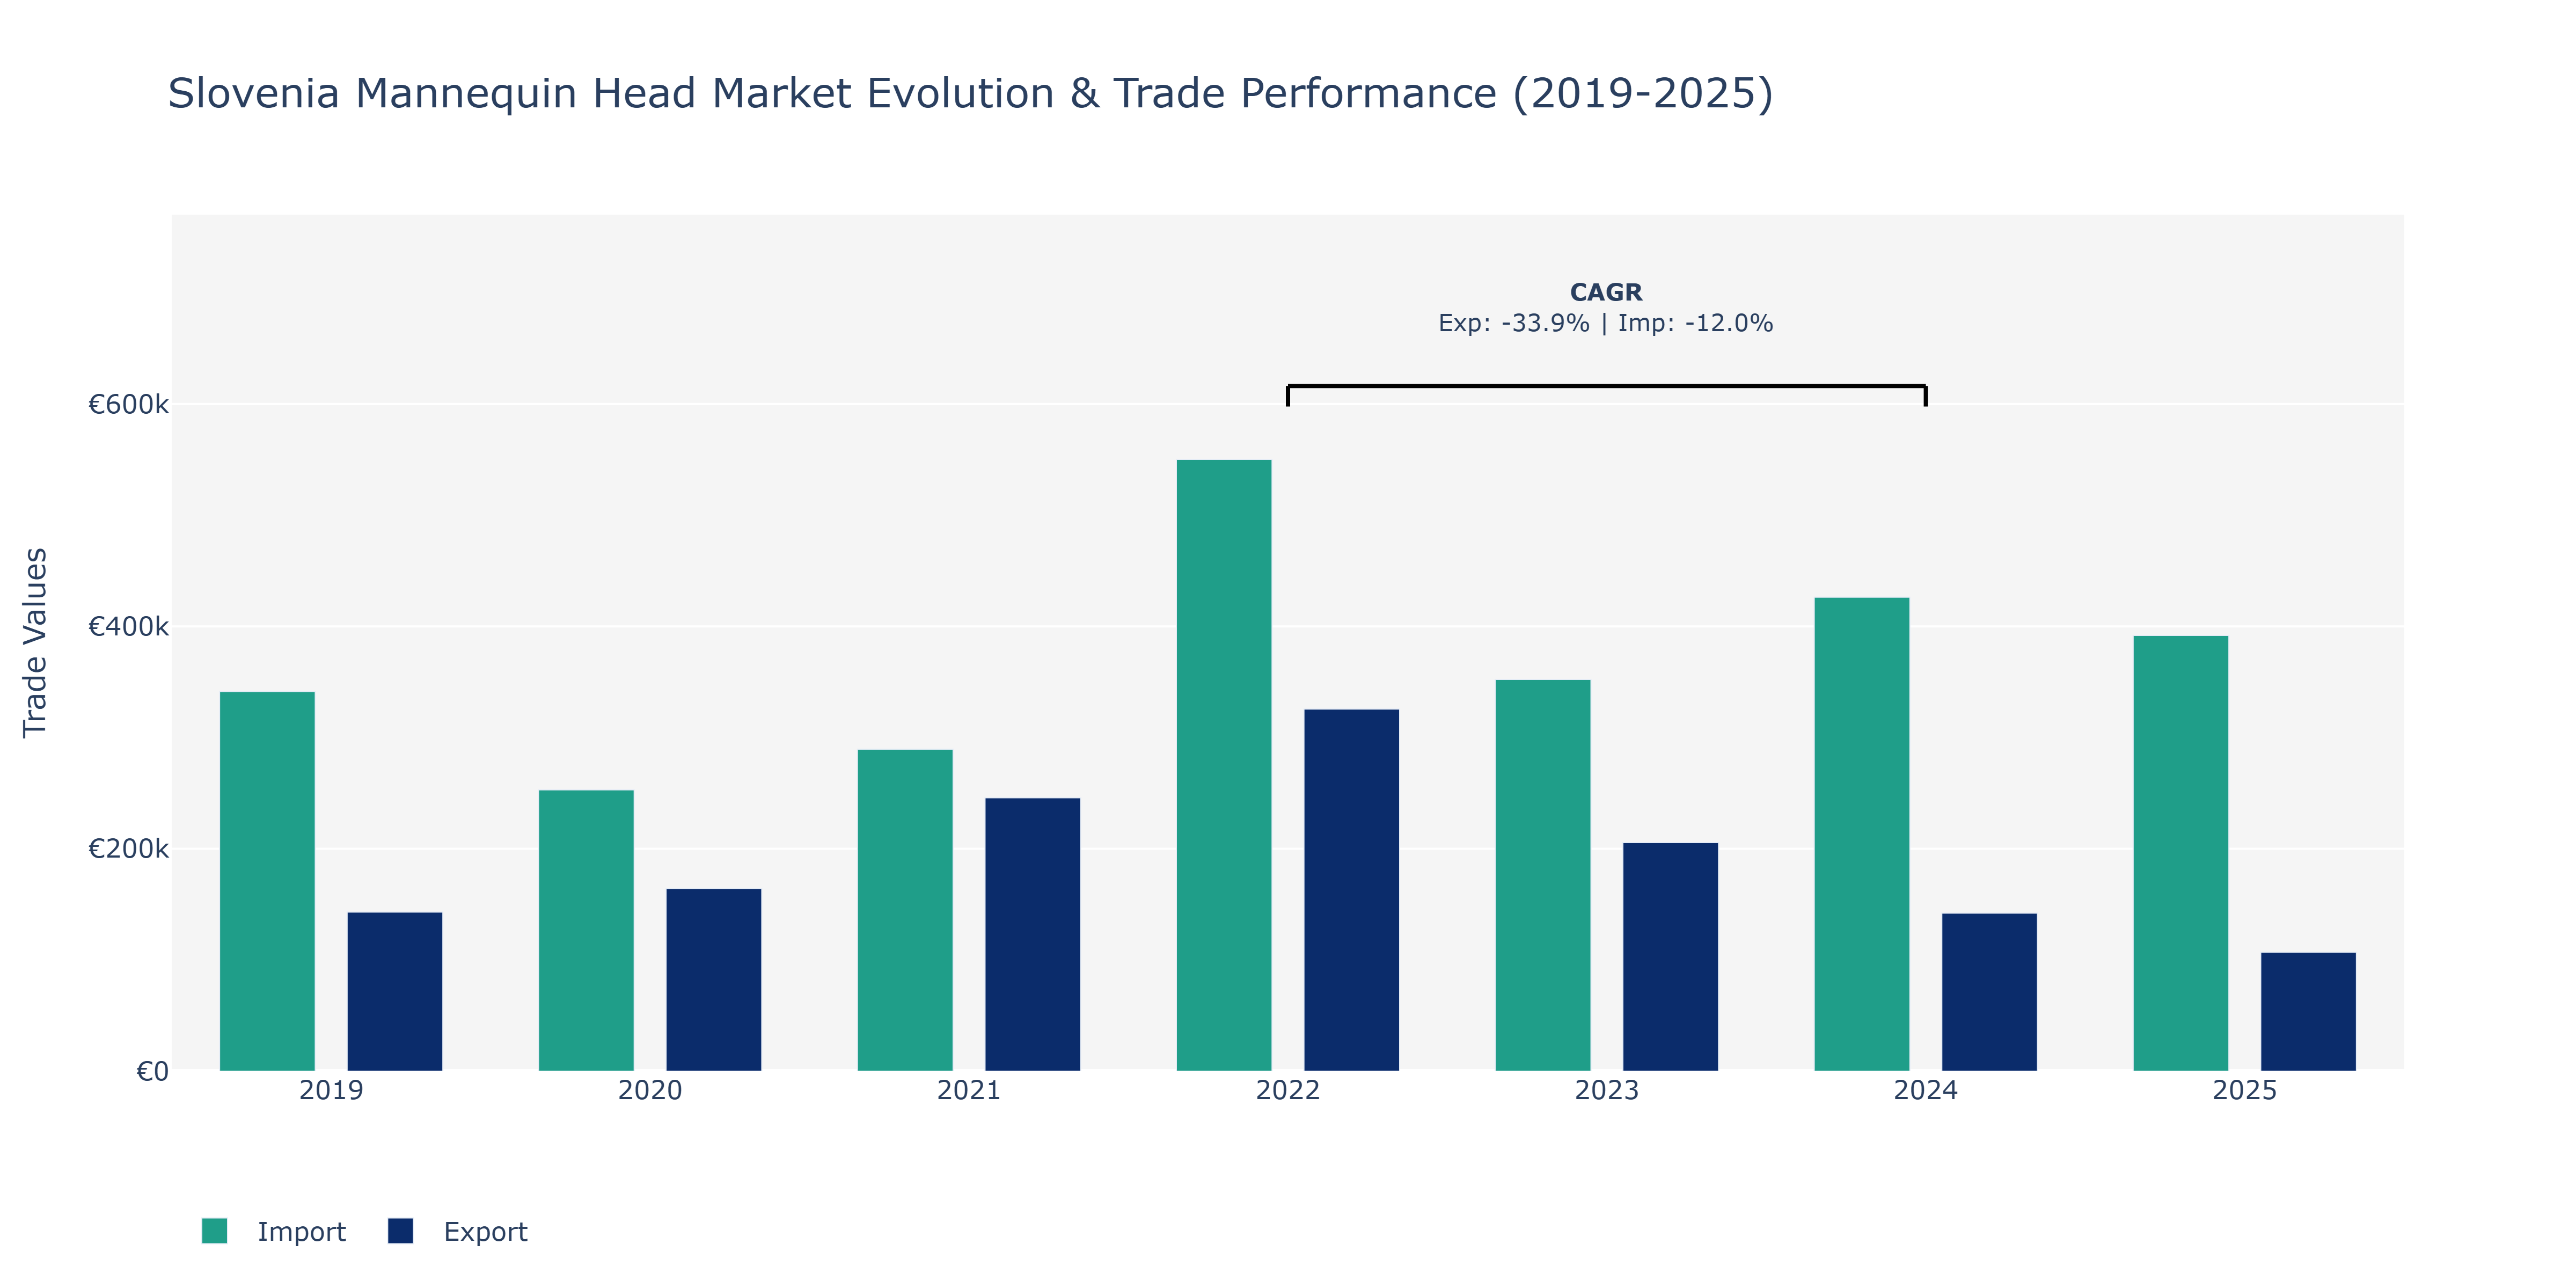
Between 2019 and 2025, Slovenia's Mannequin Head Market witnessed notable fluctuations in both exports and imports. Exports surged from €143.14 thousand in 2019 to a peak of €325.65 thousand in 2022 before experiencing a sharp decline to €106.87 thousand in 2025. In contrast, imports followed a more varied trajectory, reaching €550.17 thousand in 2022 from €341.45 thousand in 2019, with a subsequent decrease to €391.87 thousand in 2025. The decline in exports post-2022 could be attributed to changing consumer preferences, possibly influenced by global fashion trends impacting demand for mannequin heads. On the import side, the fluctuations may reflect shifts in supply chain dynamics, potentially impacted by trade regulations or sourcing strategies aimed at enhancing product quality. These trends suggest the need for market players to adapt their strategies to the evolving market conditions to maintain competitiveness in the industry.
Key Highlights of the Report:
- Slovenia Mannequin Head Market Outlook
- Market Size of Slovenia Mannequin Head Market, 2025
- Forecast of Slovenia Mannequin Head Market, 2032
- Historical Data and Forecast of Slovenia Mannequin Head Revenues & Volume for the Period 2022-2032F
- Slovenia Mannequin Head Market Trend Evolution
- Slovenia Mannequin Head Market Drivers and Challenges
- Slovenia Mannequin Head Price Trends
- Slovenia Mannequin Head Porter's Five Forces
- Slovenia Mannequin Head Industry Life Cycle
- Historical Data and Forecast of Slovenia Mannequin Head Market Revenues & Volume By Type for the Period 2022-2032F
- Historical Data and Forecast of Slovenia Mannequin Head Market Revenues & Volume By Men for the Period 2022-2032F
- Historical Data and Forecast of Slovenia Mannequin Head Market Revenues & Volume By Women for the Period 2022-2032F
- Historical Data and Forecast of Slovenia Mannequin Head Market Revenues & Volume By Infants & Toddlers for the Period 2022-2032F
- Historical Data and Forecast of Slovenia Mannequin Head Market Revenues & Volume By Application for the Period 2022-2032F
- Historical Data and Forecast of Slovenia Mannequin Head Market Revenues & Volume By Hairstyling & Barbering for the Period 2022-2032F
- Historical Data and Forecast of Slovenia Mannequin Head Market Revenues & Volume By Makeup Artistry for the Period 2022-2032F
- Historical Data and Forecast of Slovenia Mannequin Head Market Revenues & Volume By Wig & Hairpiece Design for the Period 2022-2032F
- Historical Data and Forecast of Slovenia Mannequin Head Market Revenues & Volume By Hat & Accessories for the Period 2022-2032F
- Slovenia Mannequin Head Import Export Trade Statistics
- Market Opportunity Assessment By Type
- Market Opportunity Assessment By Application
- Slovenia Mannequin Head Top Companies Market Share
- Slovenia Mannequin Head Competitive Benchmarking By Technical and Operational Parameters
- Slovenia Mannequin Head Company Profiles
- Slovenia Mannequin Head Key Strategic Recommendations
Frequently Asked Questions About the Market Study (FAQs):
6Wresearch actively monitors the Slovenia Mannequin Head Market and publishes its comprehensive annual report, highlighting emerging trends, growth drivers, revenue analysis, and forecast outlook. Our insights help businesses to make data-backed strategic decisions with ongoing market dynamics. Our analysts track relevent industries related to the Slovenia Mannequin Head Market, allowing our clients with actionable intelligence and reliable forecasts tailored to emerging regional needs.
Yes, we provide customisation as per your requirements. To learn more, feel free to contact us on sales@6wresearch.com
1 Executive Summary |
2 Introduction |
2.1 Key Highlights of the Report |
2.2 Report Description |
2.3 Market Scope & Segmentation |
2.4 Research Methodology |
2.5 Assumptions |
3 Slovenia Mannequin Head Market Overview |
3.1 Slovenia Country Macro Economic Indicators |
3.2 Slovenia Mannequin Head Market Revenues & Volume, 2022 & 2032F |
3.3 Slovenia Mannequin Head Market - Industry Life Cycle |
3.4 Slovenia Mannequin Head Market - Porter's Five Forces |
3.5 Slovenia Mannequin Head Market Revenues & Volume Share, By Type, 2022 & 2032F |
3.6 Slovenia Mannequin Head Market Revenues & Volume Share, By Application, 2022 & 2032F |
4 Slovenia Mannequin Head Market Dynamics |
4.1 Impact Analysis |
4.2 Market Drivers |
4.2.1 Growing interest in fashion and beauty industry in Slovenia |
4.2.2 Increasing adoption of online platforms for purchasing beauty products |
4.2.3 Rise in demand for professional training in hairstyling and makeup artistry |
4.3 Market Restraints |
4.3.1 Limited awareness about the benefits and usage of mannequin heads |
4.3.2 High competition from international mannequin head manufacturers |
4.3.3 Challenges in maintaining quality standards and consistency in production |
5 Slovenia Mannequin Head Market Trends |
6 Slovenia Mannequin Head Market, By Types |
6.1 Slovenia Mannequin Head Market, By Type |
6.1.1 Overview and Analysis |
6.1.2 Slovenia Mannequin Head Market Revenues & Volume, By Type, 2022-2032F |
6.1.3 Slovenia Mannequin Head Market Revenues & Volume, By Men, 2022-2032F |
6.1.4 Slovenia Mannequin Head Market Revenues & Volume, By Women, 2022-2032F |
6.1.5 Slovenia Mannequin Head Market Revenues & Volume, By Infants & Toddlers, 2022-2032F |
6.2 Slovenia Mannequin Head Market, By Application |
6.2.1 Overview and Analysis |
6.2.2 Slovenia Mannequin Head Market Revenues & Volume, By Hairstyling & Barbering, 2022-2032F |
6.2.3 Slovenia Mannequin Head Market Revenues & Volume, By Makeup Artistry, 2022-2032F |
6.2.4 Slovenia Mannequin Head Market Revenues & Volume, By Wig & Hairpiece Design, 2022-2032F |
6.2.5 Slovenia Mannequin Head Market Revenues & Volume, By Hat & Accessories, 2022-2032F |
7 Slovenia Mannequin Head Market Import-Export Trade Statistics |
7.1 Slovenia Mannequin Head Market Export to Major Countries |
7.2 Slovenia Mannequin Head Market Imports from Major Countries |
8 Slovenia Mannequin Head Market Key Performance Indicators |
8.1 Average monthly searches for mannequin heads on online platforms in Slovenia |
8.2 Number of beauty schools and training institutes offering courses that require mannequin heads |
8.3 Percentage of beauty salons and hairstylists using mannequin heads for practice and training |
9 Slovenia Mannequin Head Market - Opportunity Assessment |
9.1 Slovenia Mannequin Head Market Opportunity Assessment, By Type, 2022 & 2032F |
9.2 Slovenia Mannequin Head Market Opportunity Assessment, By Application, 2022 & 2032F |
10 Slovenia Mannequin Head Market - Competitive Landscape |
10.1 Slovenia Mannequin Head Market Revenue Share, By Companies, 2025 |
10.2 Slovenia Mannequin Head Market Competitive Benchmarking, By Operating and Technical Parameters |
11 Company Profiles |
12 Recommendations |
13 Disclaimer |
Global Go To Market Strategy - 2030
Export potential enables firms to identify high-growth global markets with greater confidence by combining advanced trade intelligence with a structured quantitative methodology. The framework analyzes emerging demand trends and country-level import patterns while integrating macroeconomic and trade datasets such as GDP and population forecasts, bilateral import–export flows, tariff structures, elasticity differentials between developed and developing economies, geographic distance, and import demand projections. Using weighted trade values from 2020–2024 as the base period to project country-to-country export potential for 2030, these inputs are operationalized through calculated drivers such as gravity model parameters, tariff impact factors, and projected GDP per-capita growth. Through an analysis of hidden potentials, demand hotspots, and market conditions that are most favorable to success, this method enables firms to focus on target countries, maximize returns, and global expansion with data, backed by accuracy.
By factoring in the projected importer demand gap that is currently unmet and could be potential opportunity, it identifies the potential for the Exporter (Country) among 190 countries, against the general trade analysis, which identifies the biggest importer or exporter.
To discover high-growth global markets and optimize your business strategy:
Click Here
Pricing
- Single User License$ 1,995
- Department License$ 2,400
- Site License$ 3,120
- Global License$ 3,795

Leadership Perspectives from Industry Events
Search
Thought Leadership and Analyst Meet


Our Clients
6WResearch In News
- Doha a strategic location for EV manufacturing hub: IPA Qatar
- Demand for luxury TVs surging in the GCC, says Samsung
- Empowering Growth: The Thriving Journey of Bangladesh’s Cable Industry
- Demand for luxury TVs surging in the GCC, says Samsung
- Video call with a traditional healer? Once unthinkable, it’s now common in South Africa
- Intelligent Buildings To Smooth GCC’s Path To Net Zero
Latest Reports
- New Zealand Aseptic Manufacturing Market (2026-2032)
- Netherlands Aseptic Manufacturing Market (2026-2032)
- Nauru Aseptic Manufacturing Market (2026-2032)
- Namibia Aseptic Manufacturing Market (2026-2032)
- Mozambique Aseptic Manufacturing Market (2026-2032)
- Montenegro Aseptic Manufacturing Market (2026-2032)
- Mongolia Aseptic Manufacturing Market (2026-2032)
- Monaco Aseptic Manufacturing Market (2026-2032)
- Micronesia Aseptic Manufacturing Market (2026-2032)
- Mauritius Aseptic Manufacturing Market (2026-2032)
Industry Events and Analyst Meet

HIMTEX 2026

India Refining Summit 2026

India EV Show 2026

EV tech India Expo 2026

Auto Tech Asia 2026
Whitepaper
- Middle East & Africa Commercial Security Market Click here to view more.
- Middle East & Africa Fire Safety Systems & Equipment Market Click here to view more.
- GCC Drone Market Click here to view more.
- Middle East Lighting Fixture Market Click here to view more.
- GCC Physical & Perimeter Security Market Click here to view more.